

TTG Index Charts & Out of the Box Stock Screen 4/19/24
TTG Index Charts & Out of the Box Stock Screen 4/19/24
Out of the Box MarketWebs Screen
US Dollar -0.2% / 30yr Bonds +0.5% / Crude -0.4% & Nat Gas +2.3% / Gold -0.2% / Copper +0.9% / BTC +1.9%
US Upcoming Economics

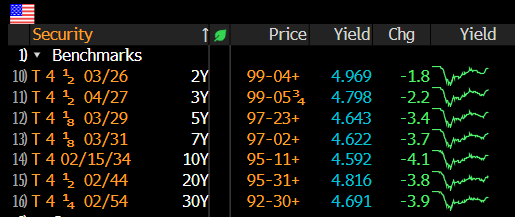
US Bond Yields
Index Updates
At TTG, I use Volume At Price in my chart analysis and I use the MarketWebs Indicator to provide Value Areas & VPOCs which indicate significant support & resistance levels. Learn More Here about Volume At Price and the MarketWebs.
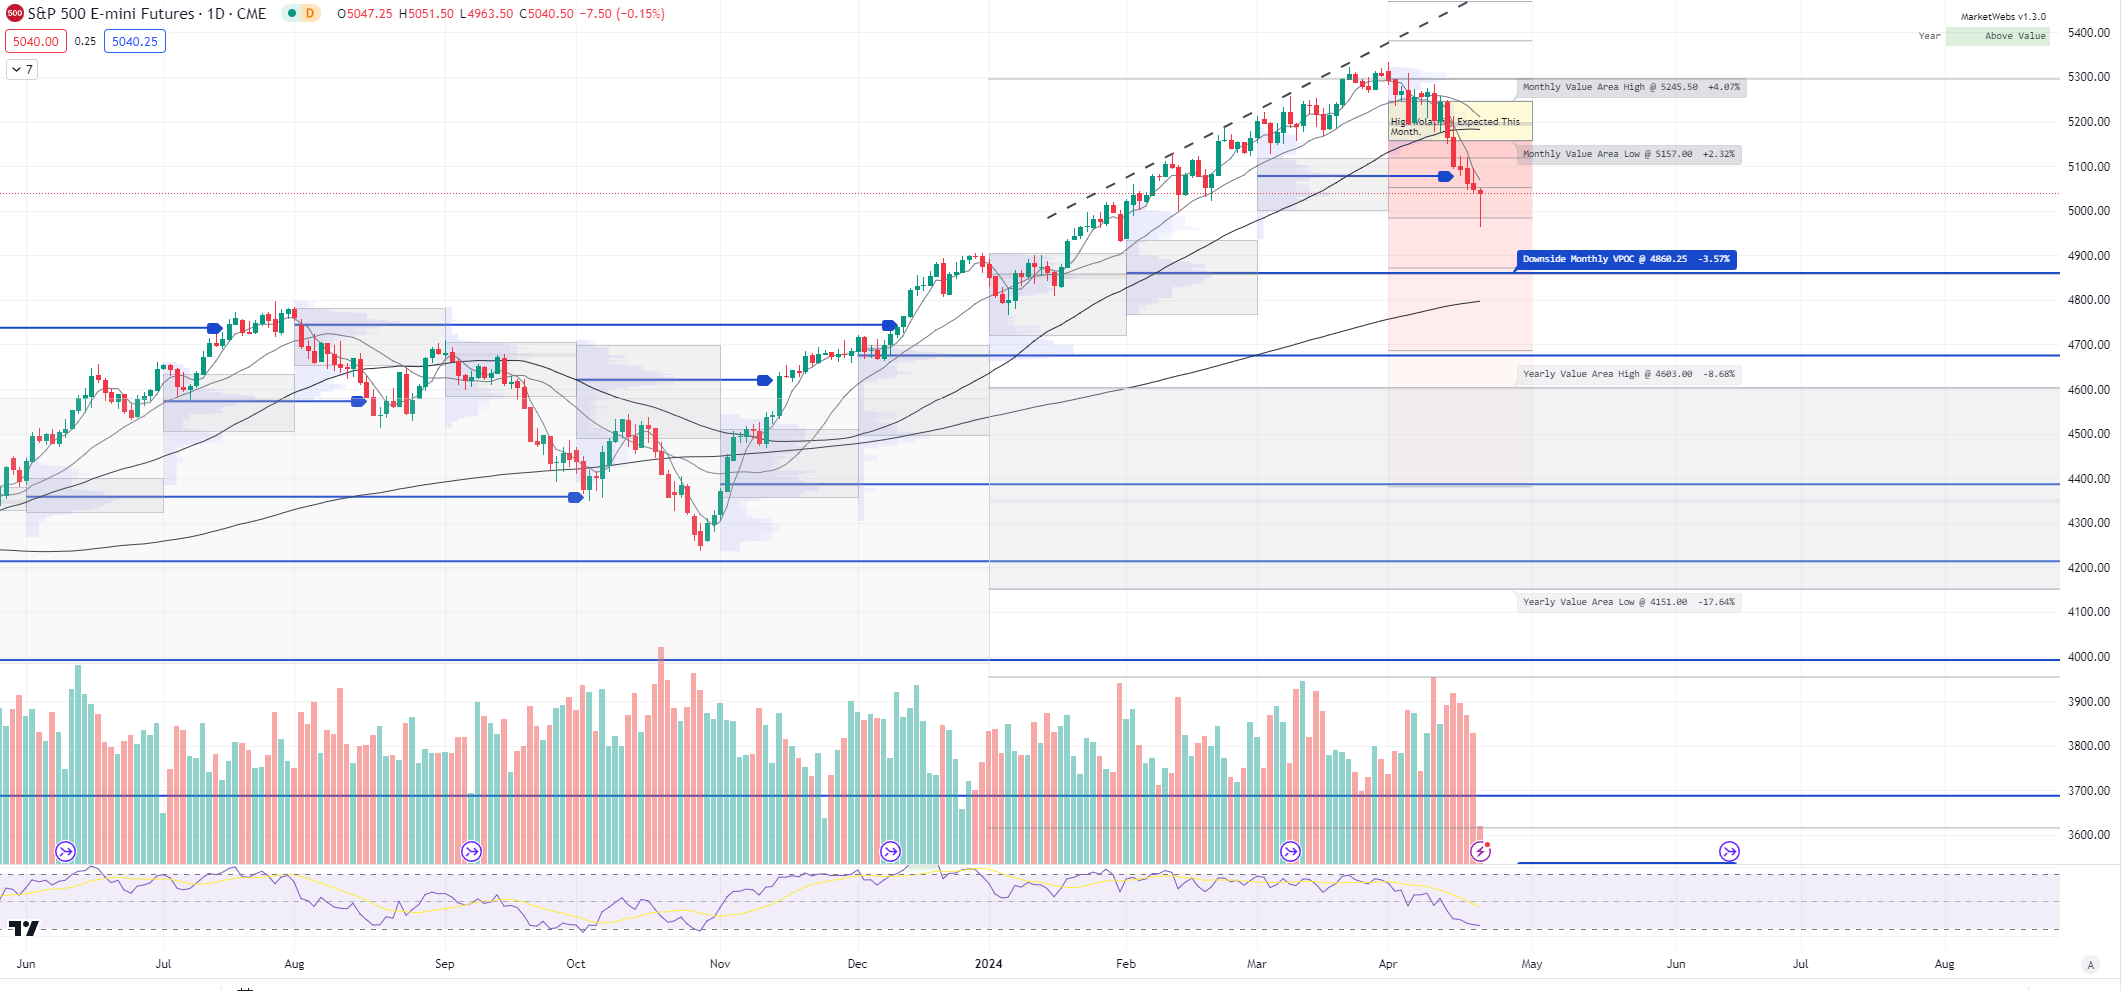
ES_F - SPX Futures - Daily chart: Price almost back to flat this morning , this overnight action may reduce some of the uncertainty around Israel retaliating
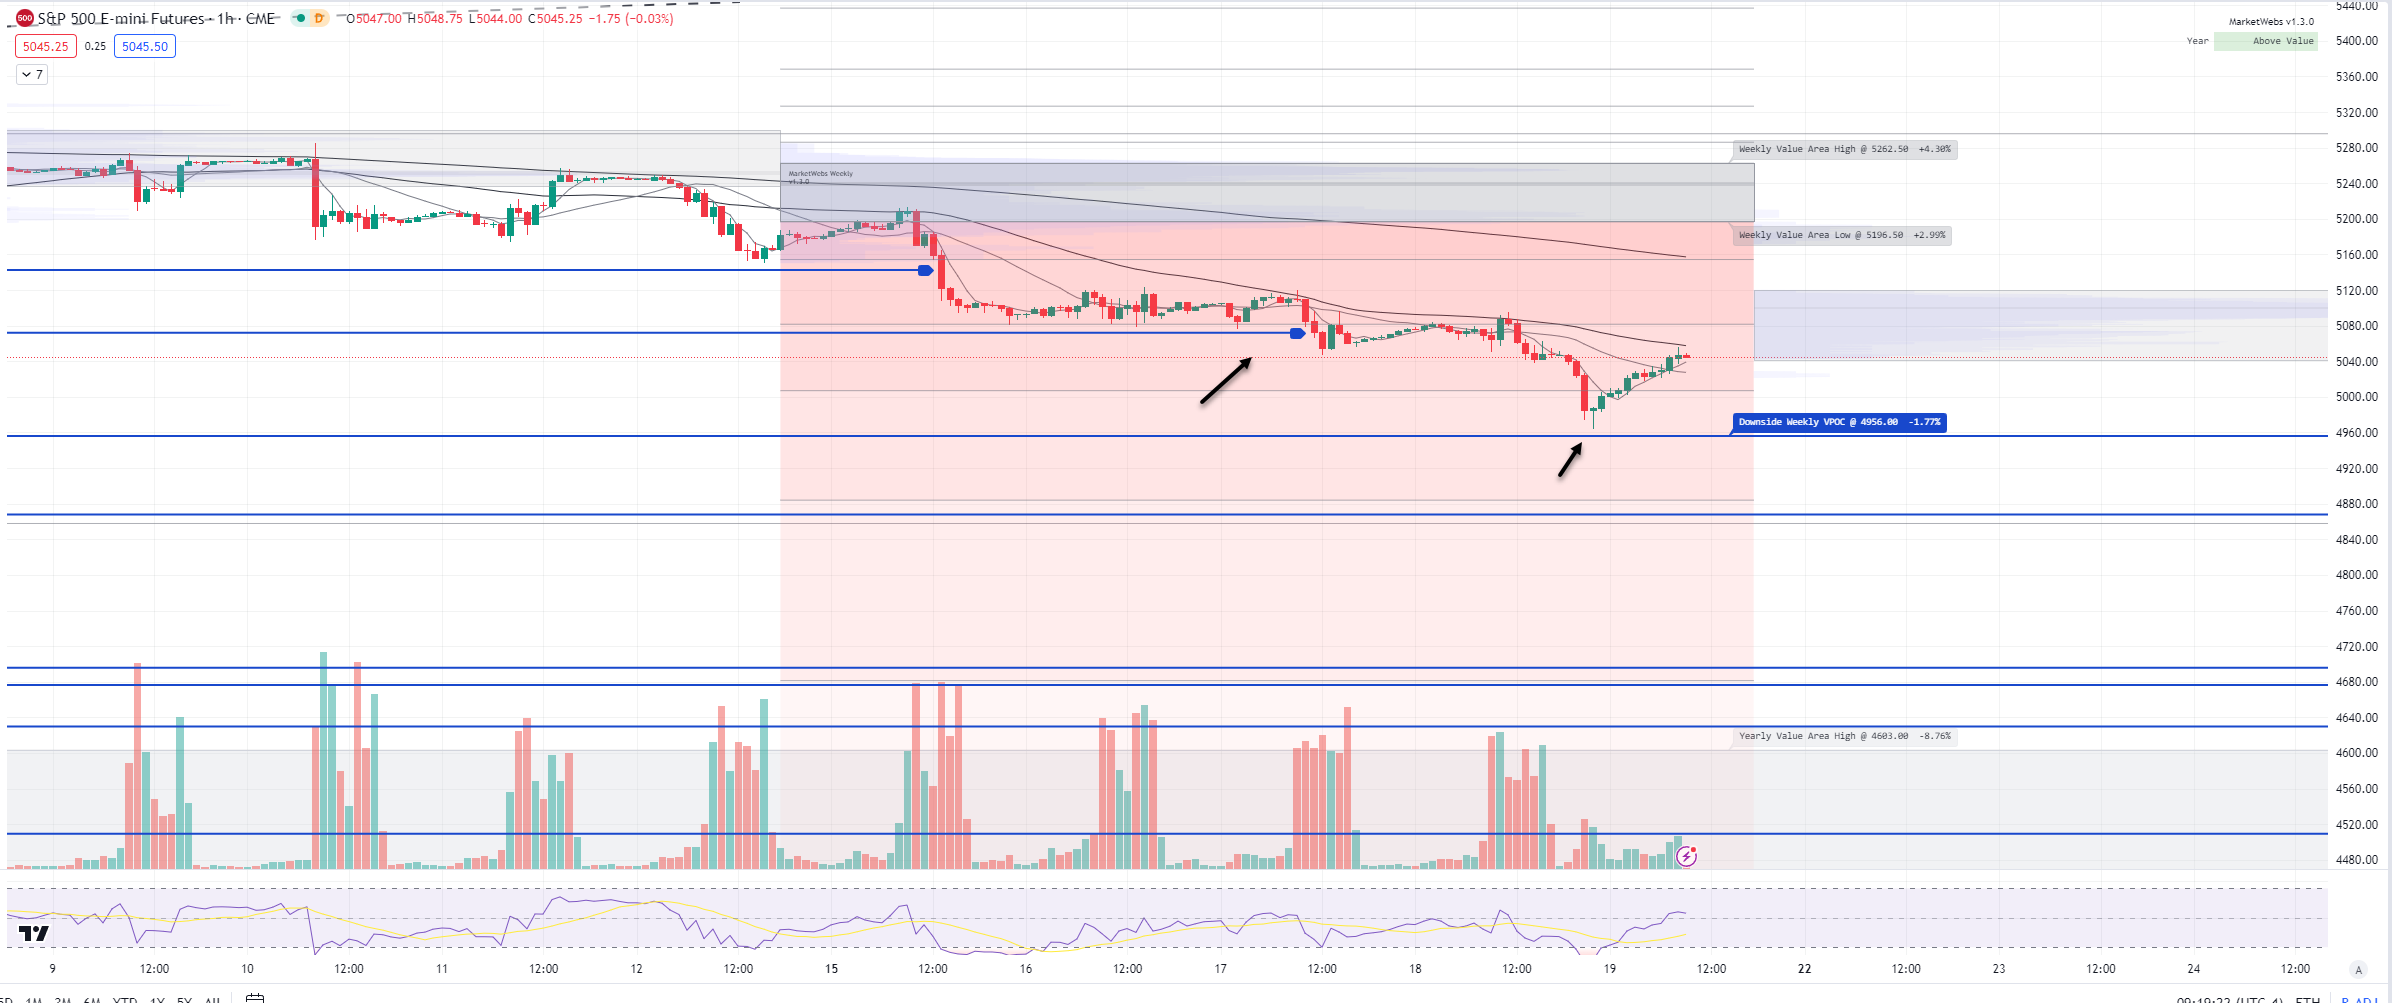
1hr chart: Price almost took out another VPOC , I am watching for a further reversal this morning
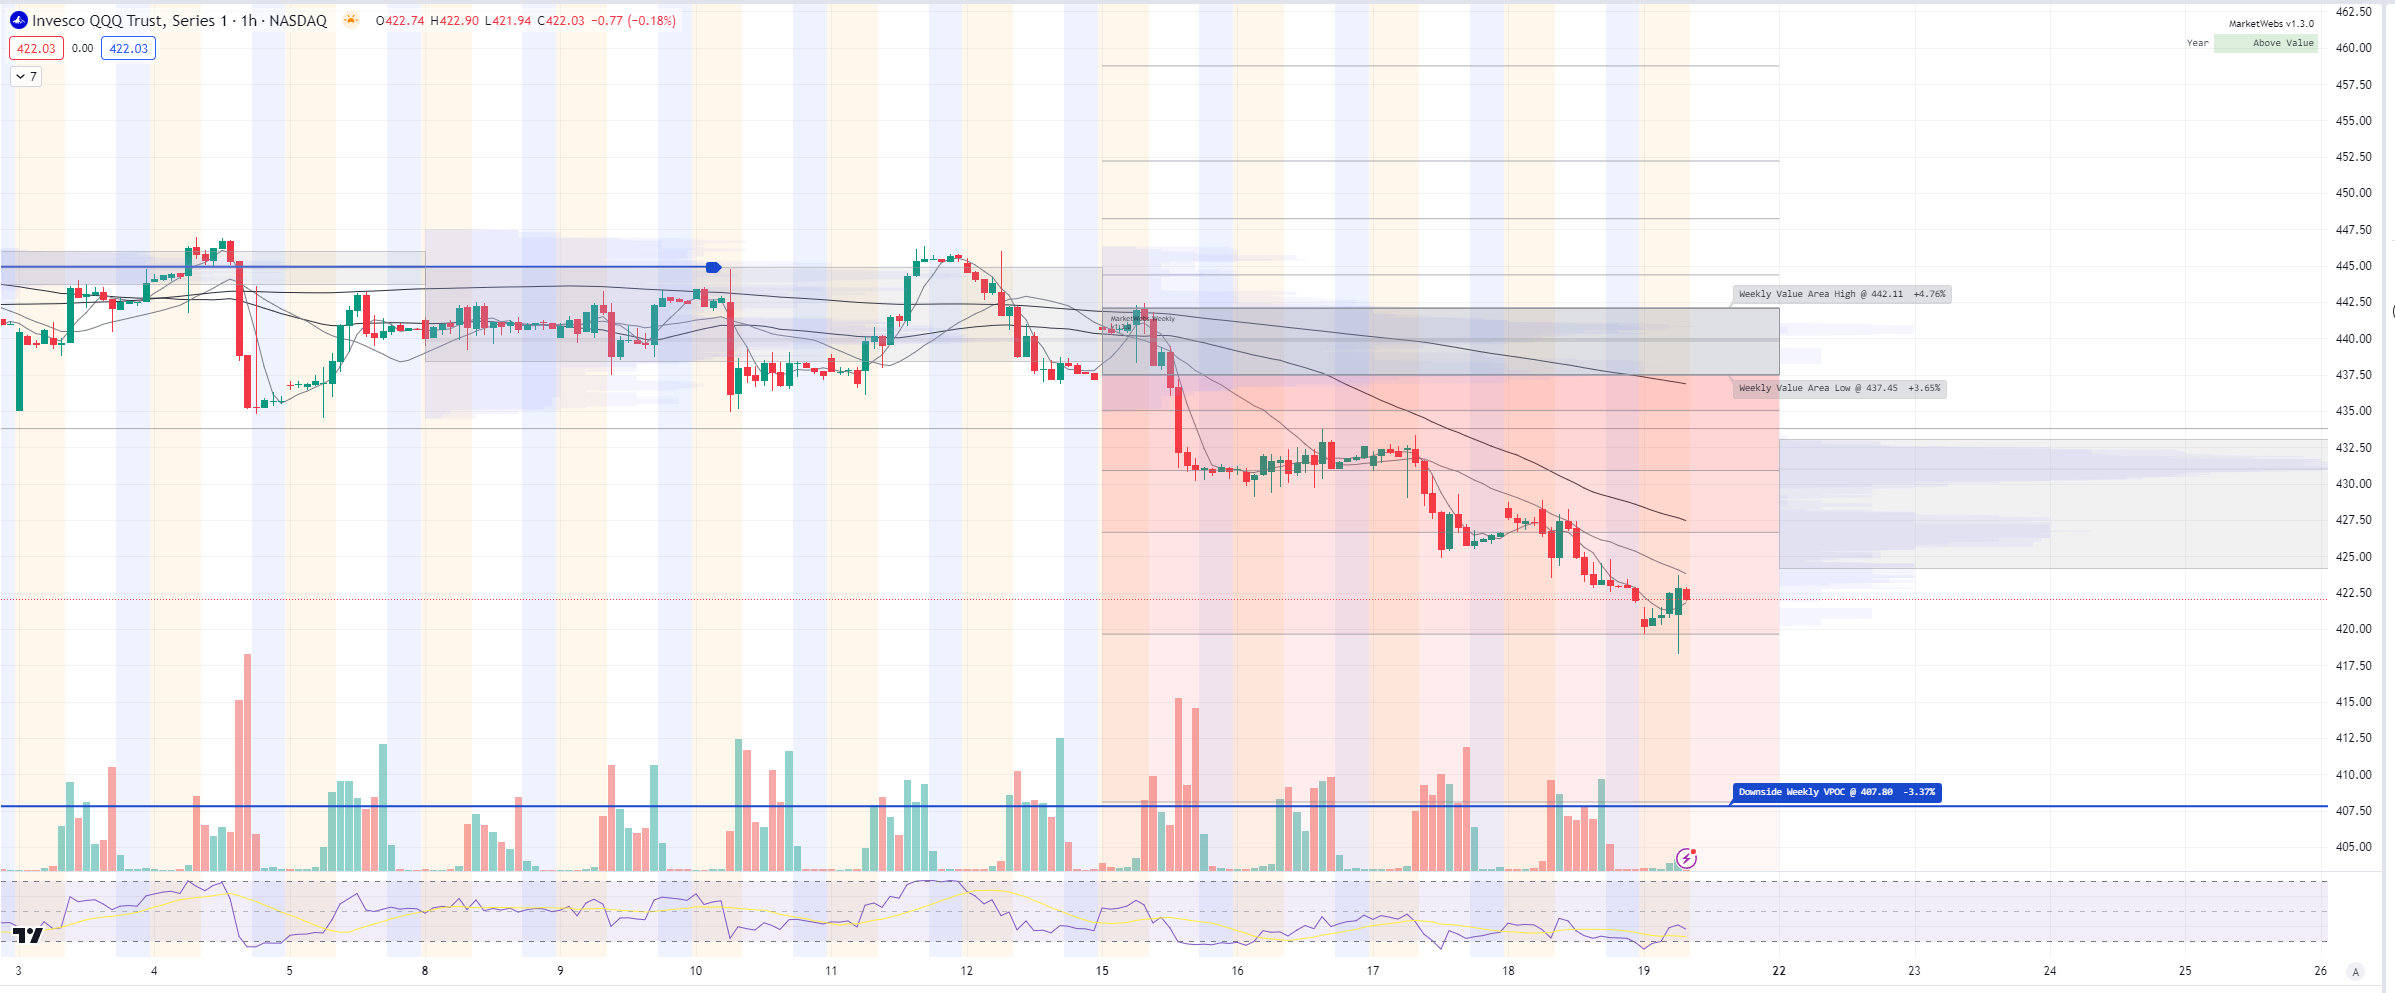
QQQ - NDX 100 ETF - Daily chart: Price ind. -0.3% and remains below all short term MAs , need to see price regain at least that 5d MA for confirmation
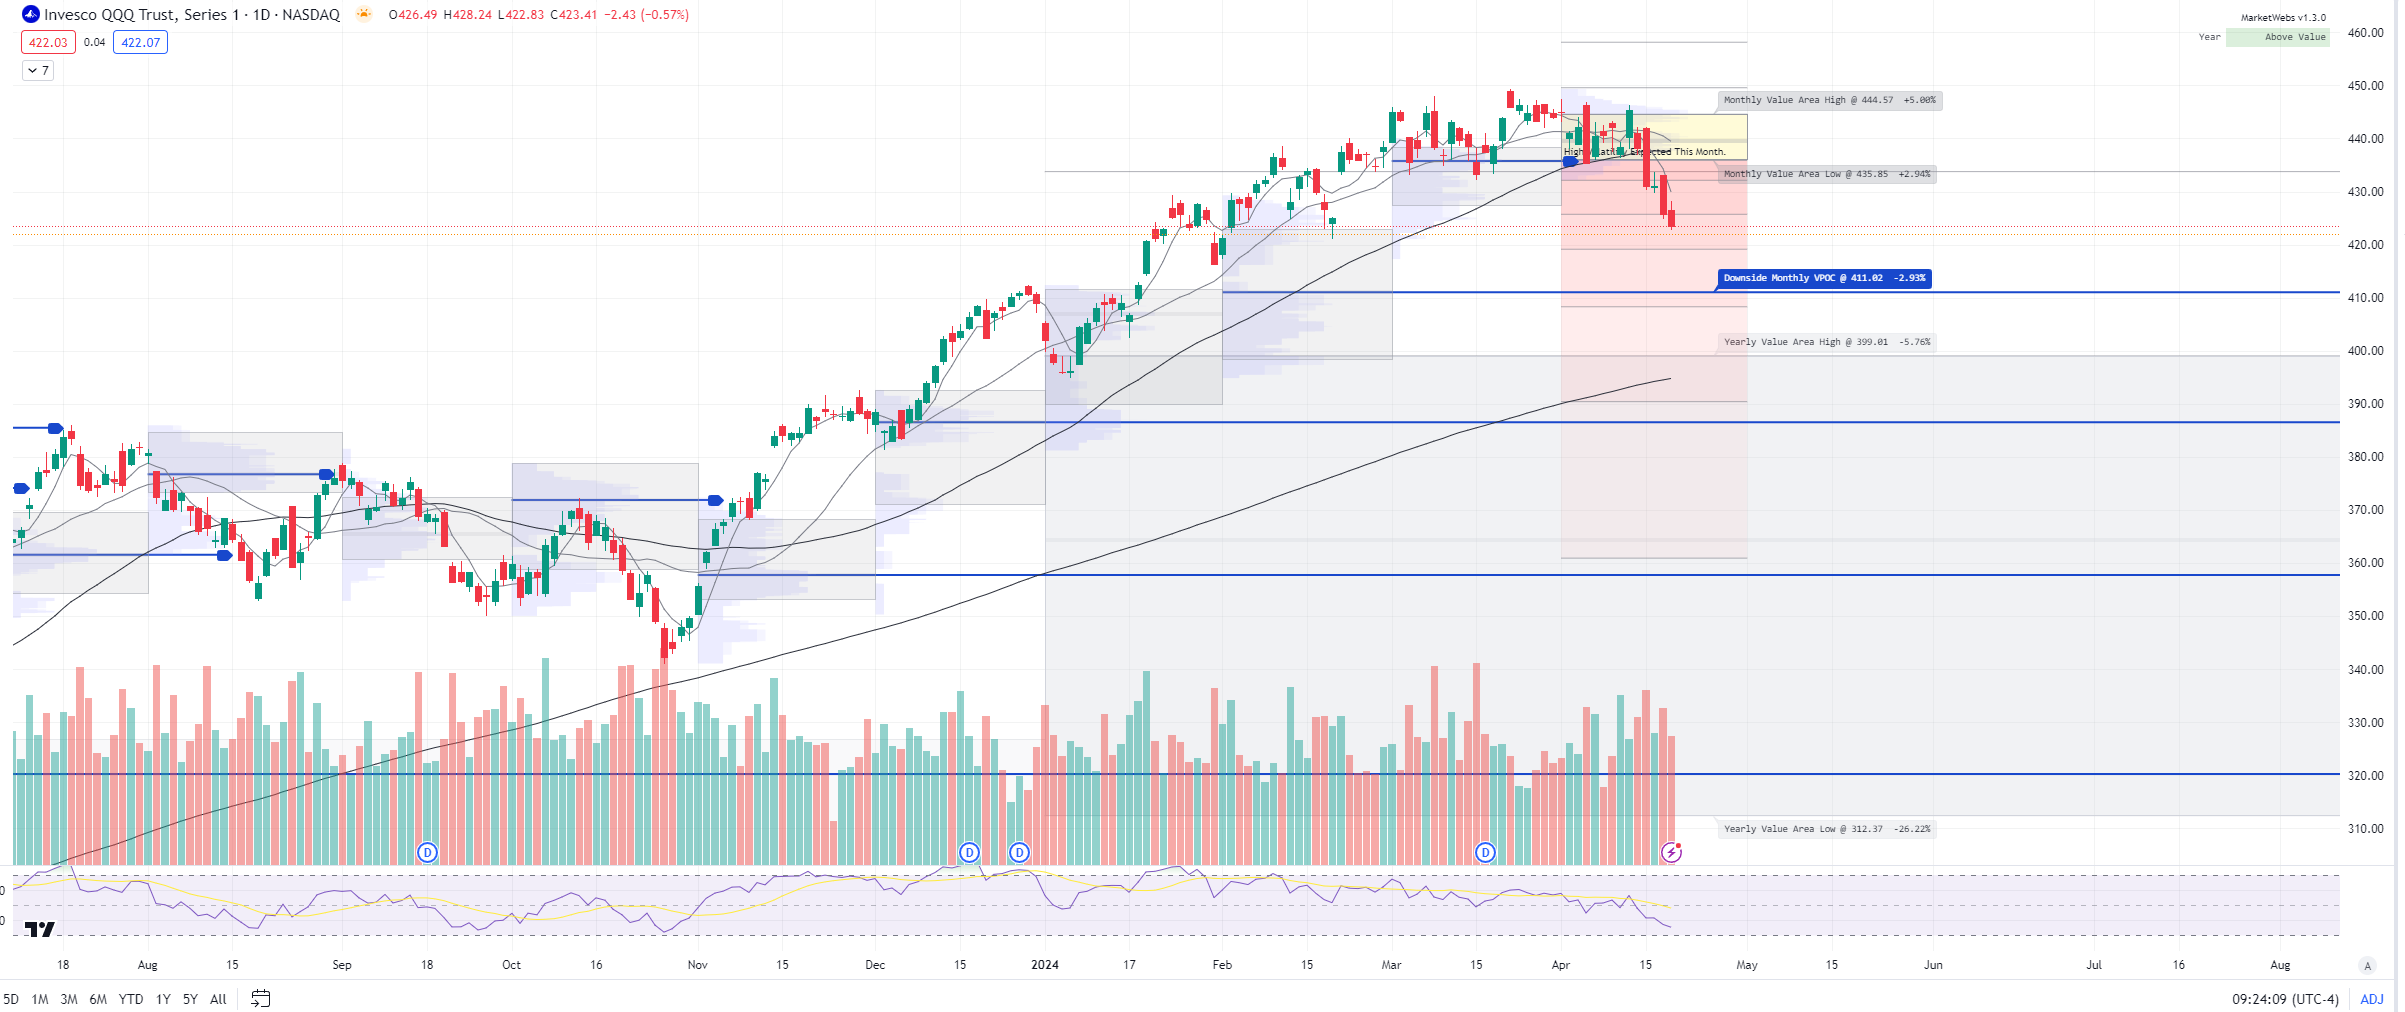
1hr chart: Price continues to trend lower below its Value Area for week
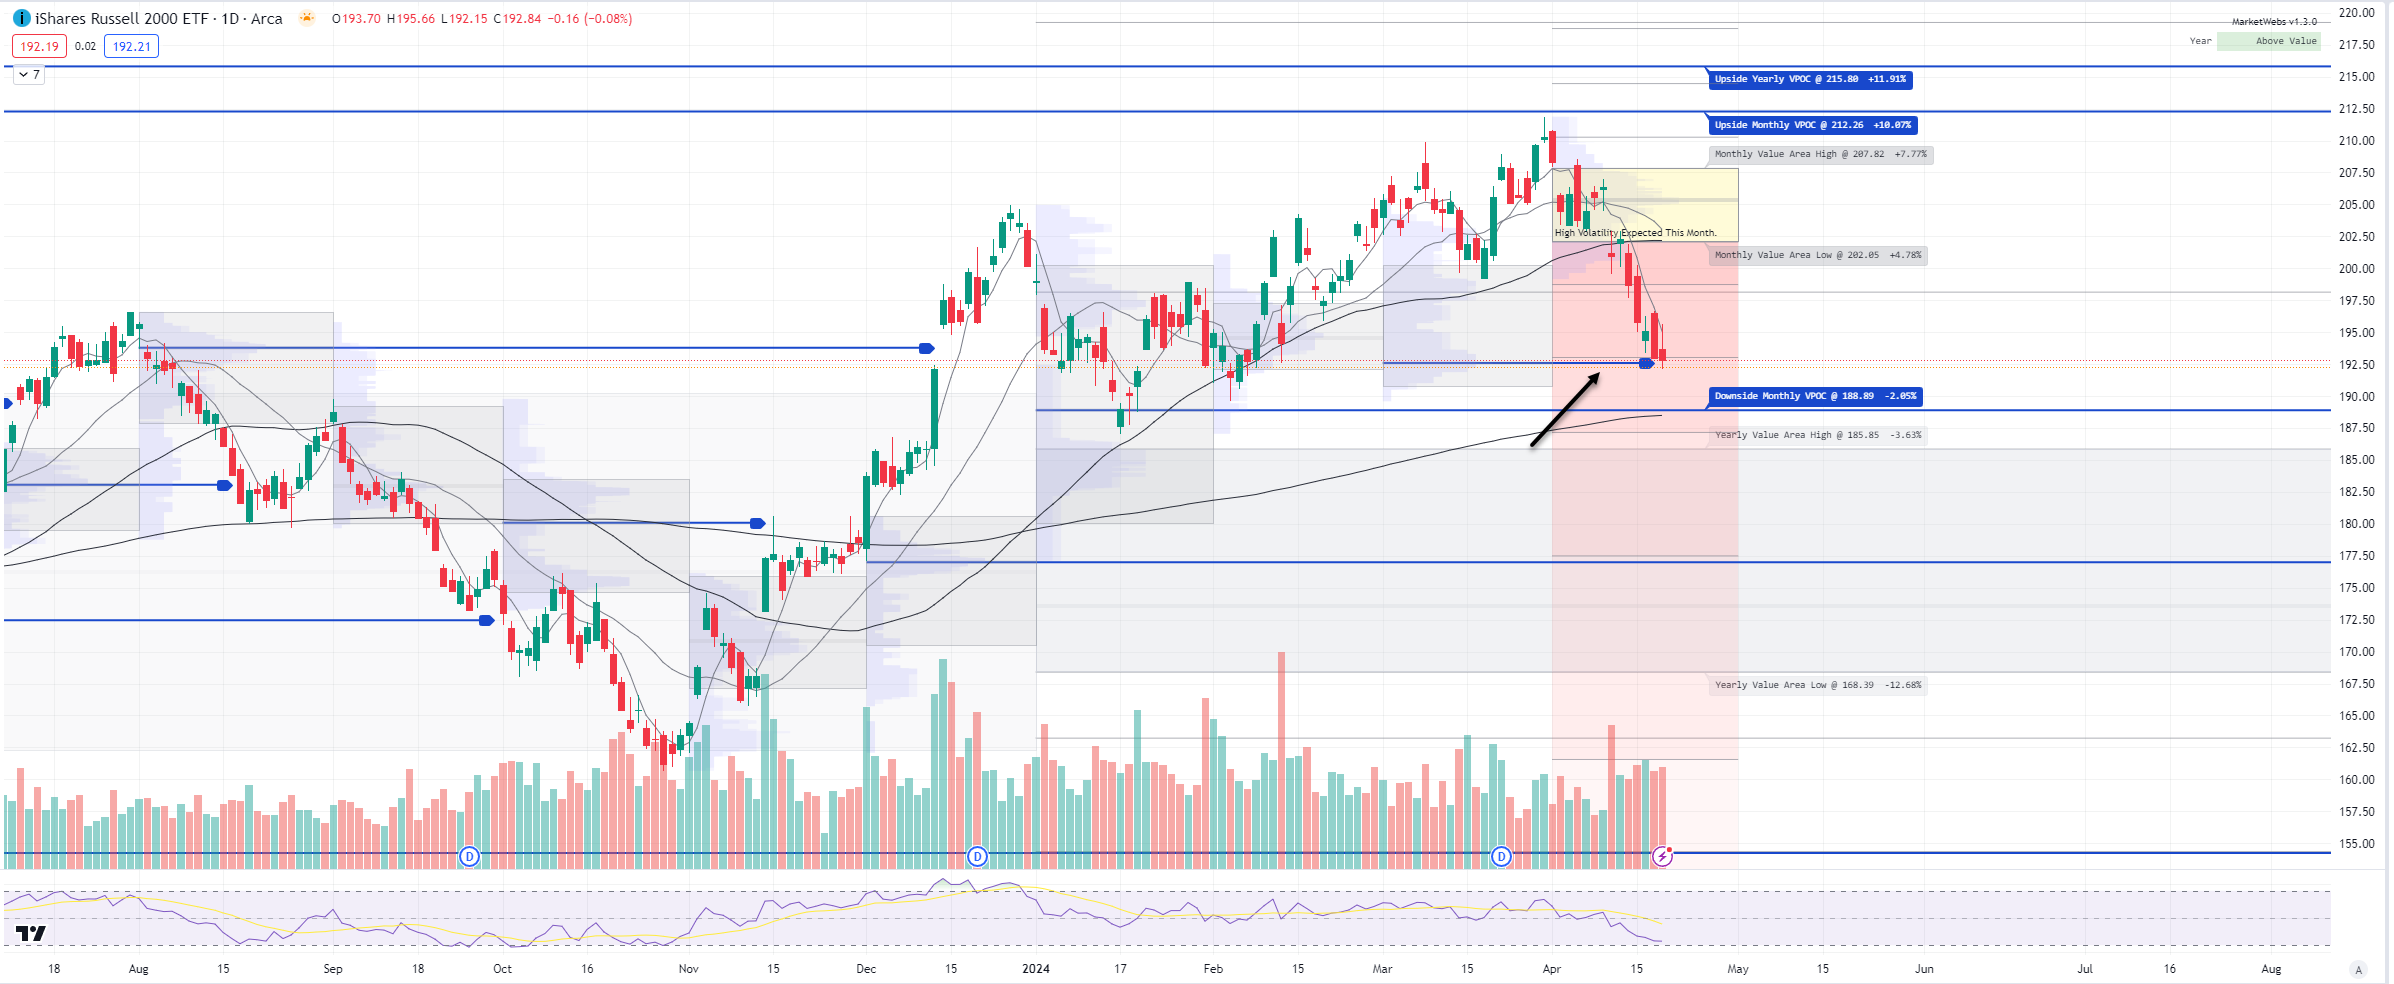
IWM - Russell Small Cap ETF- Price ind. -0.3%, lower VPOC was taken out. Watch for some stabilization here.
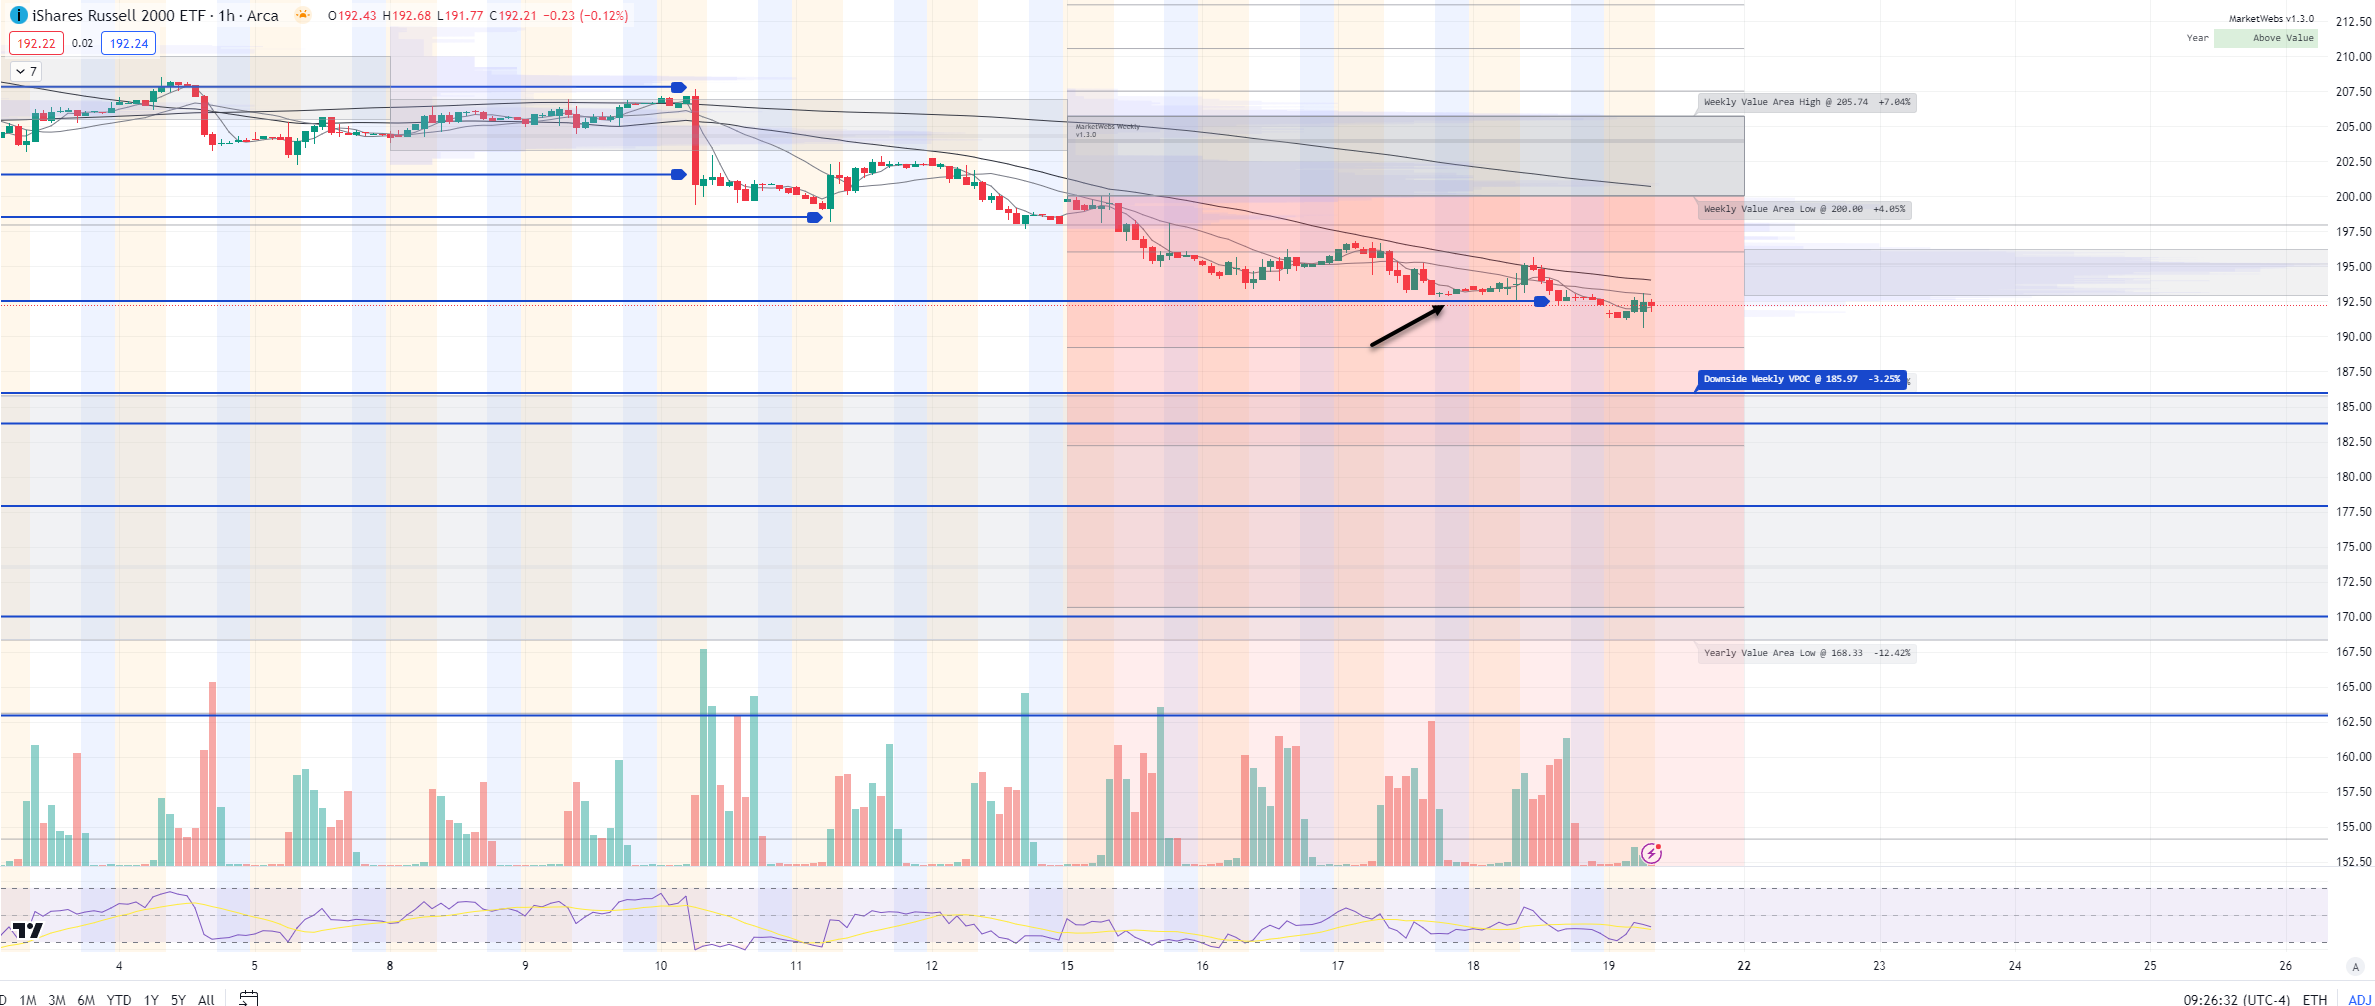
1hr chart: Price took out that VPOC mentioned yesterday. Let’s see if price can stabilize here
Here is today’s TTG Proprietary Stock Screen “Out of the Box” using Volume At Price
names trending above their Value Areas (on 3 multiple timeframes & not super extended)
Keep reading with a 7-day free trial
Subscribe to The Tribeca Trade Group to keep reading this post and get 7 days of free access to the full post archives.