
TTG Index Charts & Out of the Box Stock Screen 3/28/24 $HON
TTG Index Charts & Out of the Box Stock Screen 3/28/24 $HON
Out of the Box MarketWebs Screen
US Dollar +0.2% / 30yr Bonds -0.2% / Crude +1.5% & Nat Gas -0.7% / Gold +1.0% / Copper -0.1% / BTC +2.9%
Wednesday’s Market Recap Video
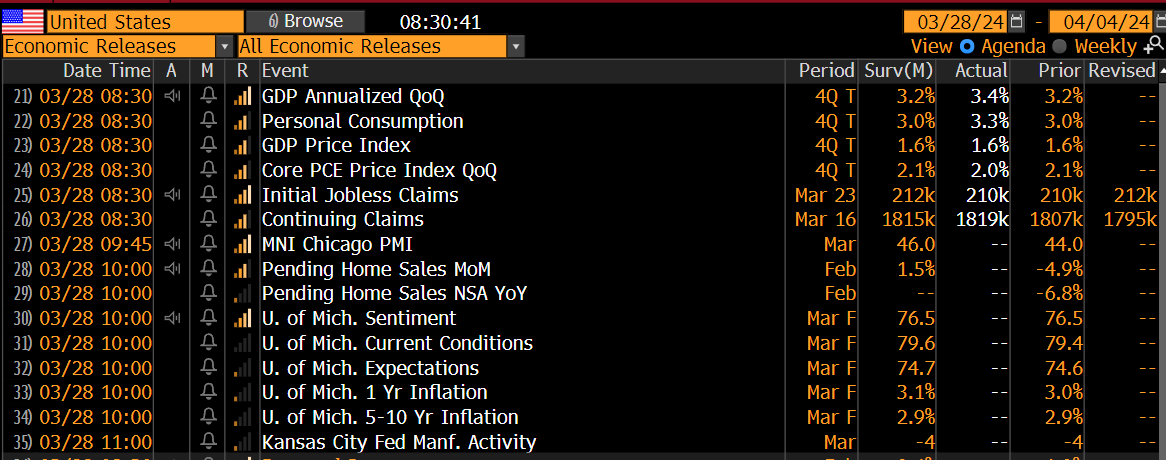
US Upcoming Economics
US Bond Yields

Index Updates
At TTG, I use Volume At Price in my chart analysis and I use the MarketWebs Indicator to provide Value Areas & VPOCs which indicate significant support & resistance levels. Learn More Here about Volume At Price and the MarketWebs.
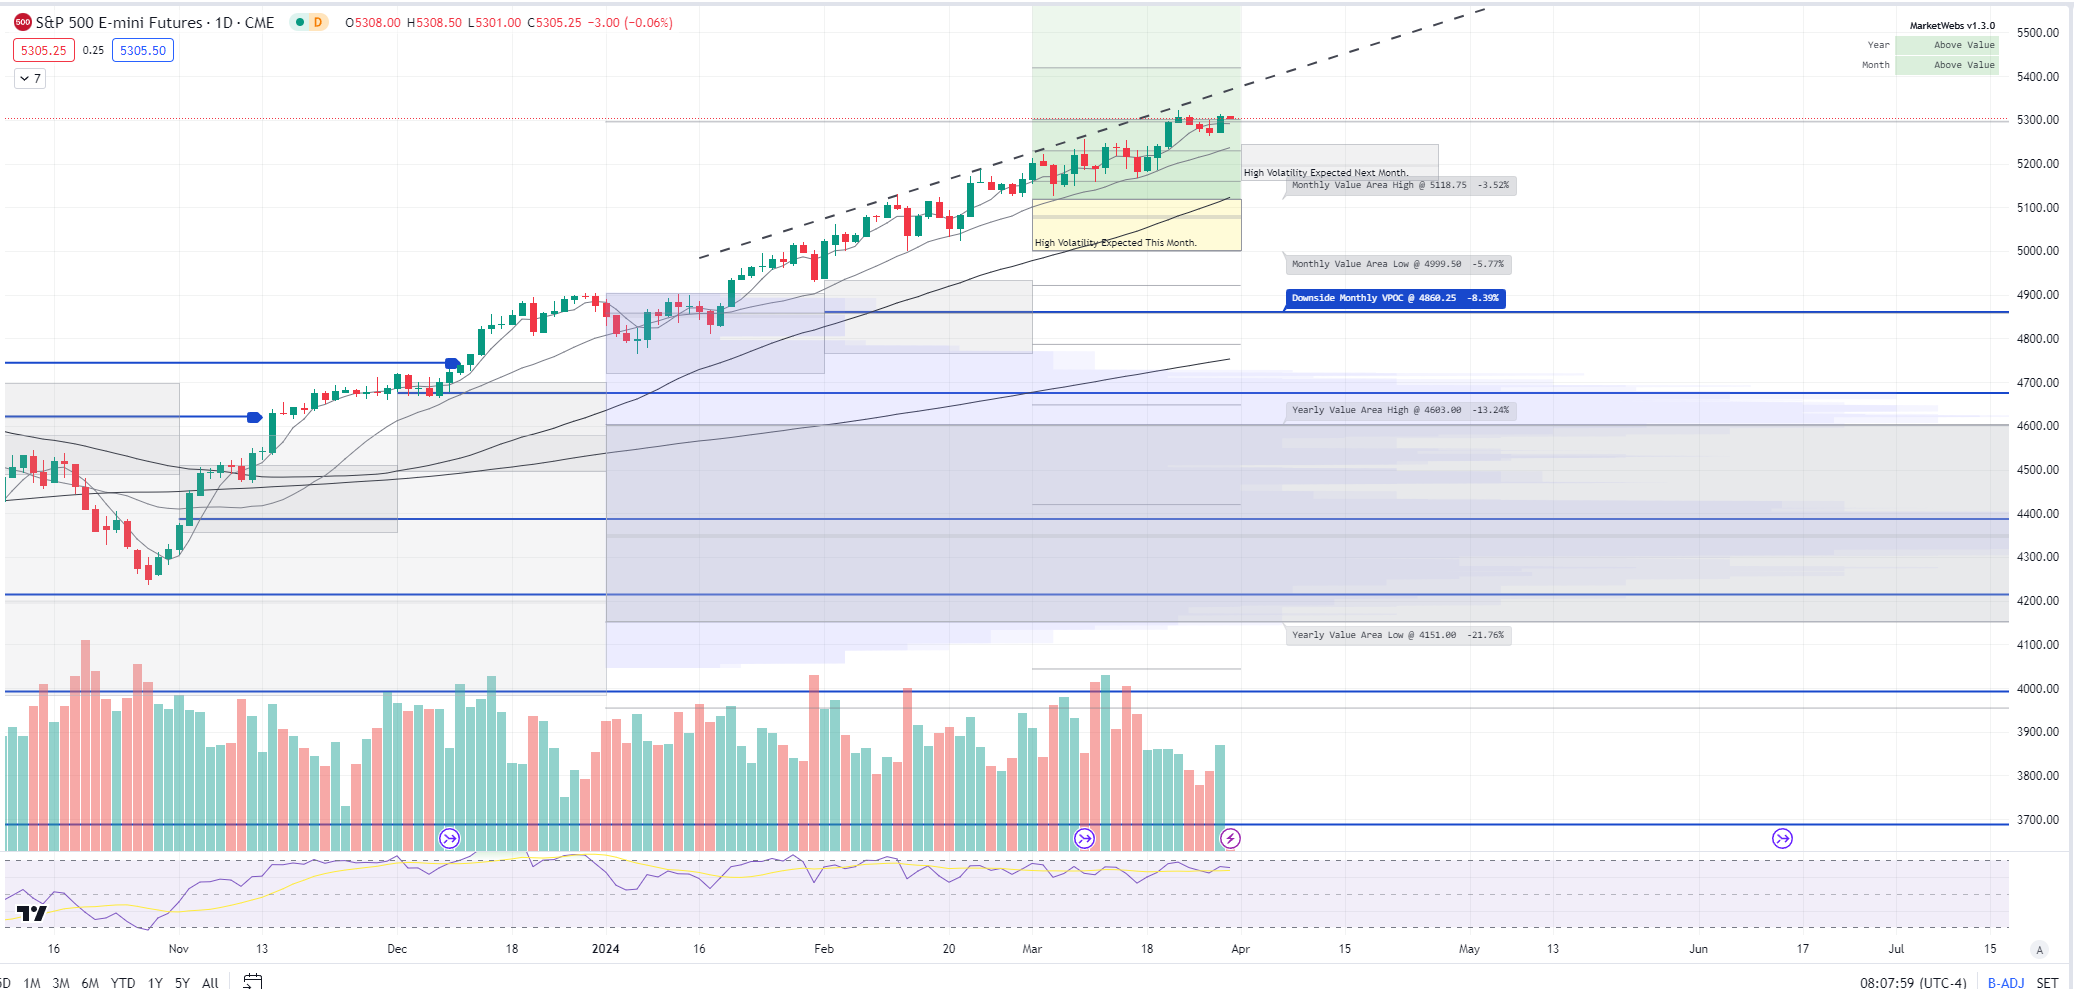
ES_F - SPX Futures - Price ~ flat going into the last trading day of the quarter and not much new to talk abut here - price continues to trade inside the uptrend channel
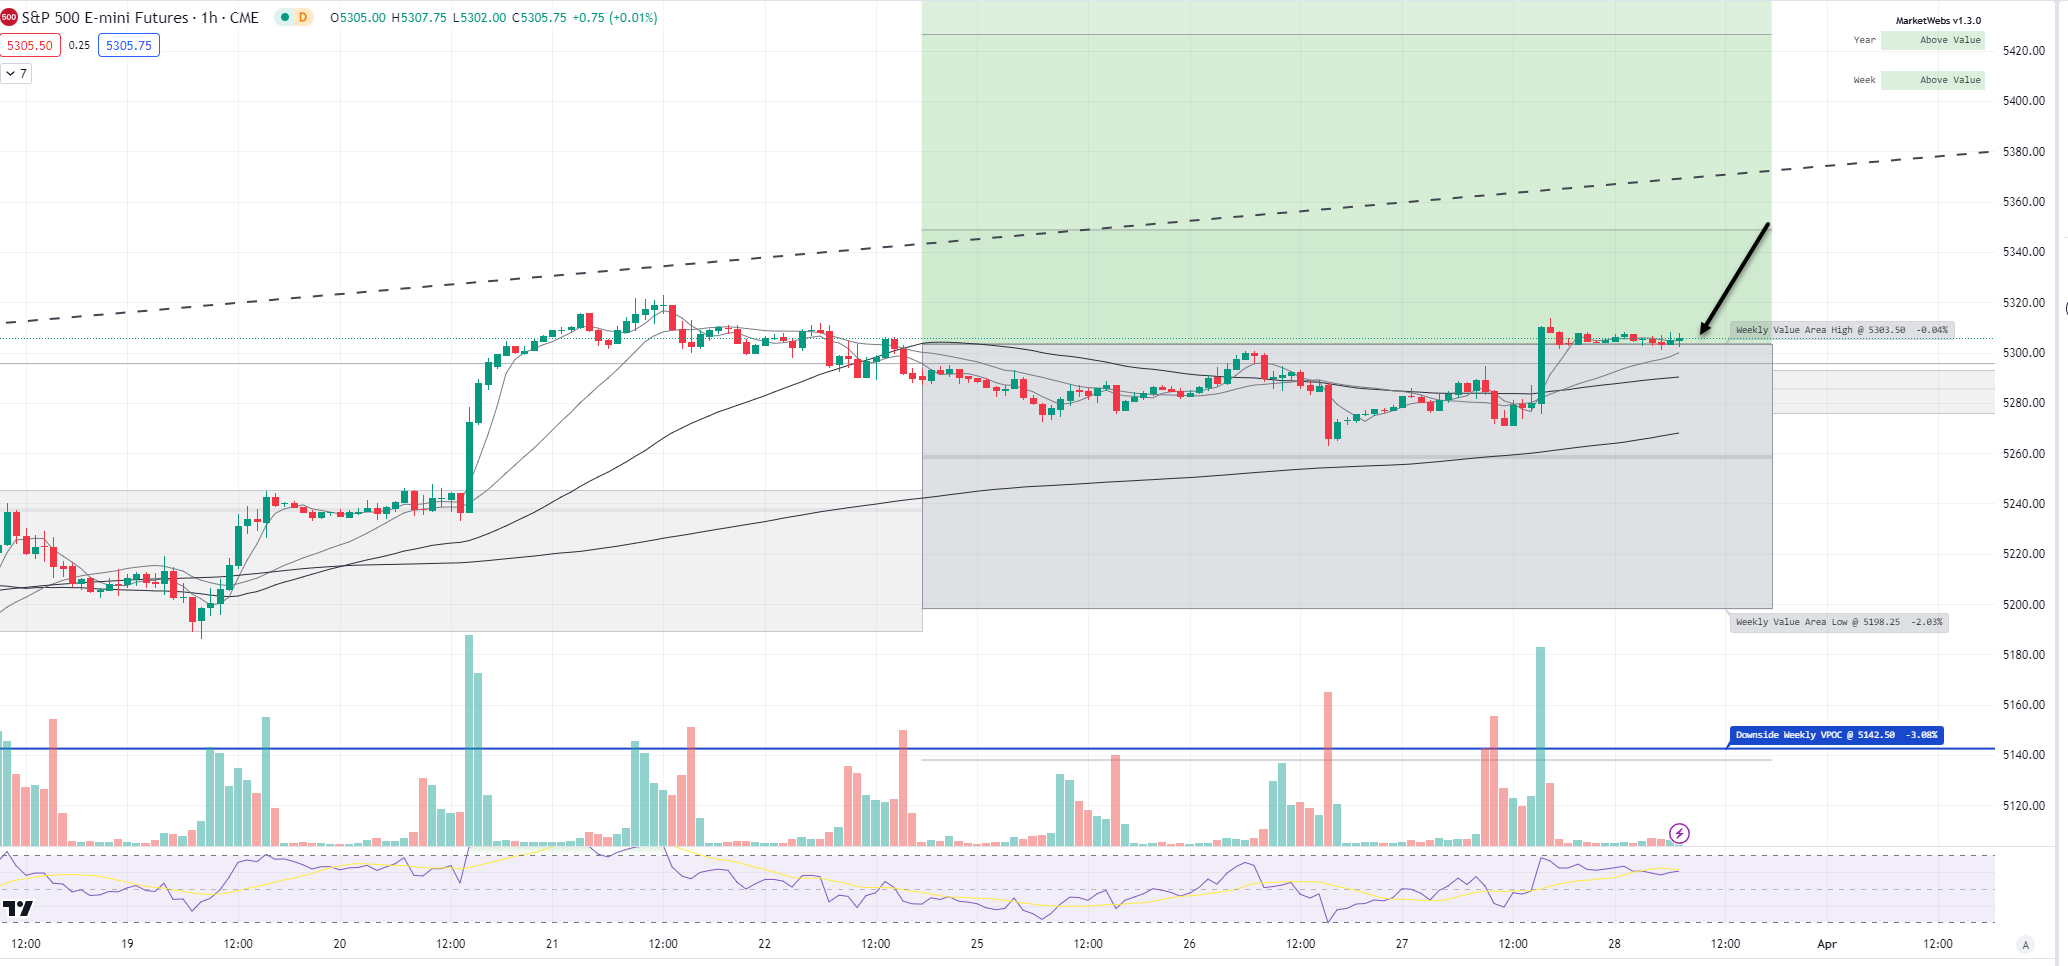
1hr chart: Check out that consolidation at the top of this week's Value Area. At the end of the day yesterday, price rallied right up to the top of value and is just pausing , watch 5303.5 resistance
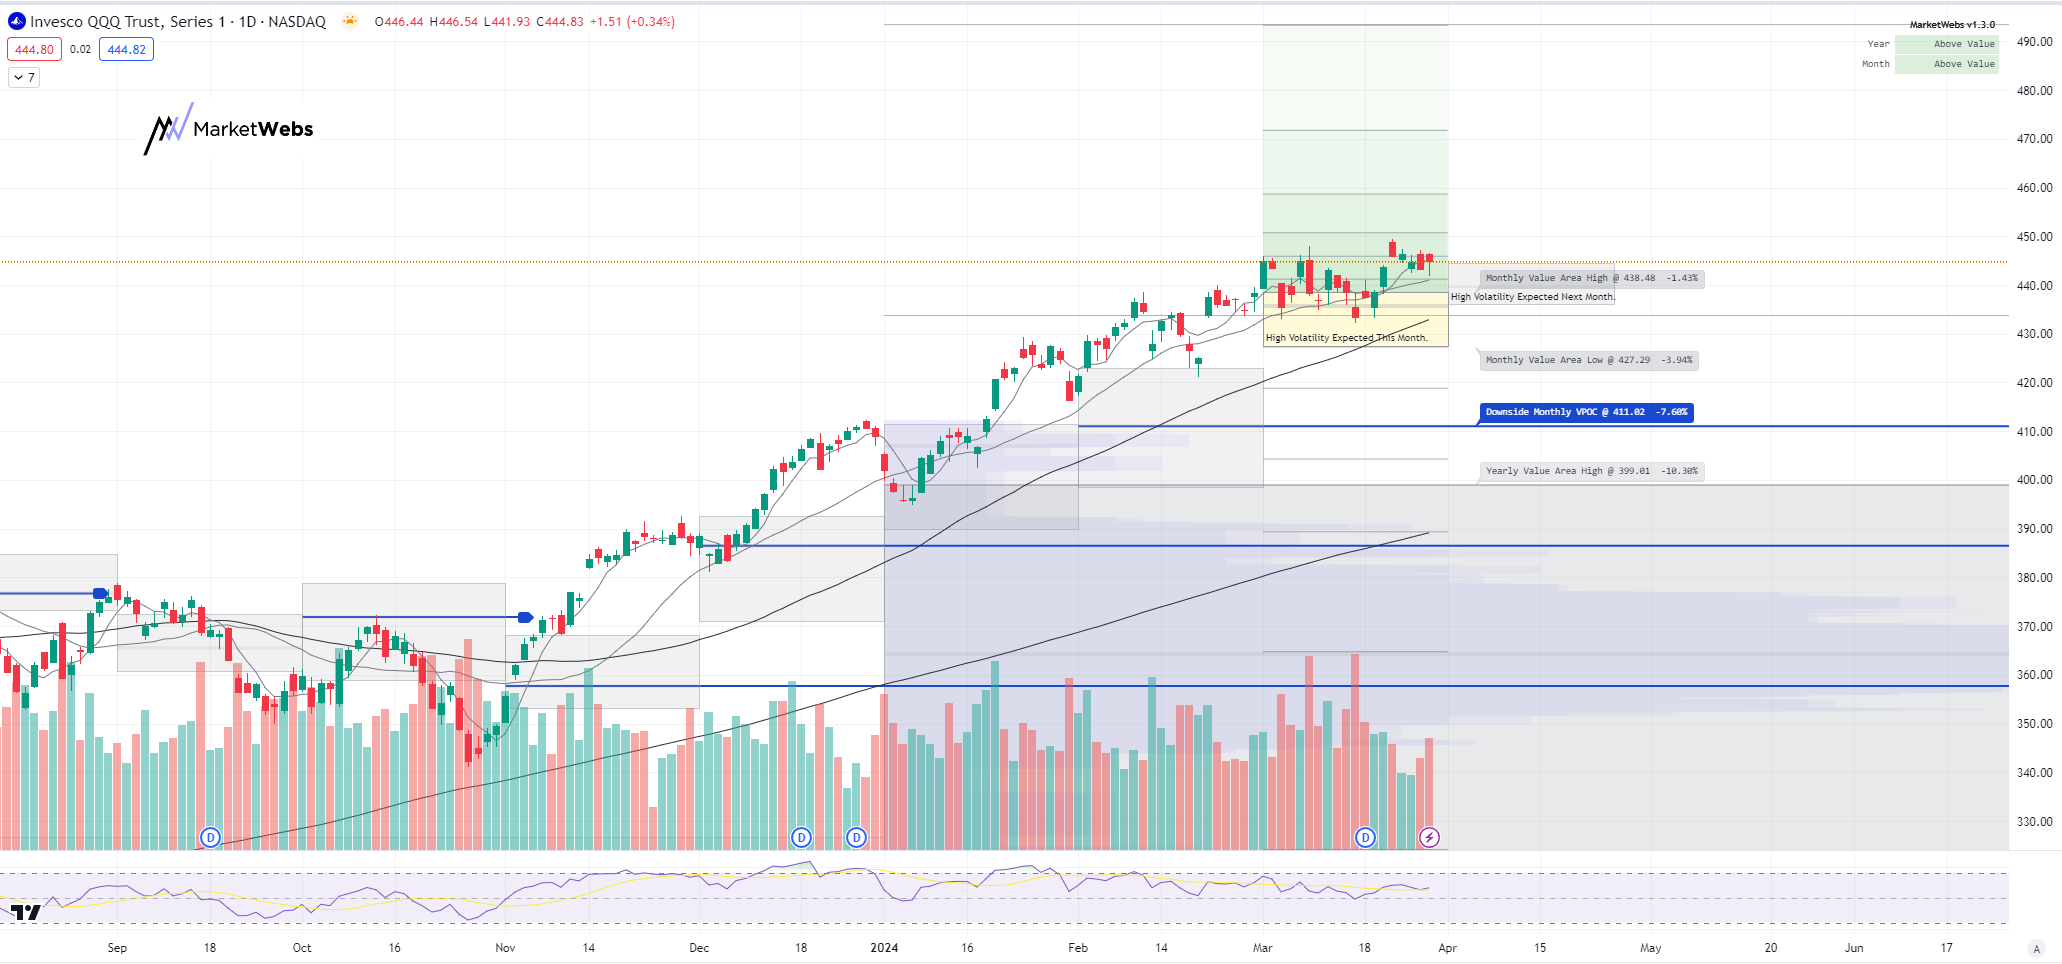
QQQ - NDX 100 ETF - Daily chart: Price also ind. ~ flat this morning and no major technical change here with price still above its Mar Value Area
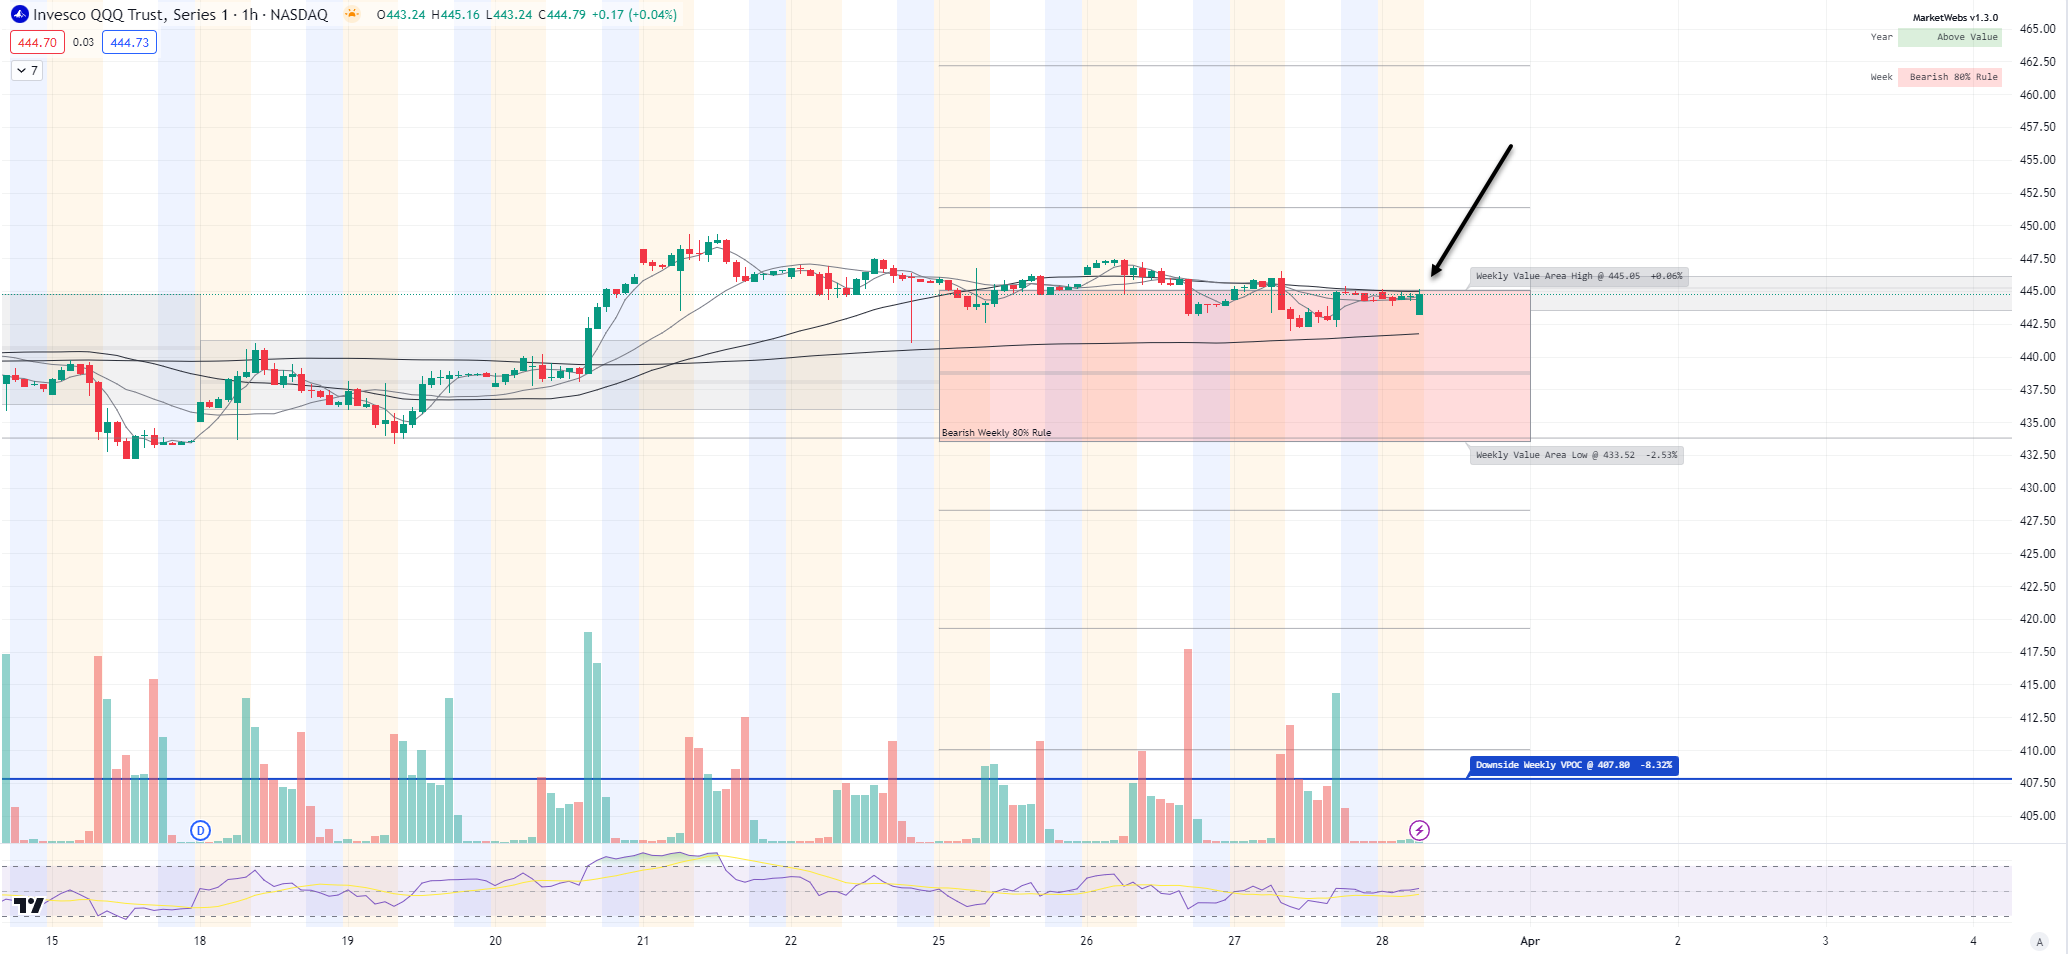
1hr chart: Price remains inside its Value Area for the week, resistance remains $445.05
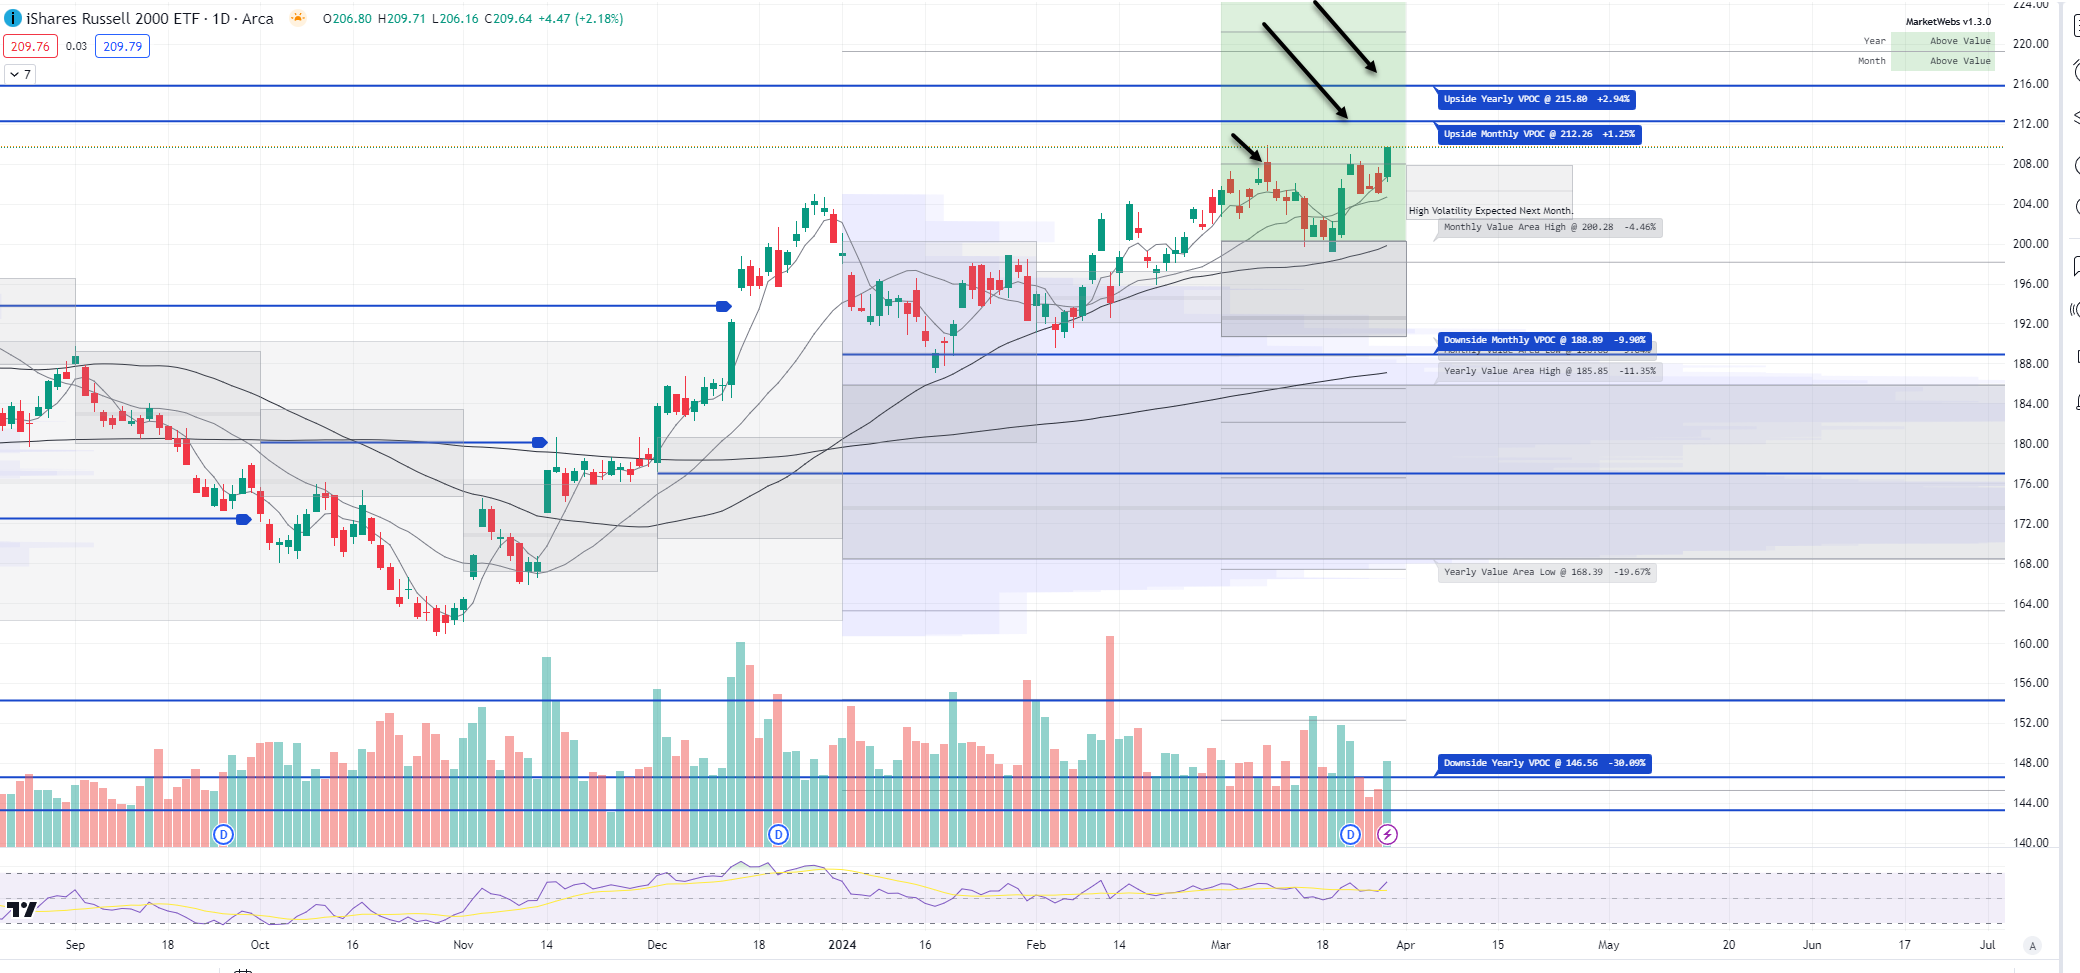
IWM - Russell Small Cap ETF- Price also flattish this morning after a huge move yesterday +2.2%. Part of the move was related to interest rates and also partly due to quarter end rebalancing - so what do we want to watch going forward? Want to see price stay above those 3/8 highs and upside VPOCs (blue lines)
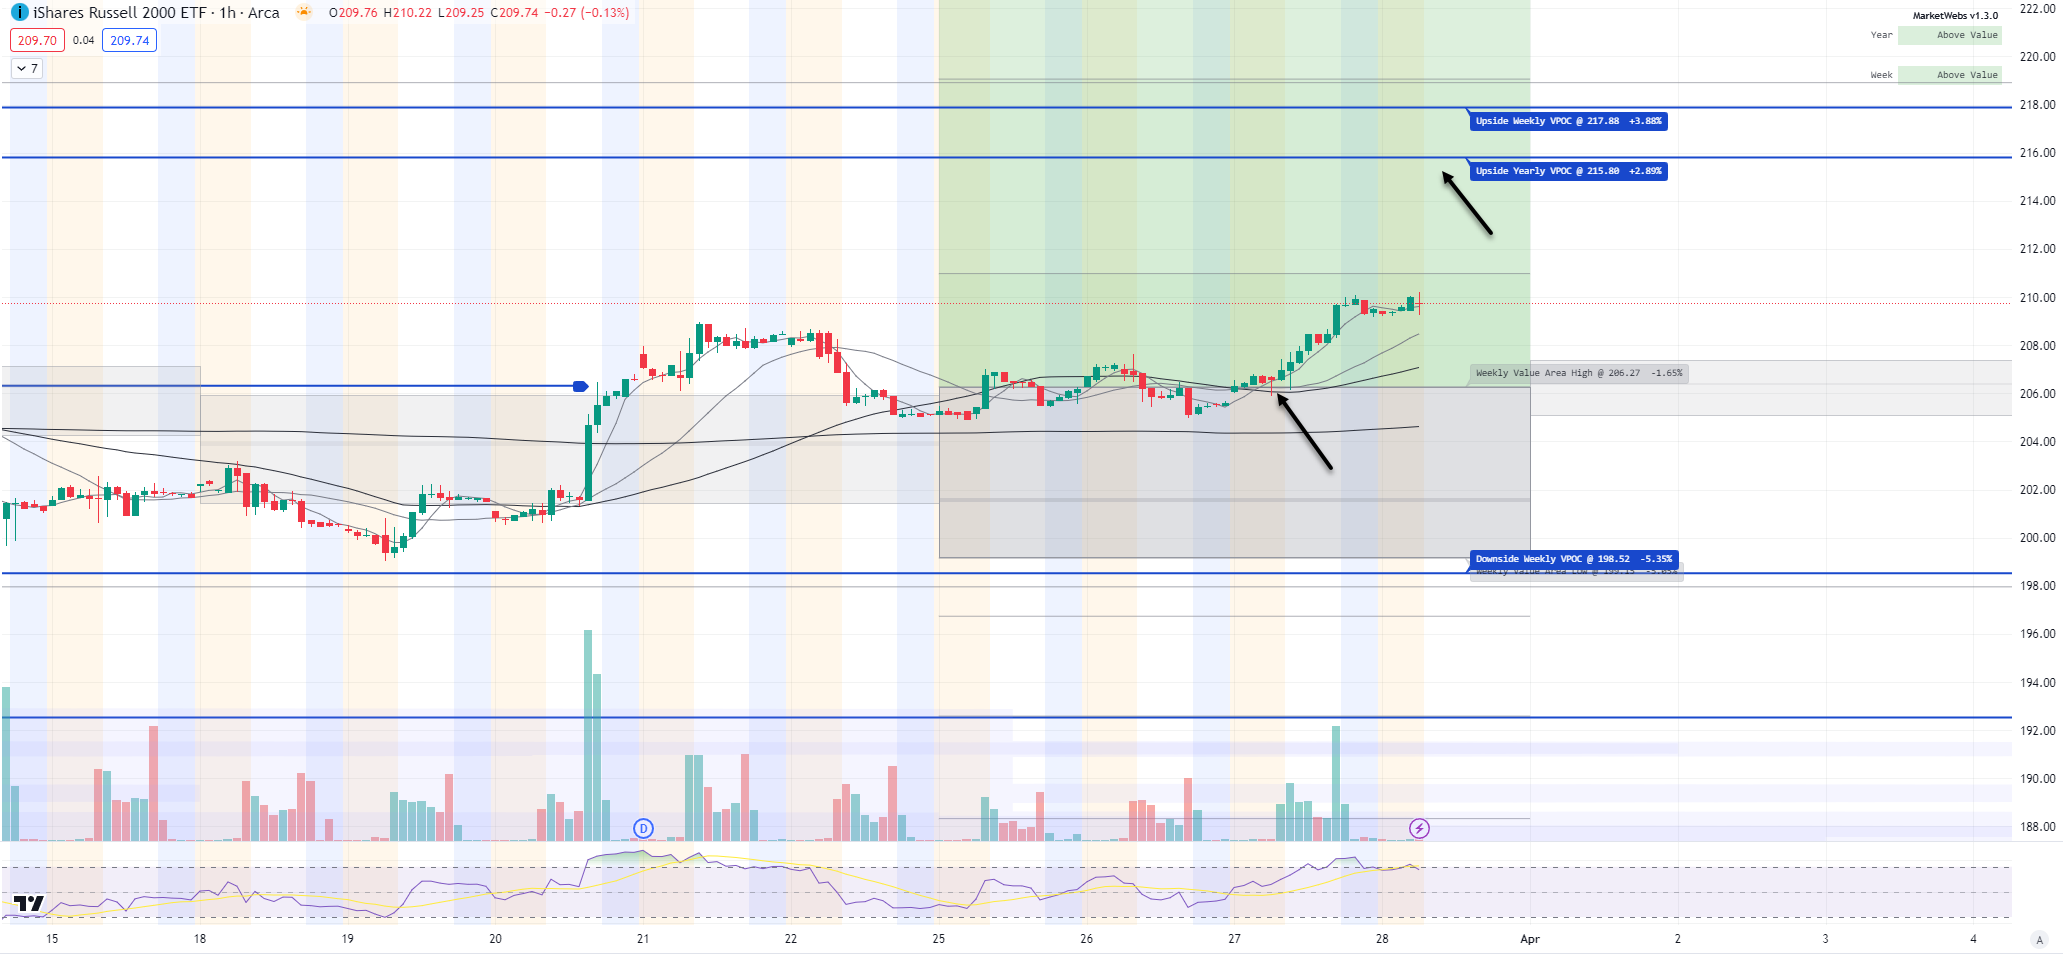
1hr chart: Price above this week's Value Area and outperforming this week
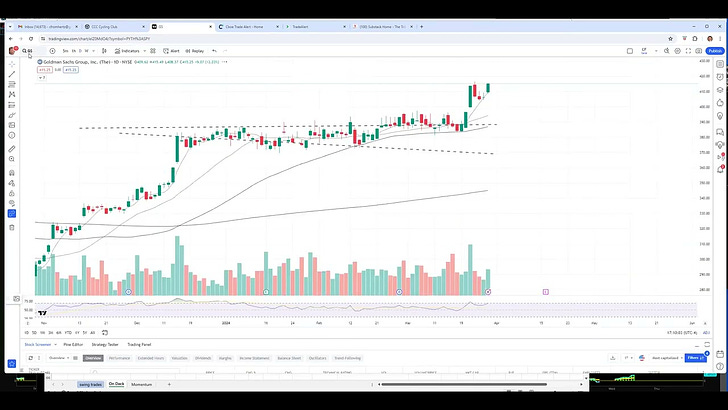
Here is today’s TTG Proprietary Stock Screen “Out of the Box” using Volume At Price
names trending above their Value Areas (on 3 multiple timeframes & not super extended)
Keep reading with a 7-day free trial
Subscribe to The Tribeca Trade Group to keep reading this post and get 7 days of free access to the full post archives.