

TTG Index Charts & Out of the Box Stock Screen 2/27/24 $CPRT
TTG Index Charts & Out of the Box Stock Screen 2/27/24 $CPRT
Out of the Box MarketWebs Screen
US Dollar -0.1% / 30yr Bonds +0.4% / Crude -0.1% & Nat Gas -1% / Gold +0.3% / Copper +0.4% / BTC +4.5%
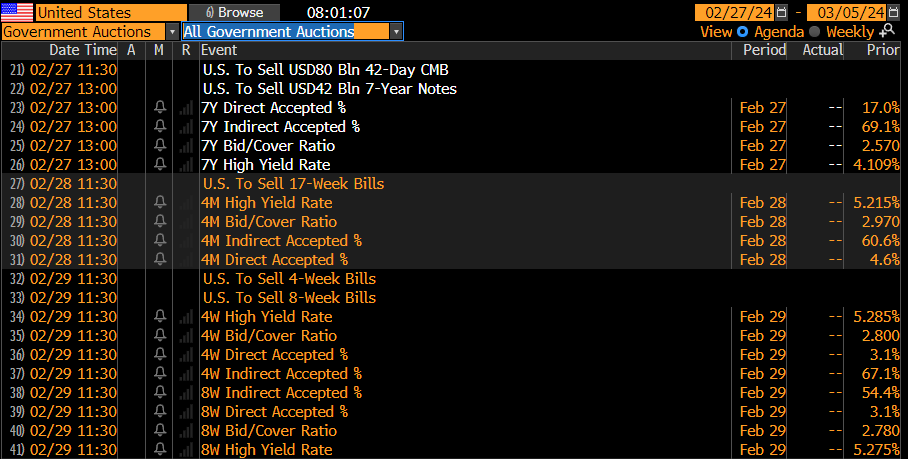
US Upcoming Economics

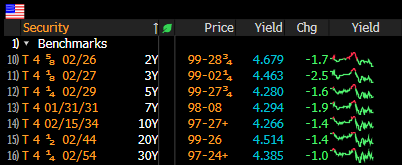
US Bond Yields & Bond Auctions
Index Updates
At TTG, I use Volume At Price in my chart analysis and I use the MarketWebs Indicator to provide Value Areas & VPOCs which indicate significant support & resistance levels. Learn More Here about Volume At Price and the MarketWebs.
ES_F - SPX Futures - Price ind. +0.1% this morning and we have two themes from yesterday continuing - BTC Bitcoin +4% and XBI +2.4% on the back of drug results from VKTX and JANX. Price in S&P remains above all short term MAs (Moving Averages) /
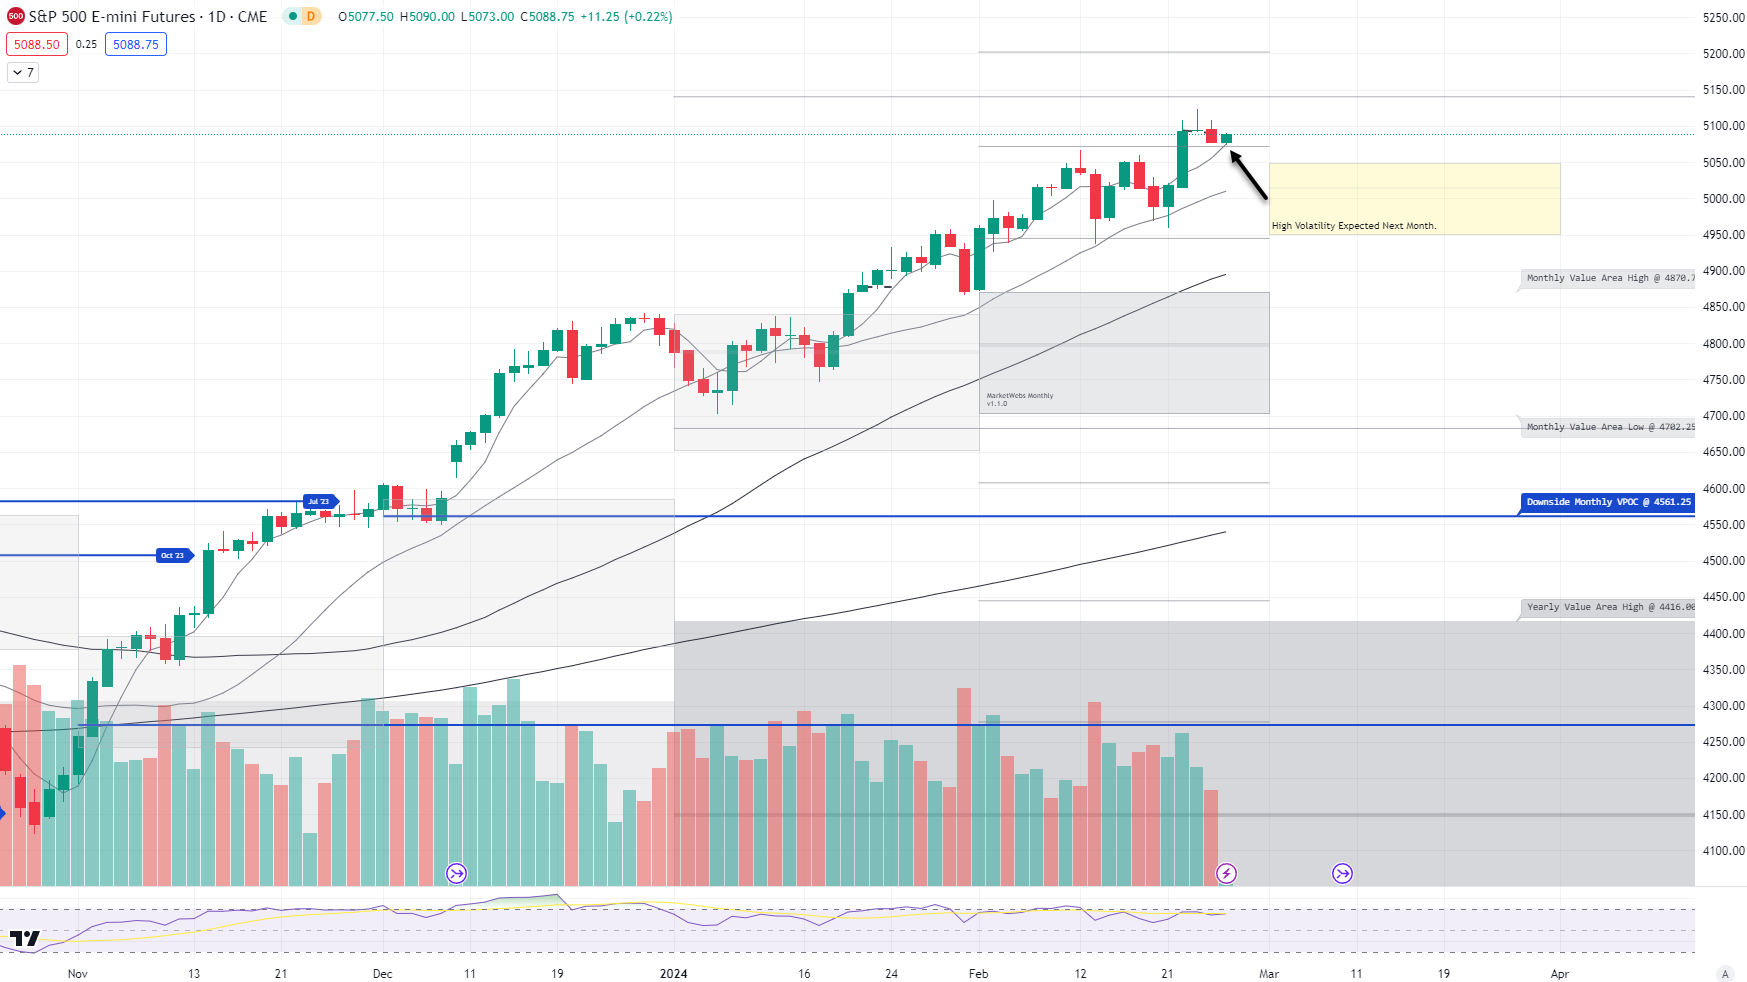
1hr chart: Price started to break the neckline of a possible short term head and shoulders and moved towards top of this week's Value Area support and is getting a bounce premkt. Support is 5066.25

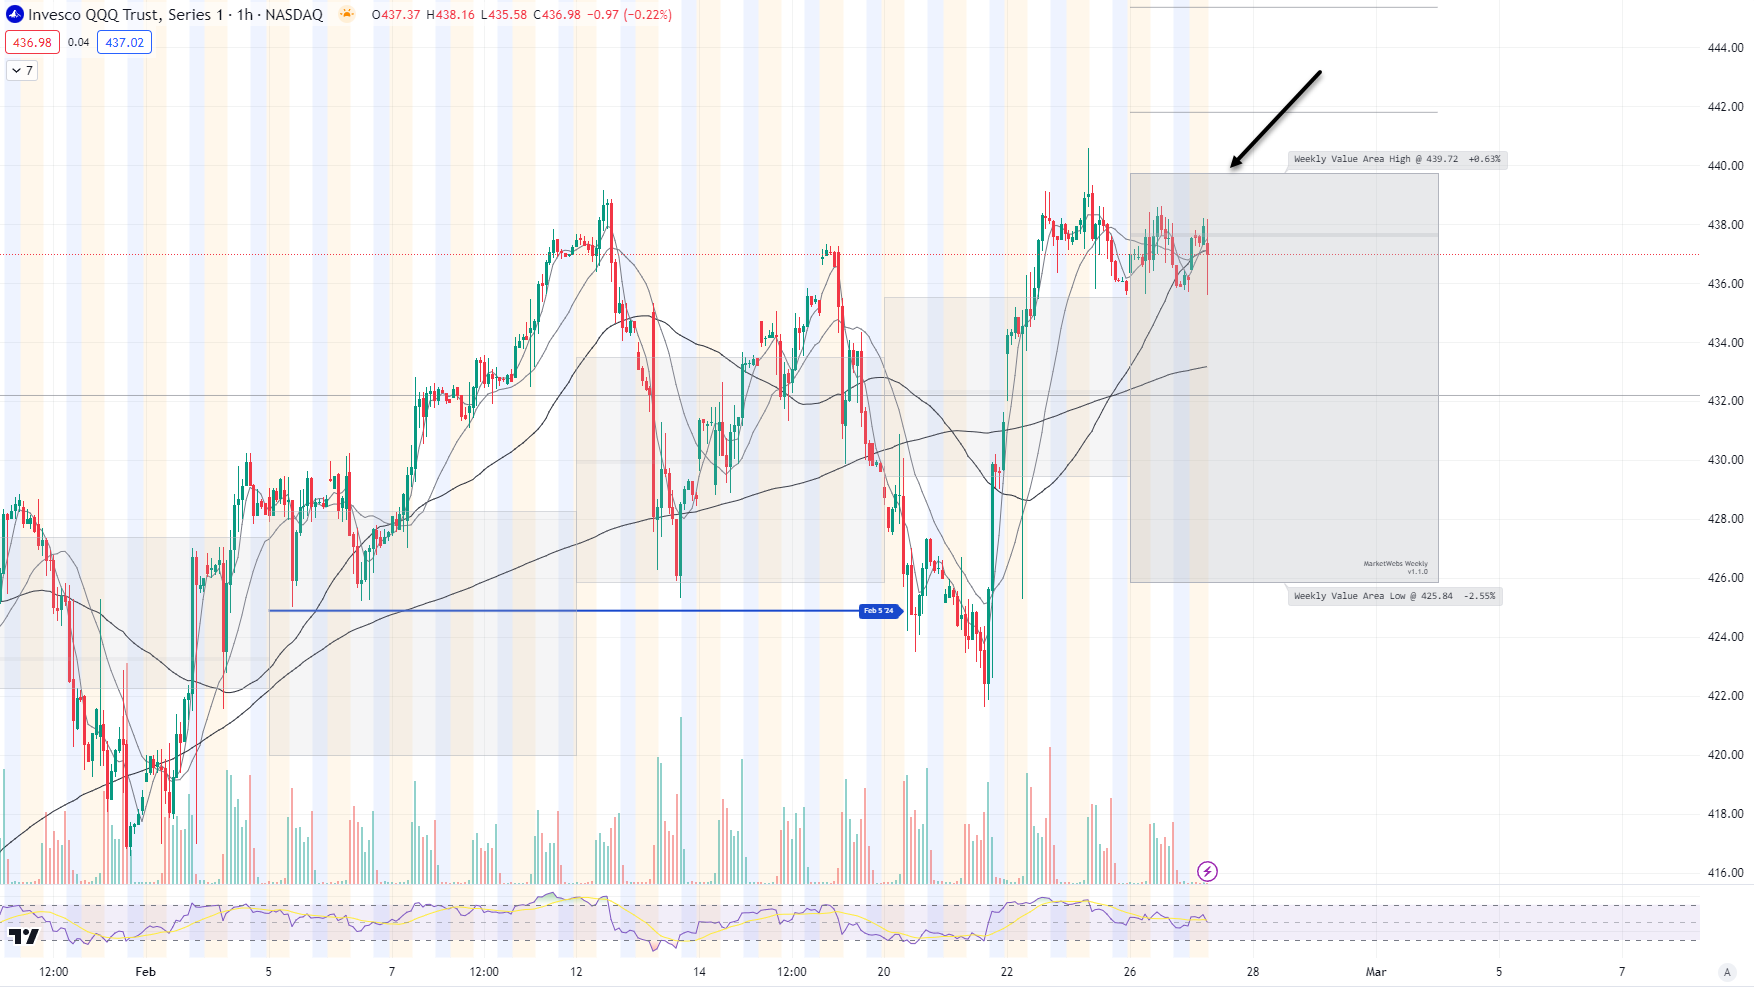
QQQ - NDX 100 ETF - Daily chart: Price ind. +0.1% and remains above all short term MAs
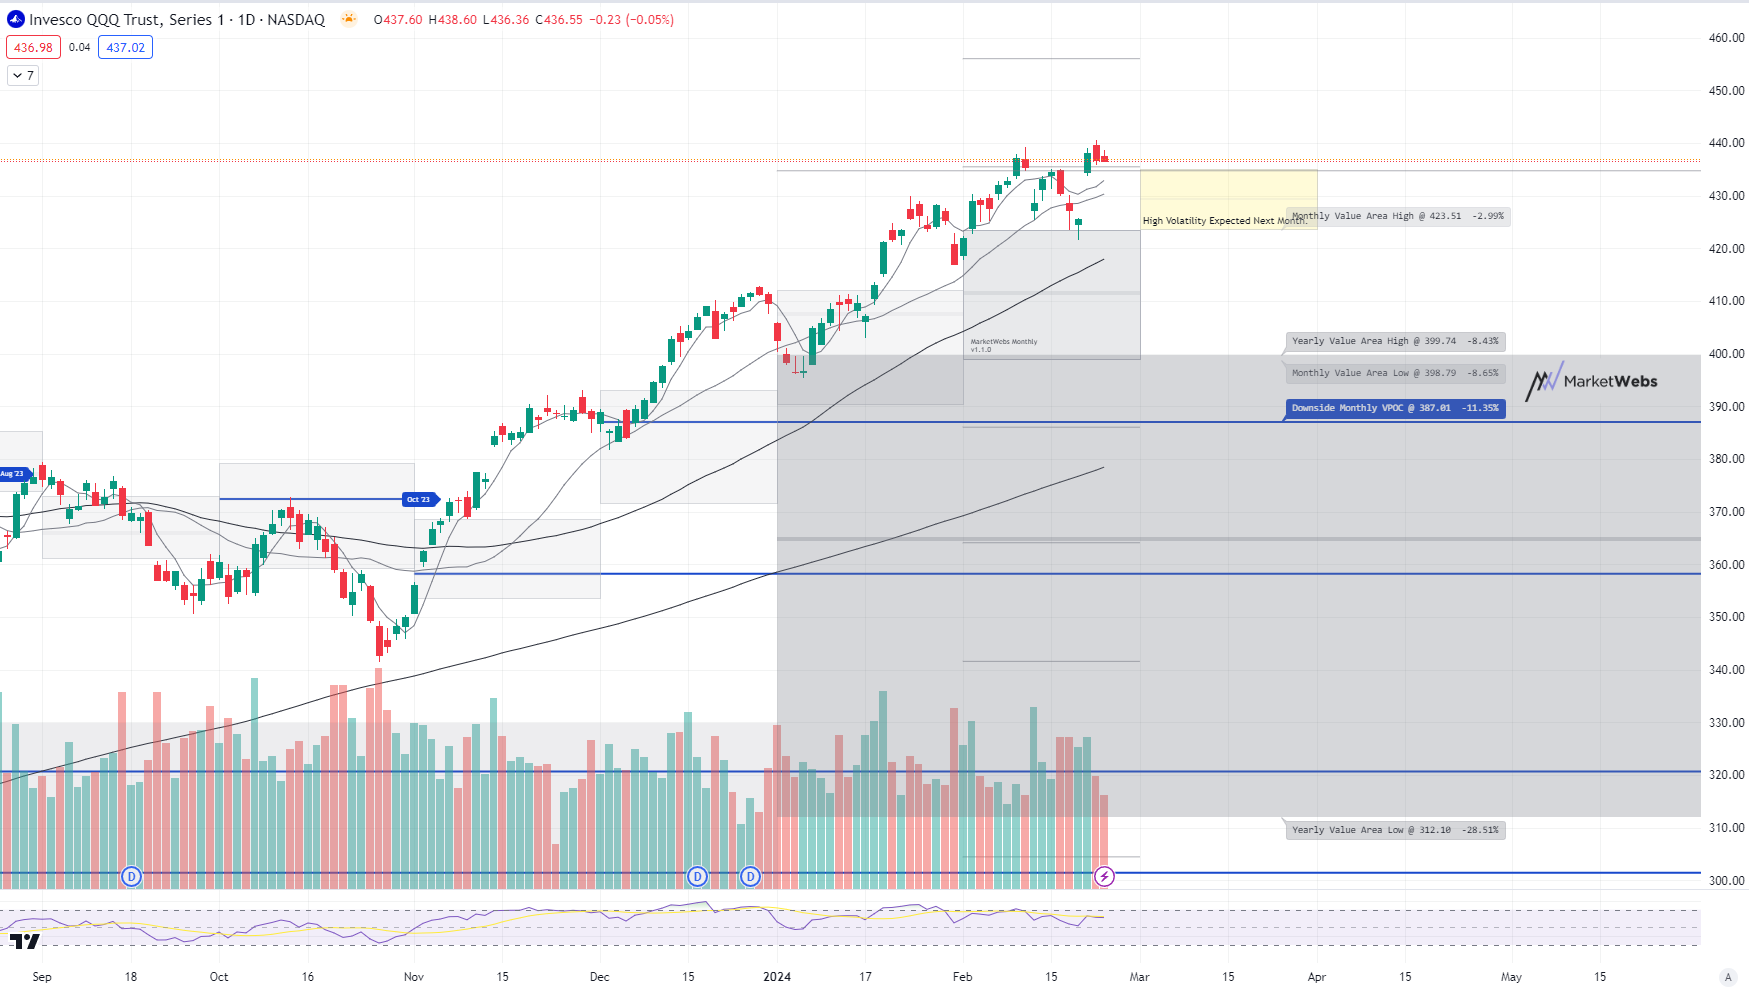
1hr chart: Price is inside its Value Area for the week and showing a touch of relative weakness vs S&P and IWM this week so far
IWM - Russell Small Cap ETF- Price continuing to outperform this morning, ind. +0.7% this morning after +0.6% and trying to make 4 straight up days. Note, one point to make here is usually when IWM outperforms we see strong breadth and we have not seen that over the last couple days.
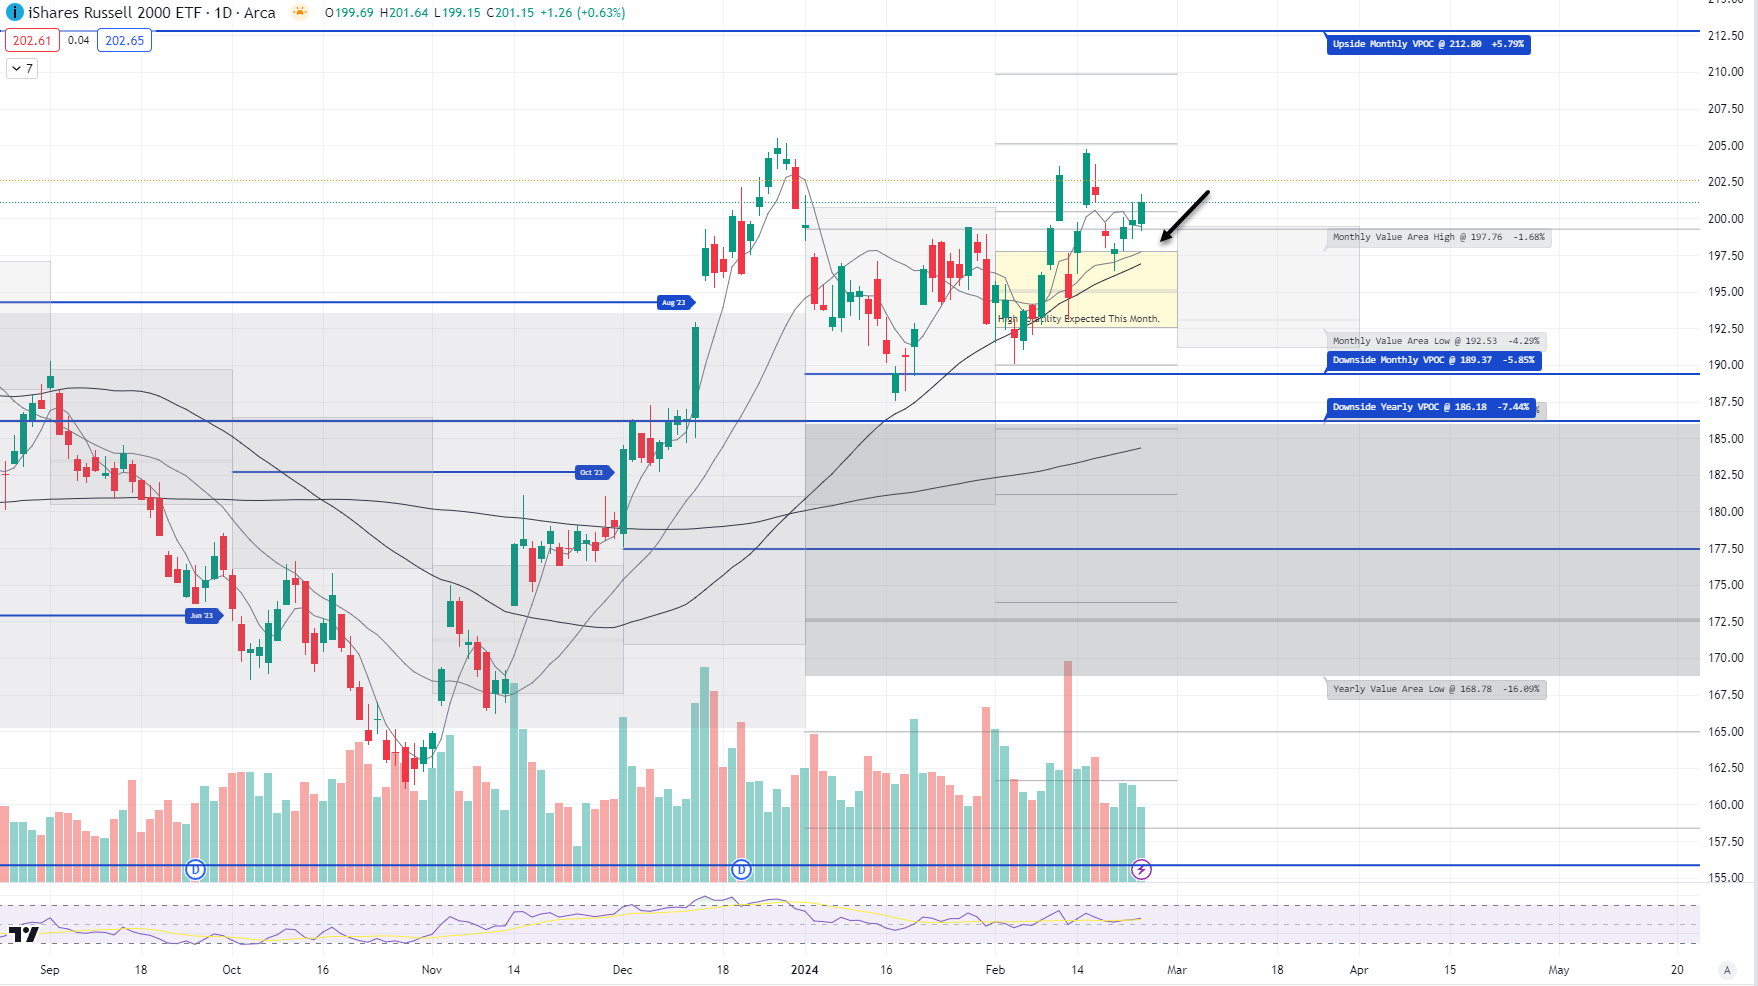
1hr chart: This morning an upside VPOC has been taken out and could be a place to take some profits after a multi day run on average breadth.

Here is today’s TTG Proprietary Stock Screen “Out of the Box” using Volume At Price
names trending above their Value Areas (on 3 multiple timeframes & not super extended)
Keep reading with a 7-day free trial
Subscribe to The Tribeca Trade Group to keep reading this post and get 7 days of free access to the full post archives.