

TTG Index Charts & Out of the Box Stock Screen 2/20/24 $VVV
TTG Index Charts & Out of the Box Stock Screen 2/20/24 $VVV
Out of the Box MarketWebs Screen
US Dollar -0.2% / 30yr Bonds flat / Crude -1.0% & Nat Gas -1.0% / Gold +0.7% / Copper -0.3%% / BTC +0.8%
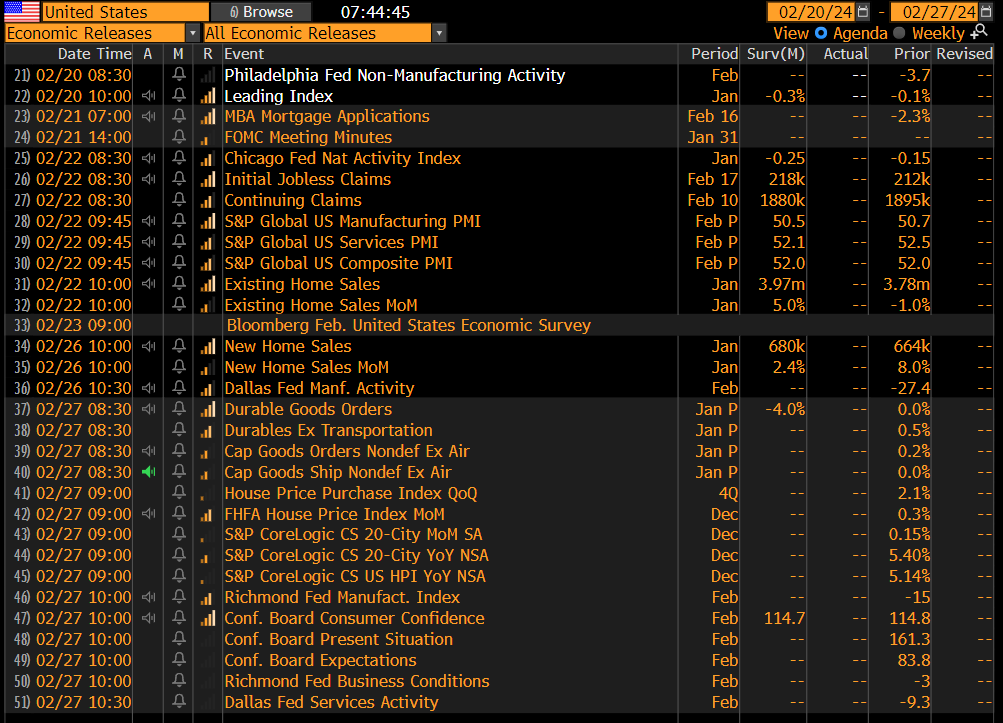
US Upcoming Economics
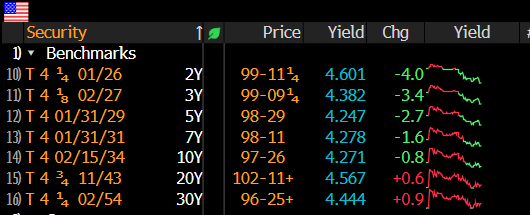
US Bond Yields
Index Updates
At TTG, I use Volume At Price in my chart analysis and I use the MarketWebs Indicator to provide Value Areas & VPOCs which indicate significant support & resistance levels. Learn More Here about Volume At Price and the MarketWebs.
ES_F - SPX Futures - Price ind. -0.3% and starting to move down to its 20d MA (Moving Average) , but remains decently above its Feb Value Area
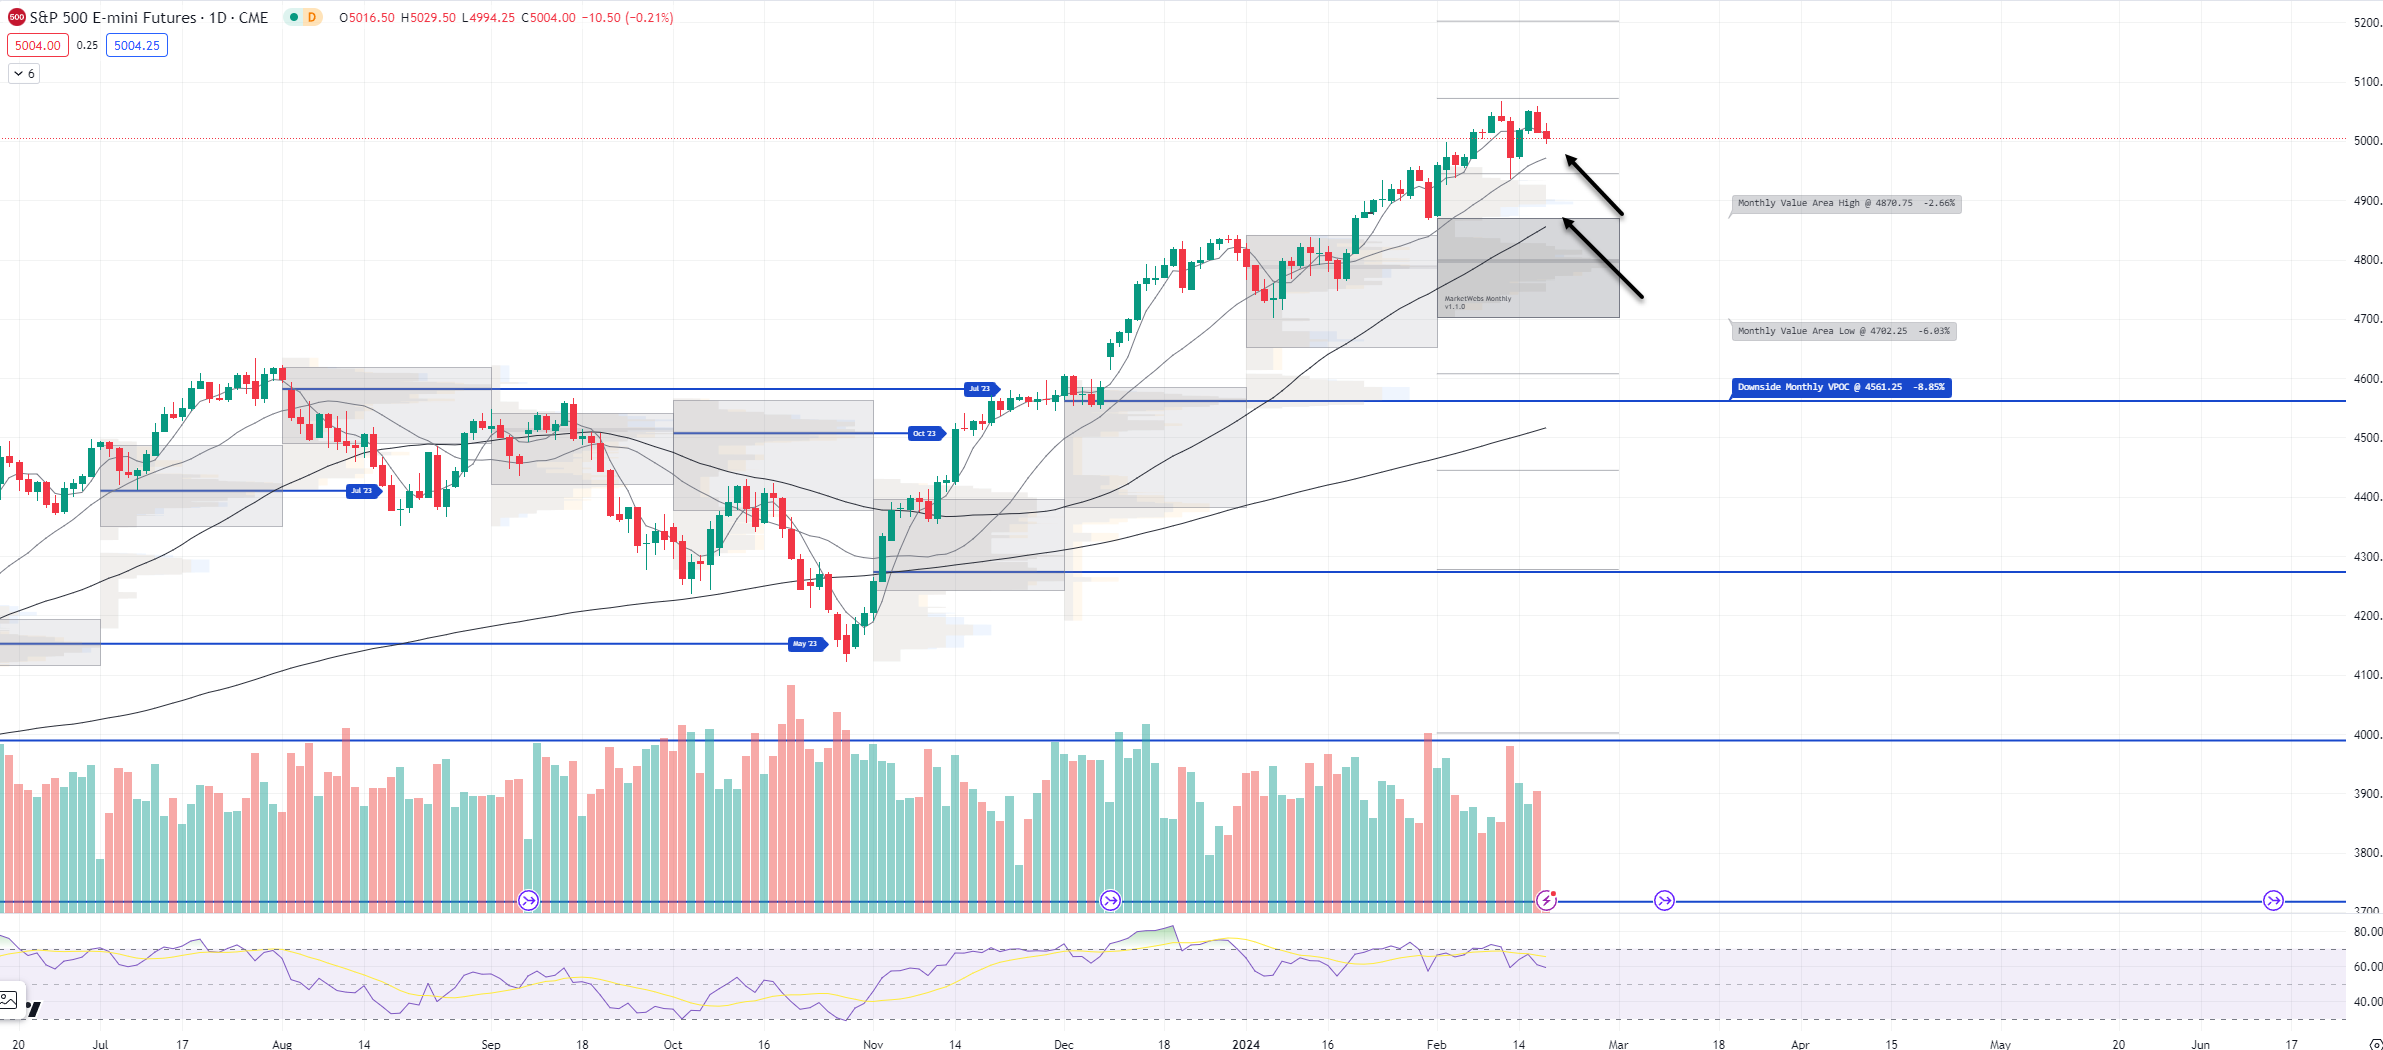
1hr chart: Price starts the new week inside its new Value Area, support to watch 4994.75
QQQ - NDX 100 ETF - Daily chart: Price ind. -0.3% this morning & made a lower highs last week. Support to watch is the 20d MA and top of the Feb Value Area, $423.51
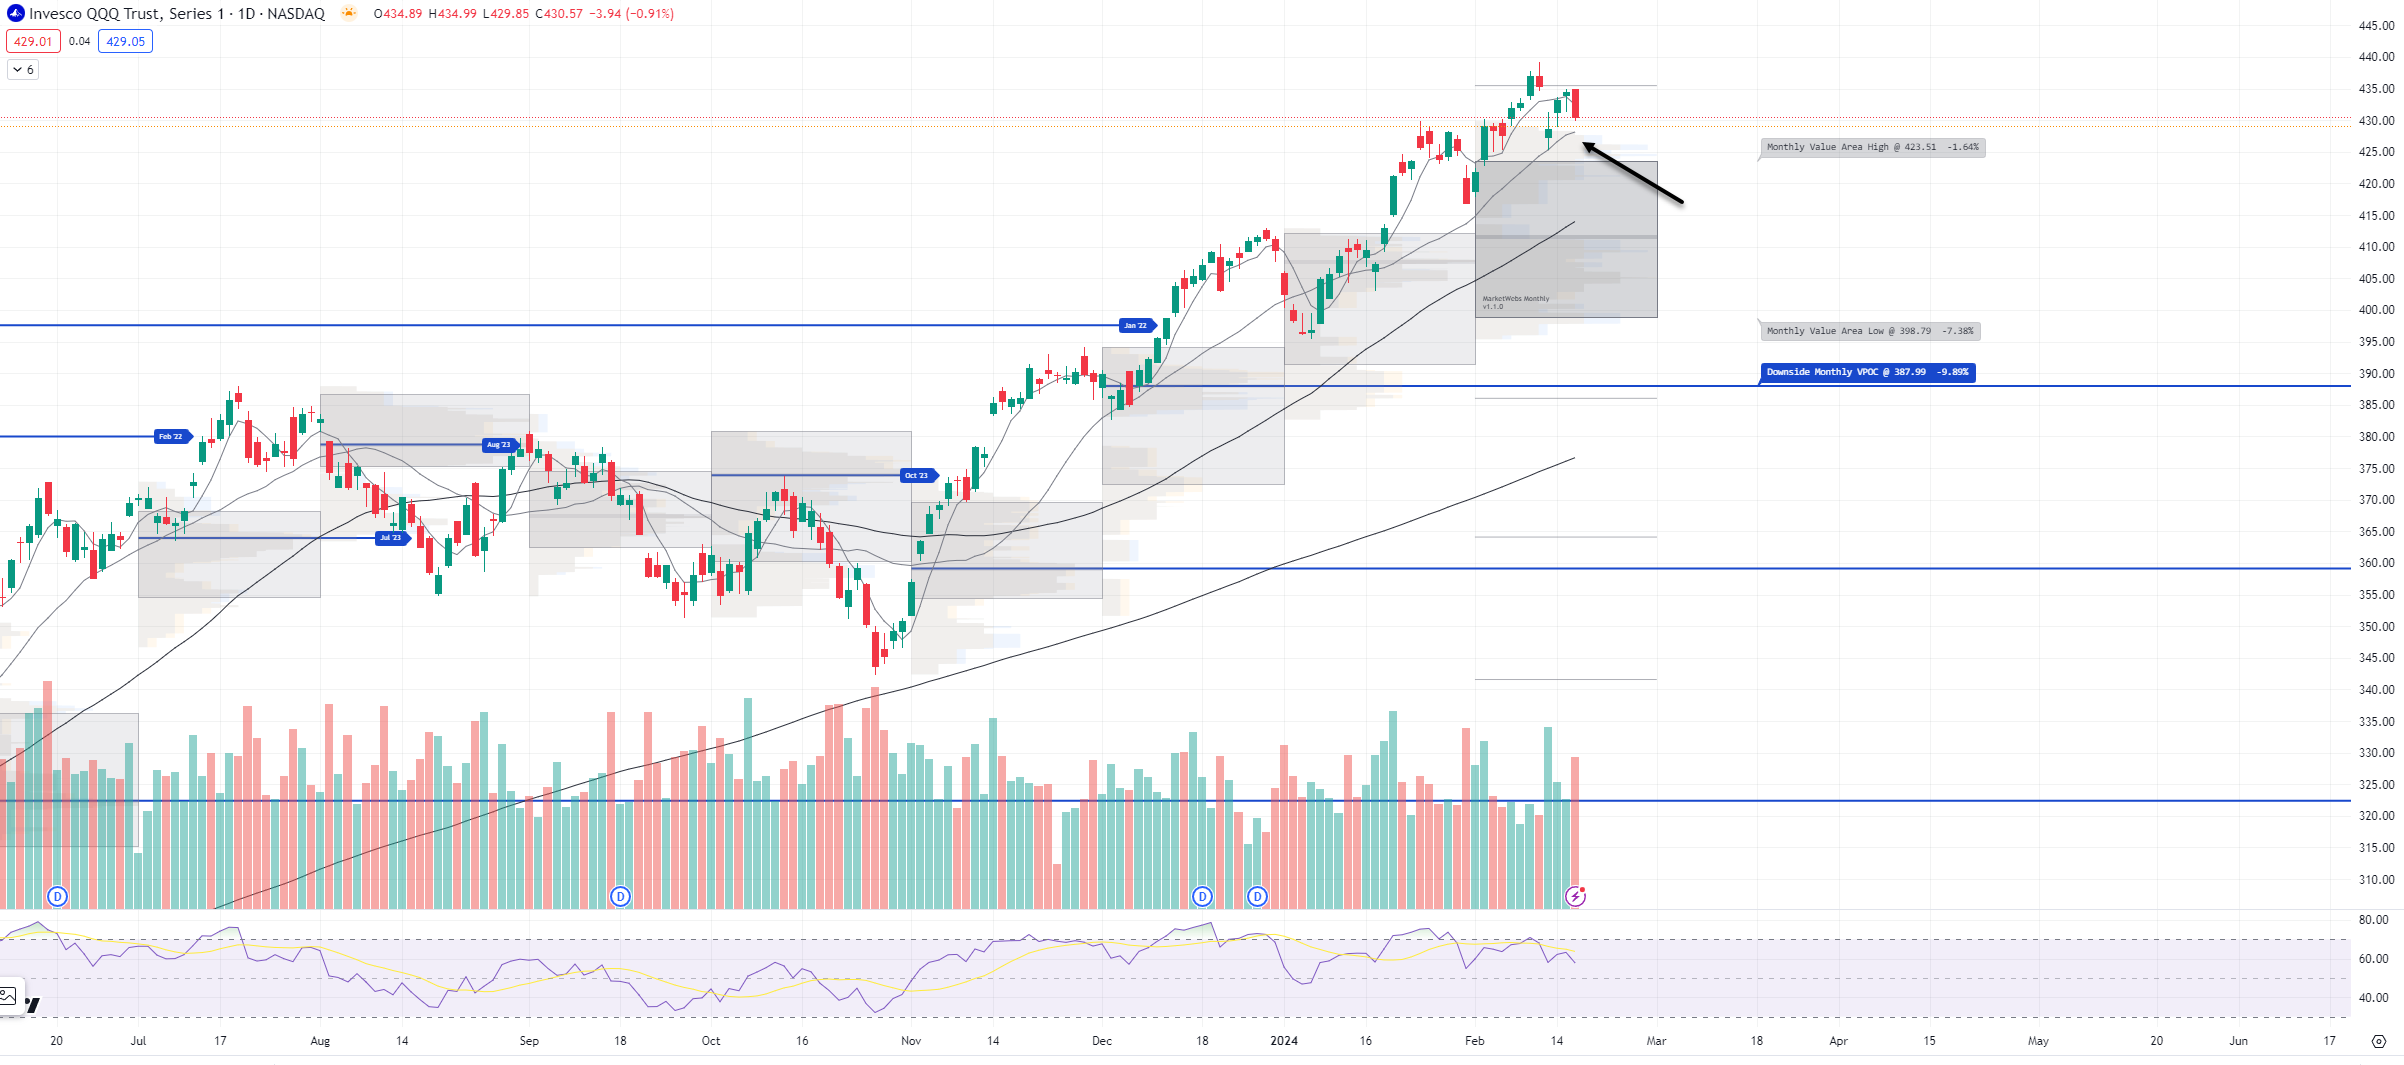
1hr chart: Price starts the week below its new Value Area for week, resistance to watch is $429.41 and lower VPOC to watch for support $424.89

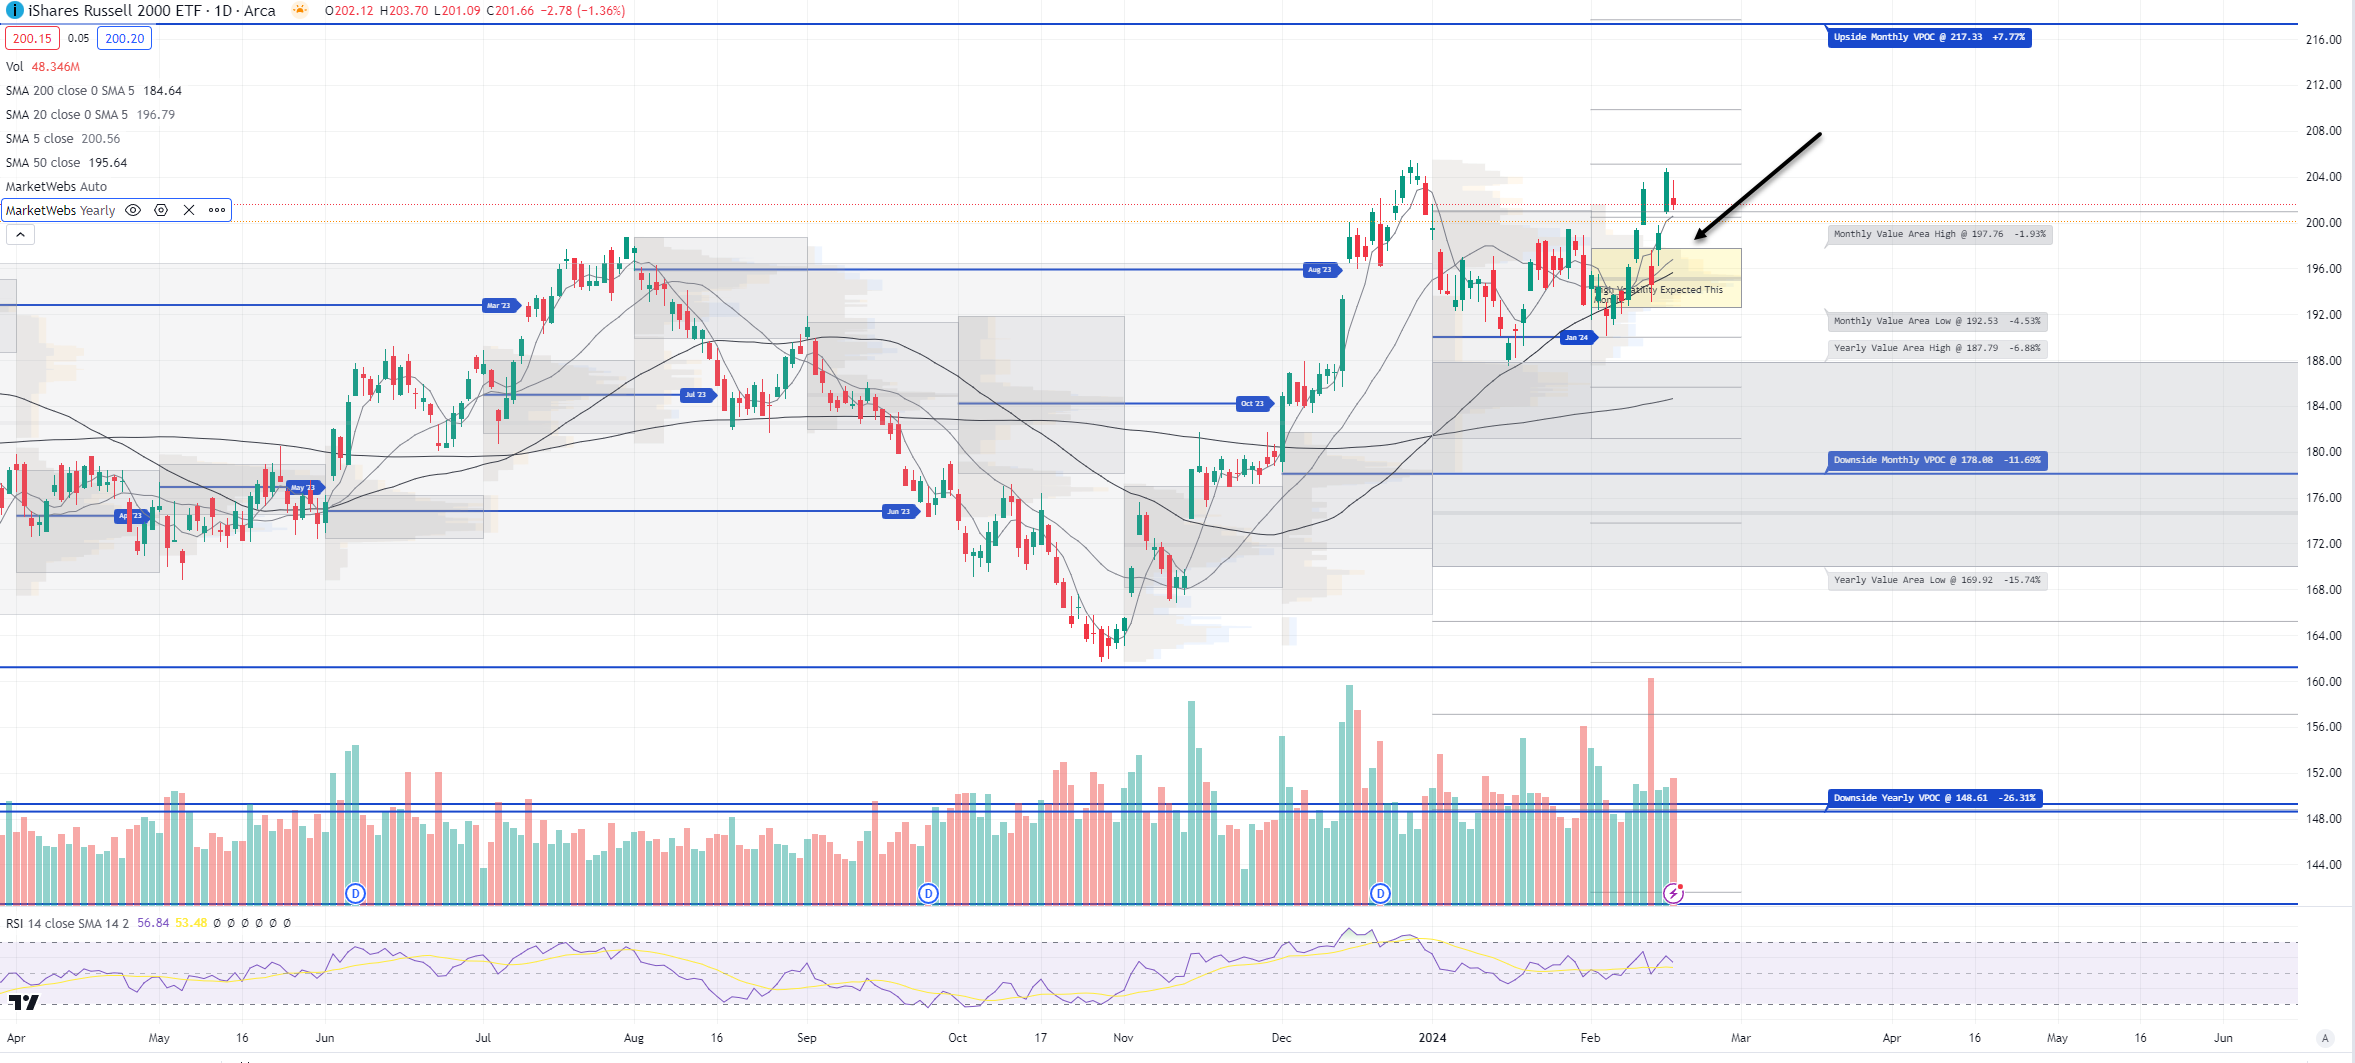
IWM - Russell Small Cap ETF- Price underperforming this morning, -0.8%. Support to watch is the top of the Feb Value Area, $197.76
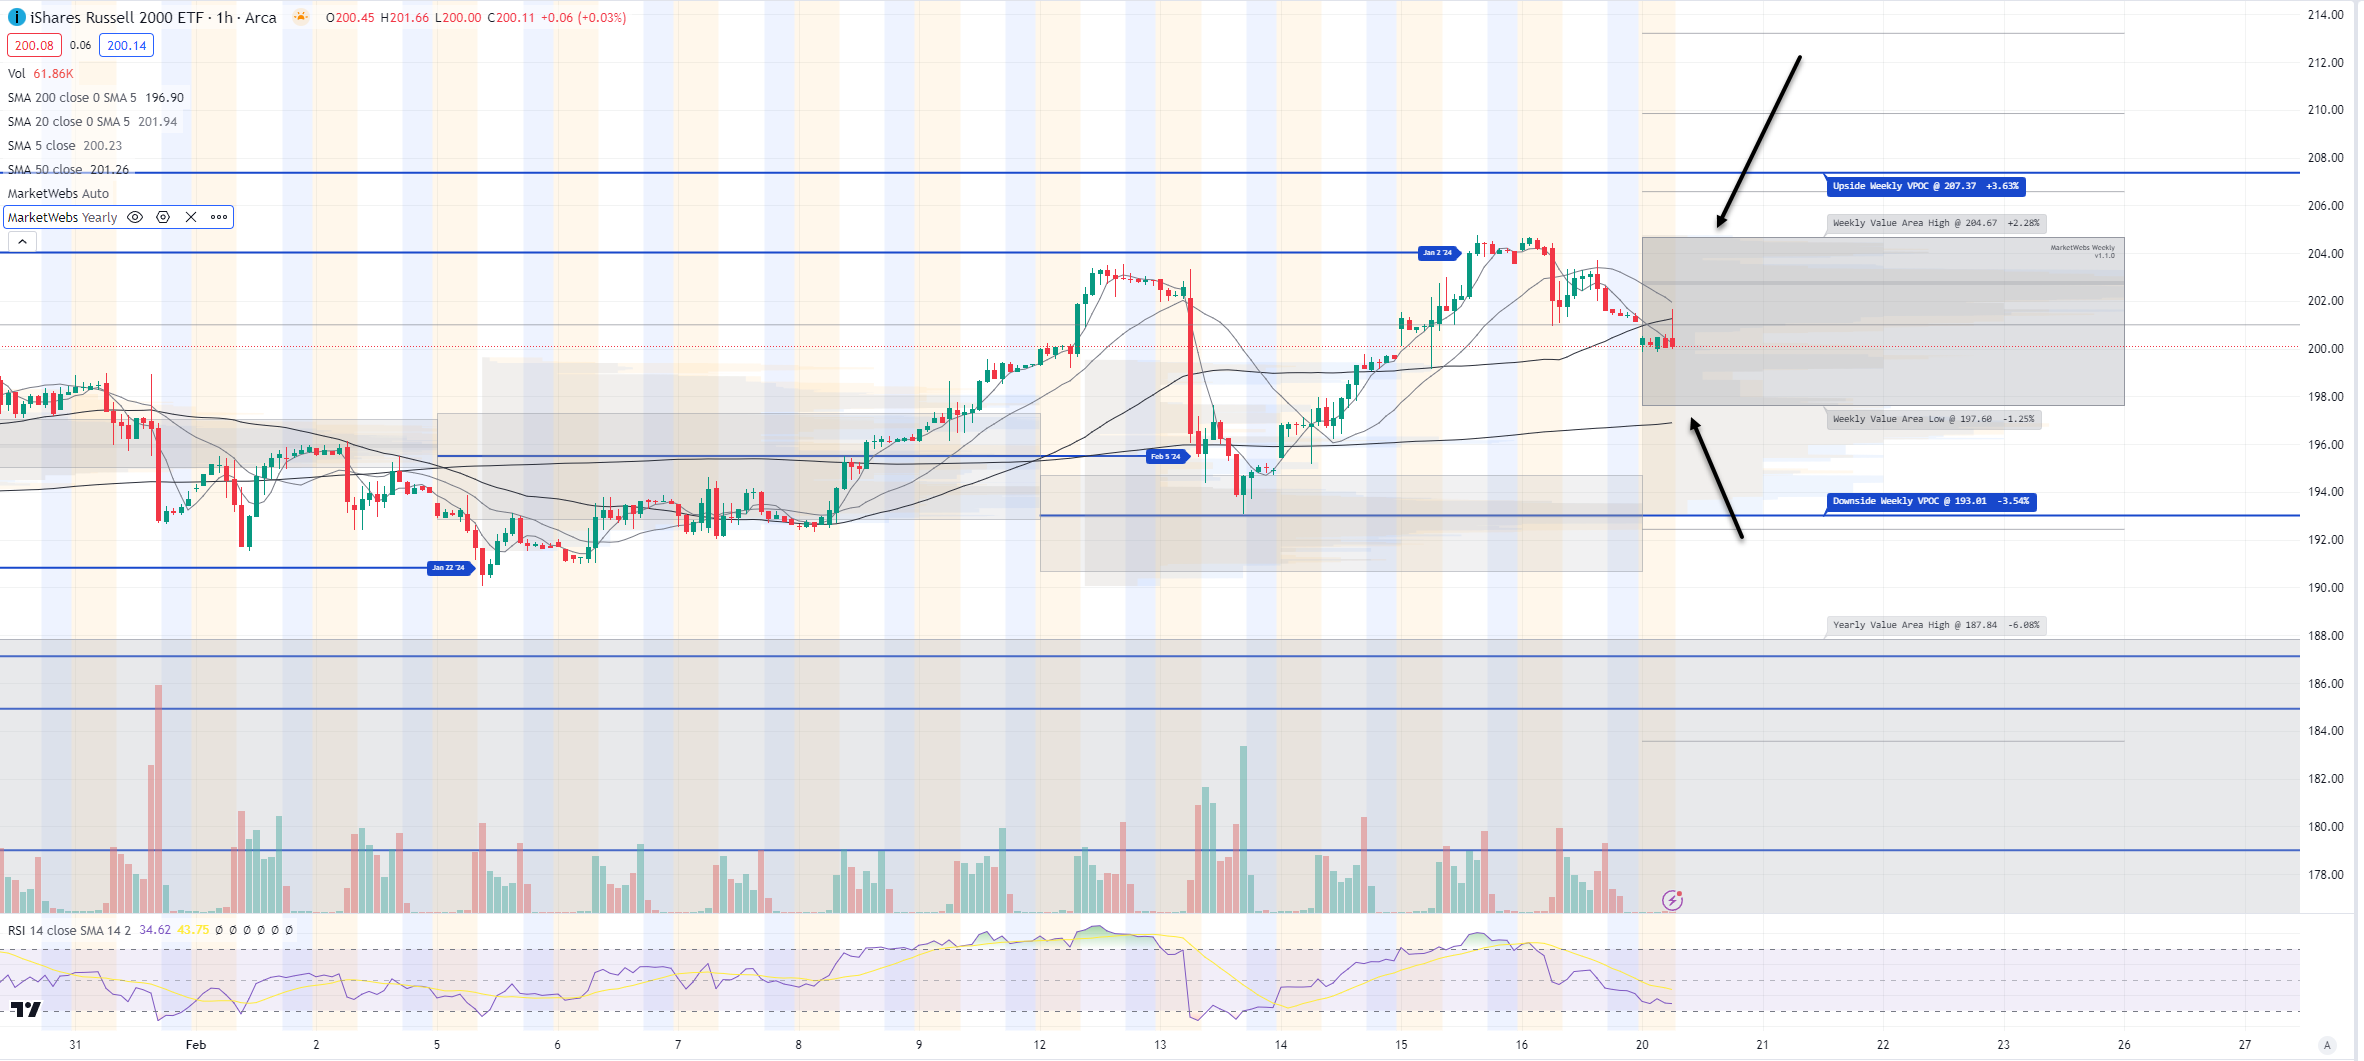
1hr chart: Price starts the week inside its new Value Area for the week , see levels to watch below
Here is today’s TTG Proprietary Stock Screen “Out of the Box” using Volume At Price
names trending above their Value Areas (on 3 multiple timeframes & not super extended)
Keep reading with a 7-day free trial
Subscribe to The Tribeca Trade Group to keep reading this post and get 7 days of free access to the full post archives.