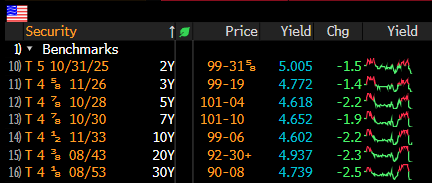
30yr Bonds +0.6% / Crude +1.0% & Nat Gas +0.3% / Gold -1.0% / Copper -0.8% / Cryptos are higher BTC +1.8%
US Upcoming Economics
US Bond Yields
TTG End of Day Video
Click here for End of Day Video
Index Updates
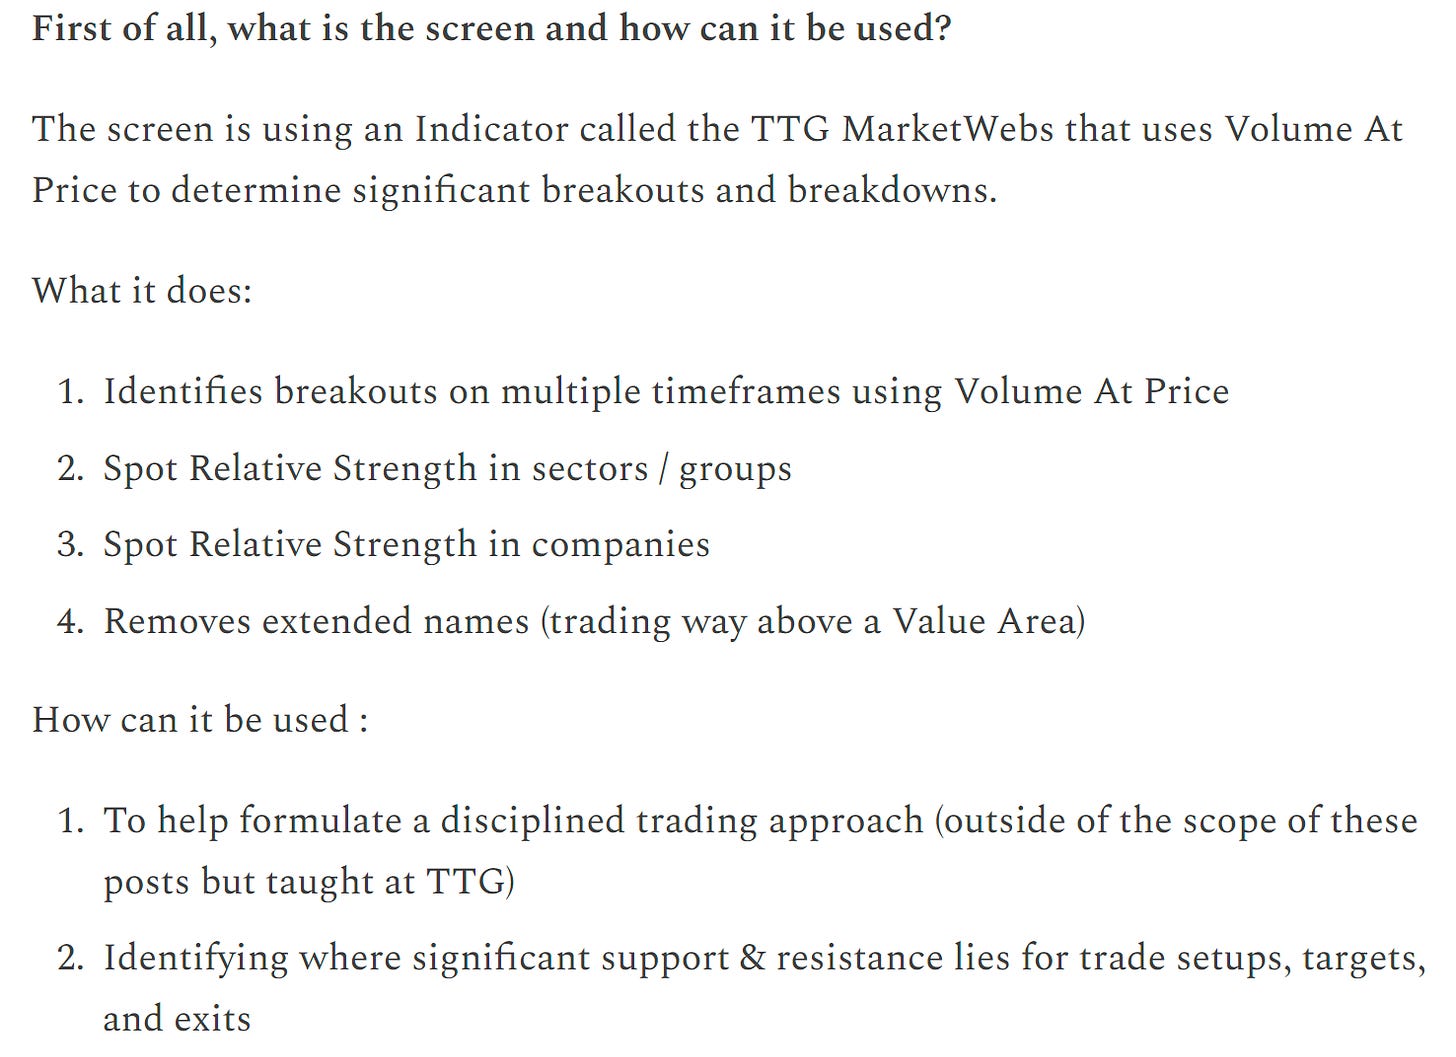
At TTG, I use Volume At Price in my chart analysis and I use the MarketWebs Indicator to provide Value Areas & VPOCs which indicate significant support & resistance levels. Learn More Here about Volume At Price and the MarketWebs.
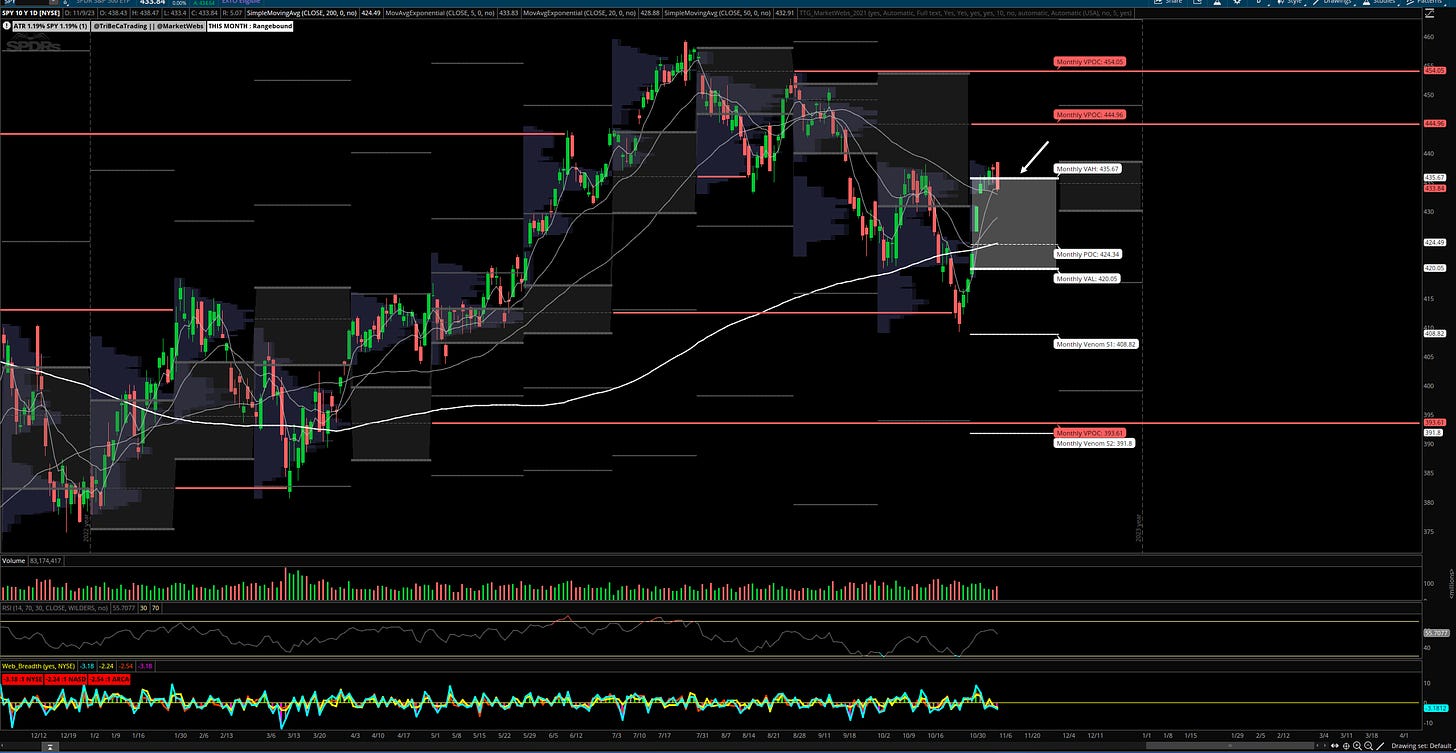
SPY - S&P ETF - Daily chart: Price moved back inside its Nov Value Area after a jump in Bond Yields attributed to a weak 30yr Bond Auction. Note a very similar reaction both in Bonds and Equities occurred on the last 30yr Bond Auction back on Oct 12th. So, what I would like to see is for Bond Yields to stabilize and not rise further. I believe if that occurs, price in Equities may continue to rise during its strong Nov seasonality. As always, we have levels to watch to confirm our hypothesis - $435.67 is the top of the Nov Value Area & simply put: price needs to reclaim this for the rally to continue
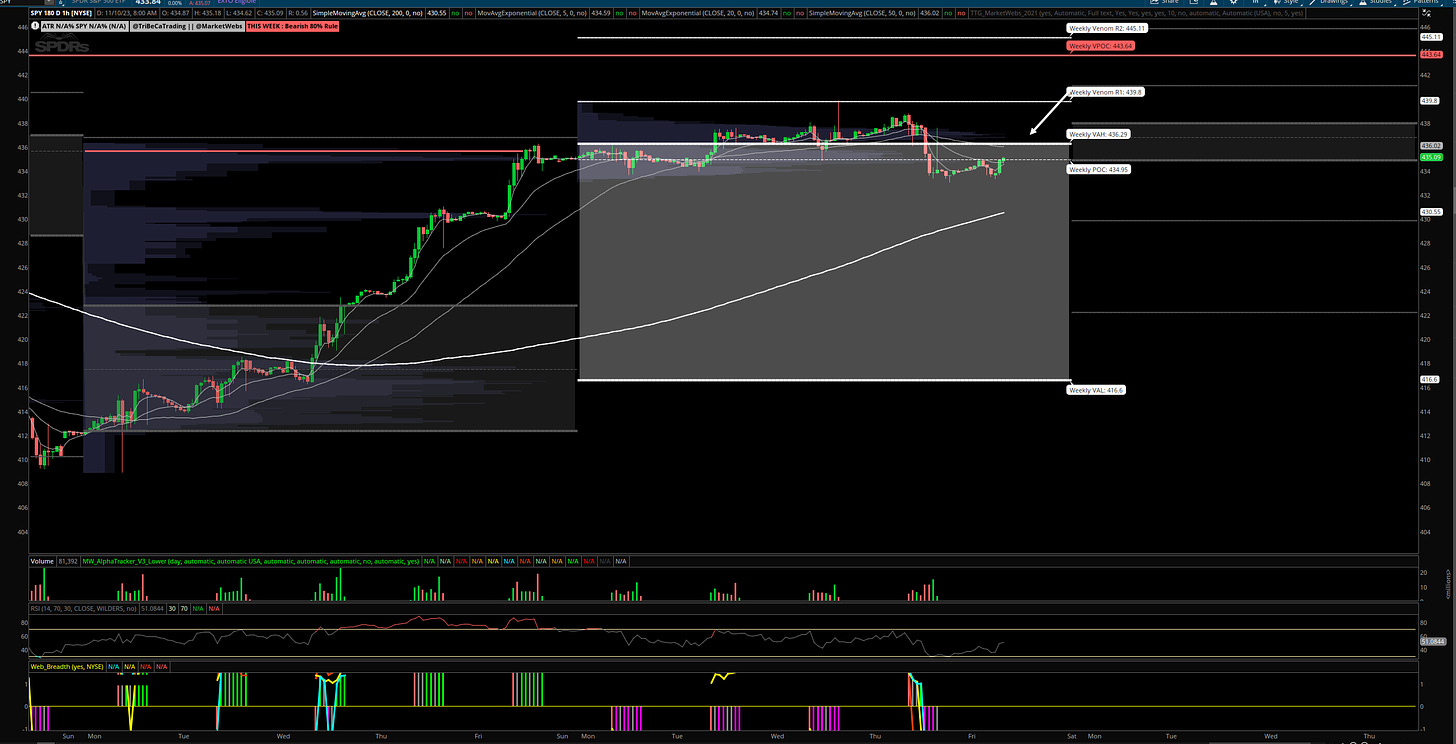
1hr chart: Price fell back inside is Value Area for the week, watch $436.29 top of value
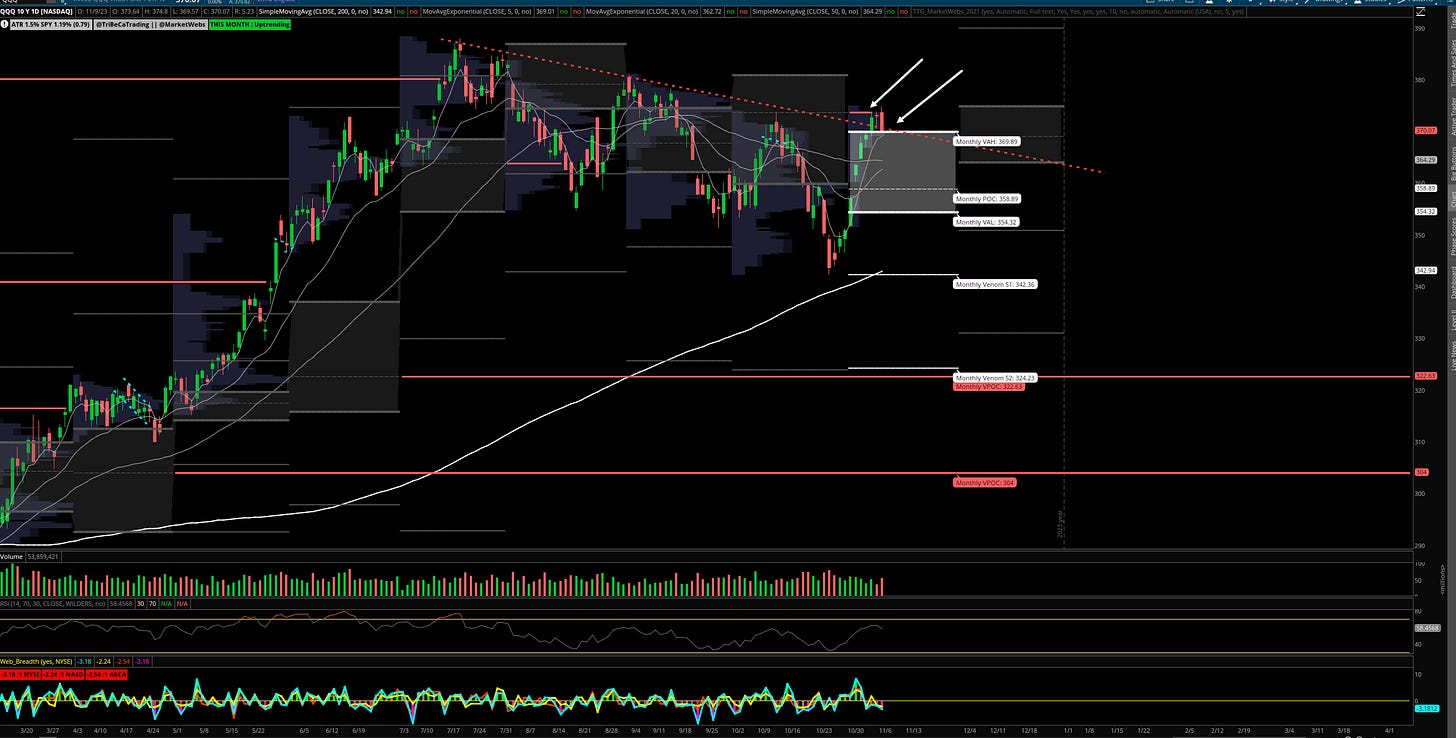
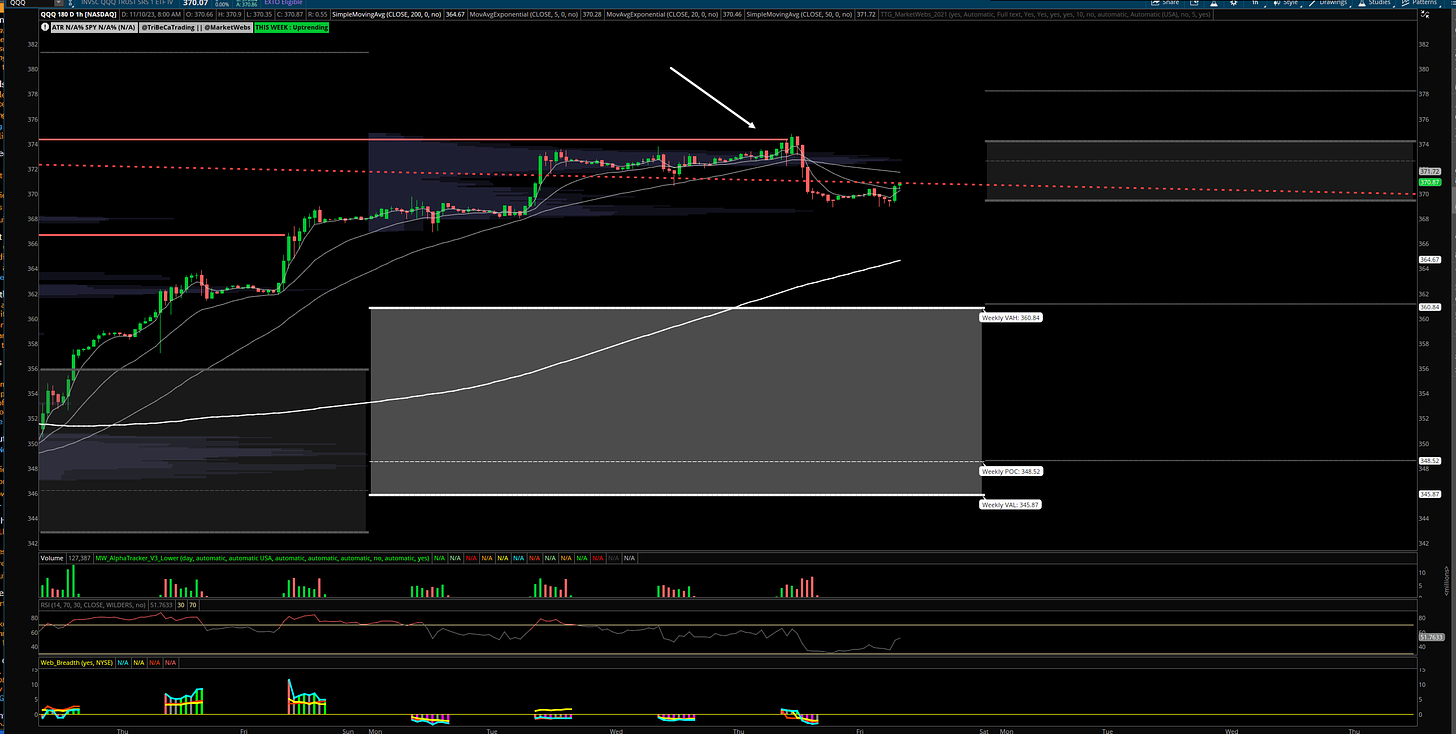
QQQ - NDX 100 ETF - Daily chart: Upside VPOC (red line) taken out and a fade. The question is can price hold that top of Nov Value Area? The level to watch $369.89. Decision is if price can hold that level, I want to be long QQQ , and if not more of a neutral stance.
1hr chart: As mentioned in yesterday's report: "upside VPOC to watch $374.37 - again, VPOCs can represent overhead supply & that could also be an area for price digestion / consolidation"
Yes, price was rejected right there... now, let's see if price can stabilize and stay above $374.37
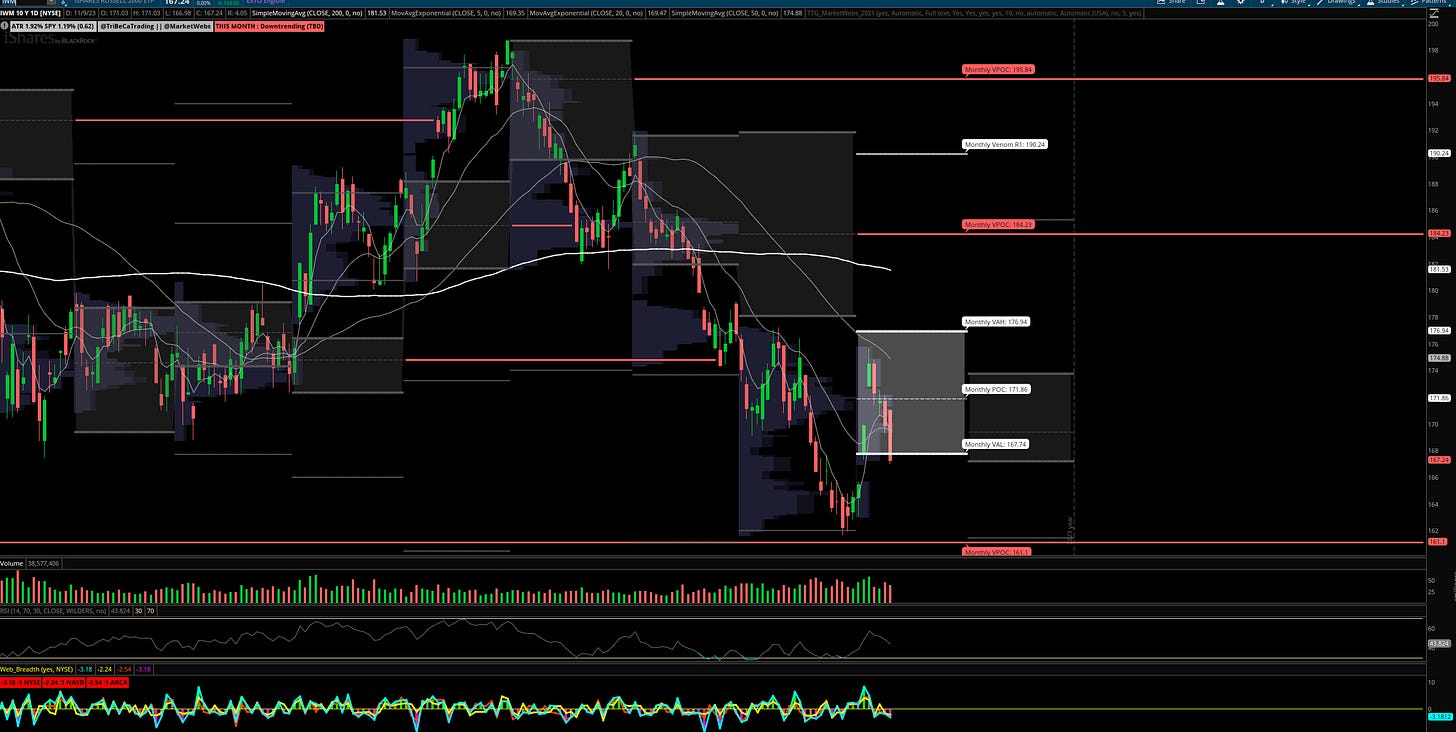
IWM- Russell Small Cap ETF- Daily Chart: After price rallied 7% a week ago, so far this week IWM has given back 4% of those gains. Now, price is back down to the bottom of the Nov Value Area, level to watch is $167.74. Let's see if price can stay above that today so we don't see a further break down in Small Cap prices.
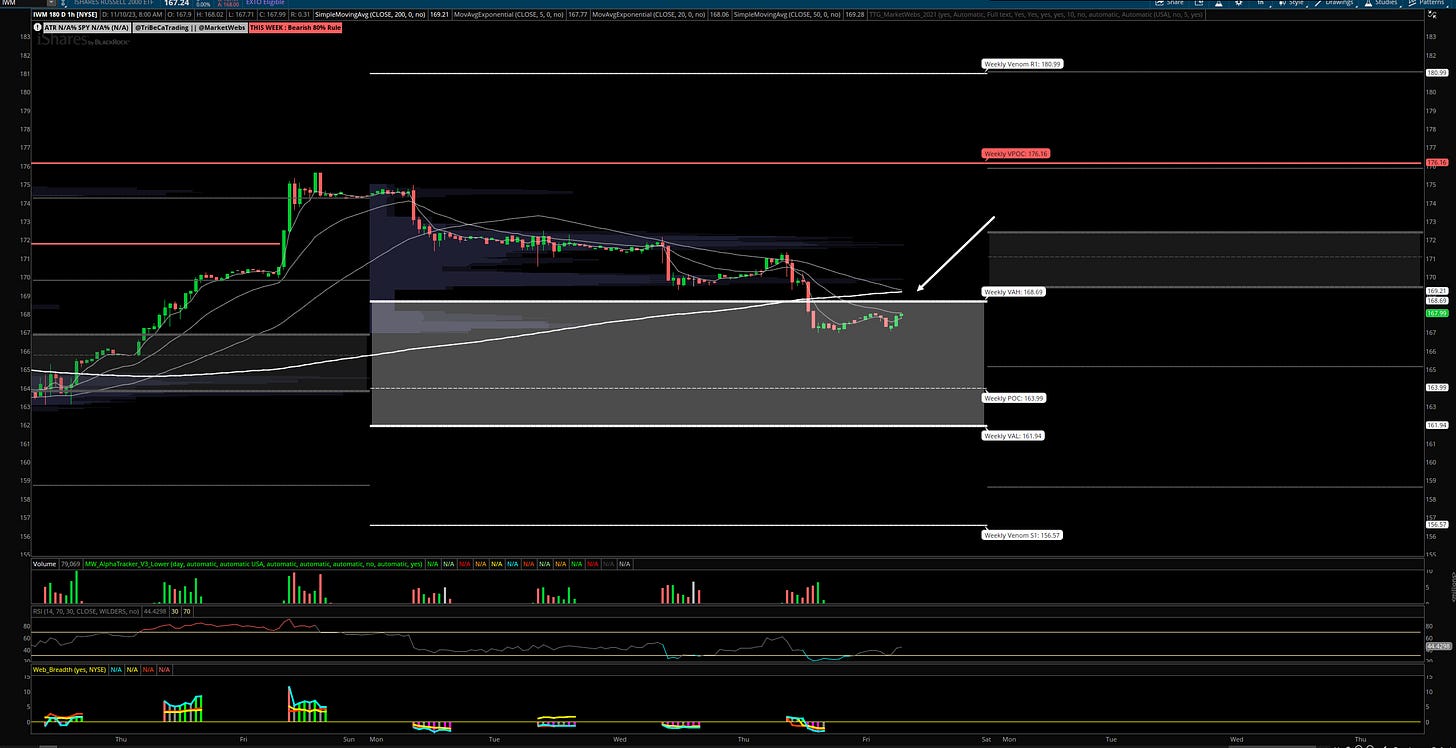
1hr chart: Price fell into its Value Area for the week, resistance is $168.69
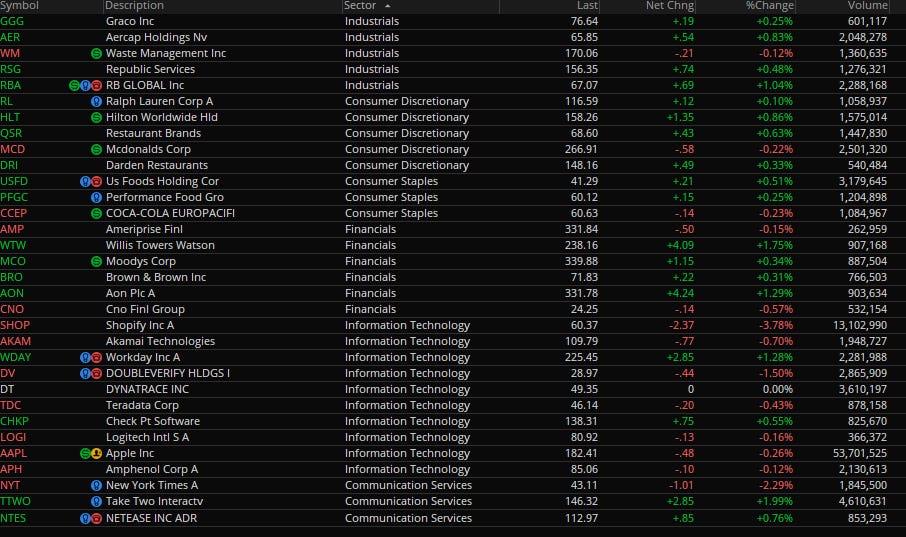
Here is today’s TTG Proprietary Stock Screen “Out of the Box” using Volume At Price
names trending above their Value Areas (on 3 multiple timeframes & not super extended)
Charts
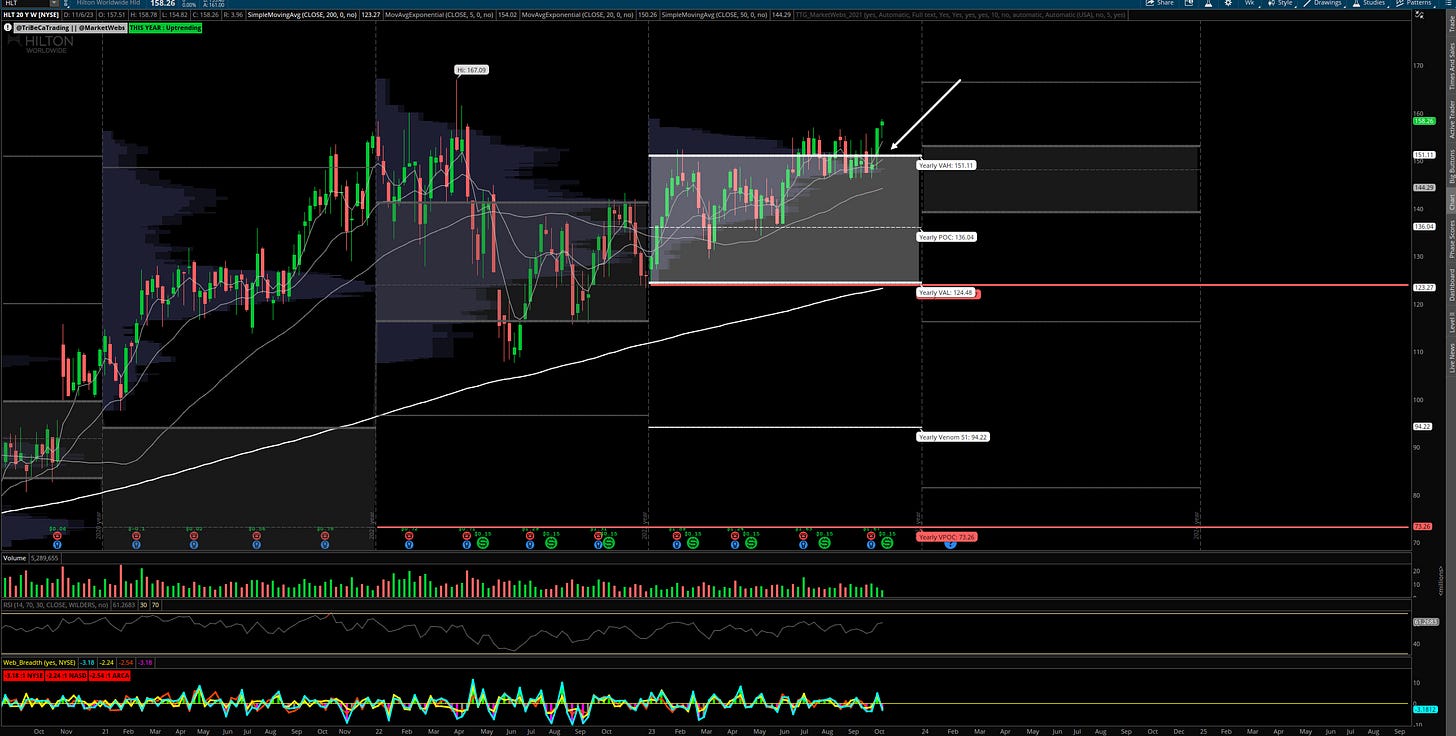
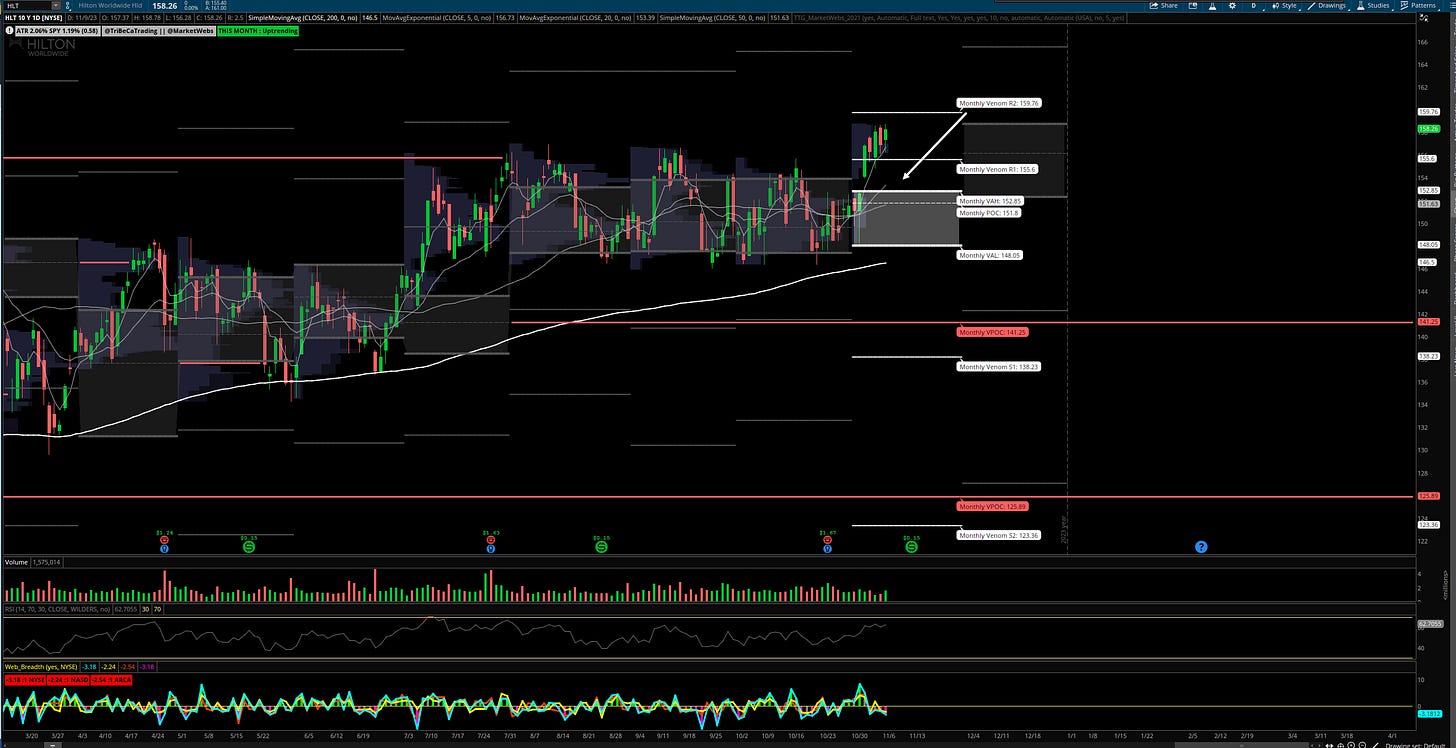
HLT Weekly & Daily chart
Hilton Worldwide Holdings Inc. operates as a holding company. The Company, through its subsidiaries, provides hospitality services. Hilton Worldwide Holdings owns and manages hotels, resorts, and time share properties worldwide.(Bloomberg)
- using the TTG MarketWebs & upside price target $153 VPOC (red line).
Sign up here to get access to 50% off your first month of the The Tribeca Trade Group, coupon code TTGNEW
Copyright © Tribeca Trade Group. All of the information in this newsletter is for entertainment and educational purposes only and is not to be construed as investment or trading advice. None of the information in this newsletter is guaranteed to be accurate, complete, useful or timely. IMPORTANT NOTICES AND DISCLAIMERS TriBeCa Trade Group is not an investment advisor and is not registered with the U.S. Securities and Exchange Commission or the Financial Industry Regulatory Authority. Further, owners, employees, agents or representatives of TriBeCa Trade Group are not acting as investment advisors and might not be registered with the U.S. Securities Authority


