

TTG Index Charts & Out of the Box Stock Screen 4/1/24 $DRS
TTG Index Charts & Out of the Box Stock Screen 4/1/24 $DRS
Out of the Box MarketWebs Screen
US Dollar +0.1% / 30yr Bonds -0.4% / Crude -0.5% & Nat Gas +0.1% / Gold +1.2% / Copper +0.9% / BTC -2.0%
US Upcoming Economics

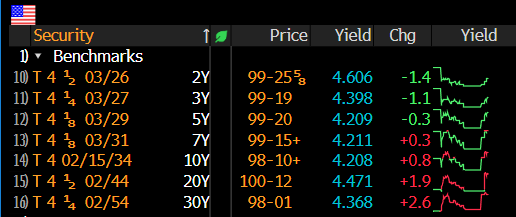
US Bond Yields
Index Updates
At TTG, I use Volume At Price in my chart analysis and I use the MarketWebs Indicator to provide Value Areas & VPOCs which indicate significant support & resistance levels. Learn More Here about Volume At Price and the MarketWebs.
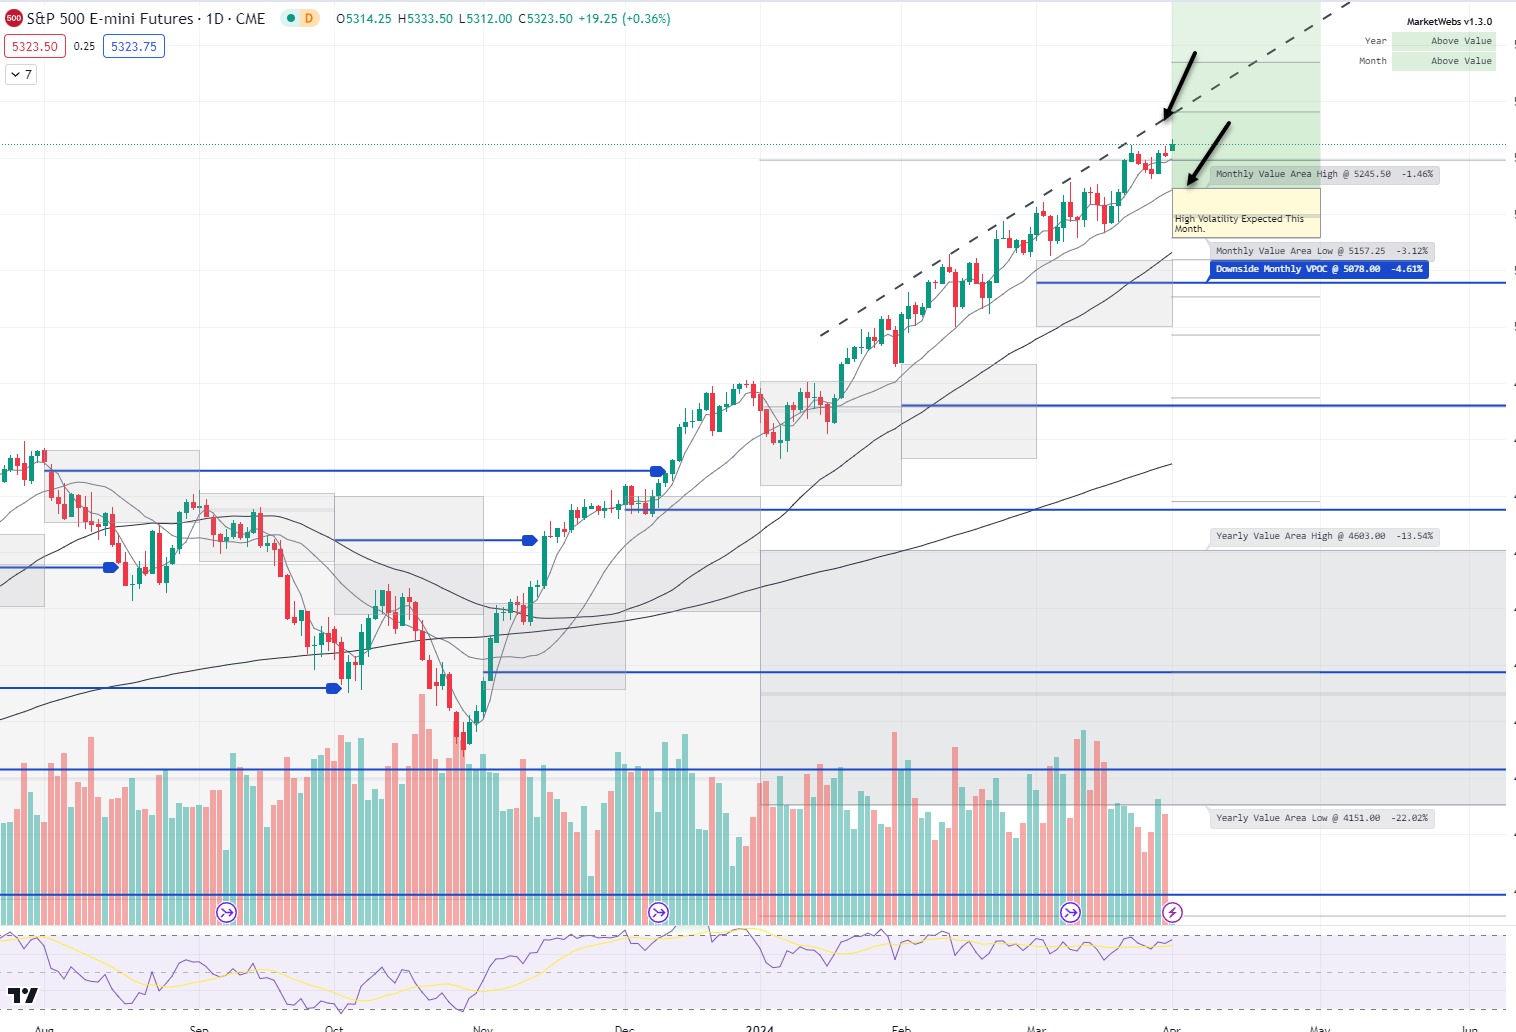
ES_F - SPX Futures - Price starts the new month above its Value Area, and remains inside the uptrend channel. Support for April will be 5245.50 & resistance for now is the uptrend channel line.
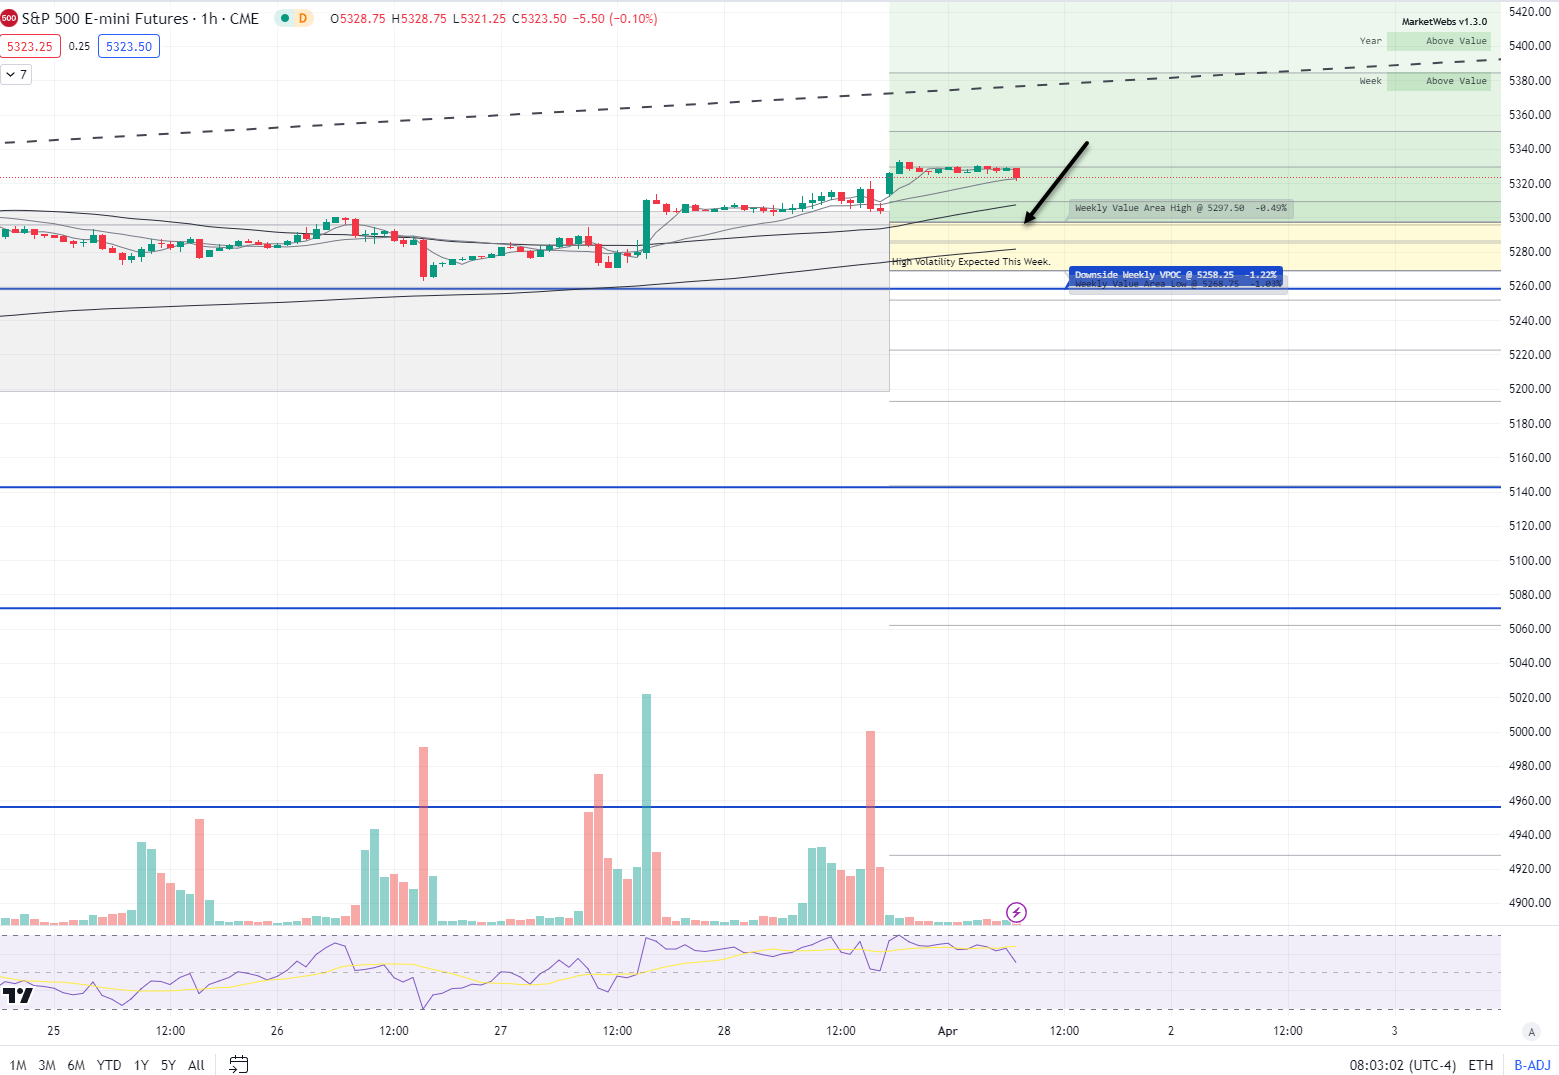
1hr chart: Price start the new week above its Value Area, 1st level of support to watch 5297.50
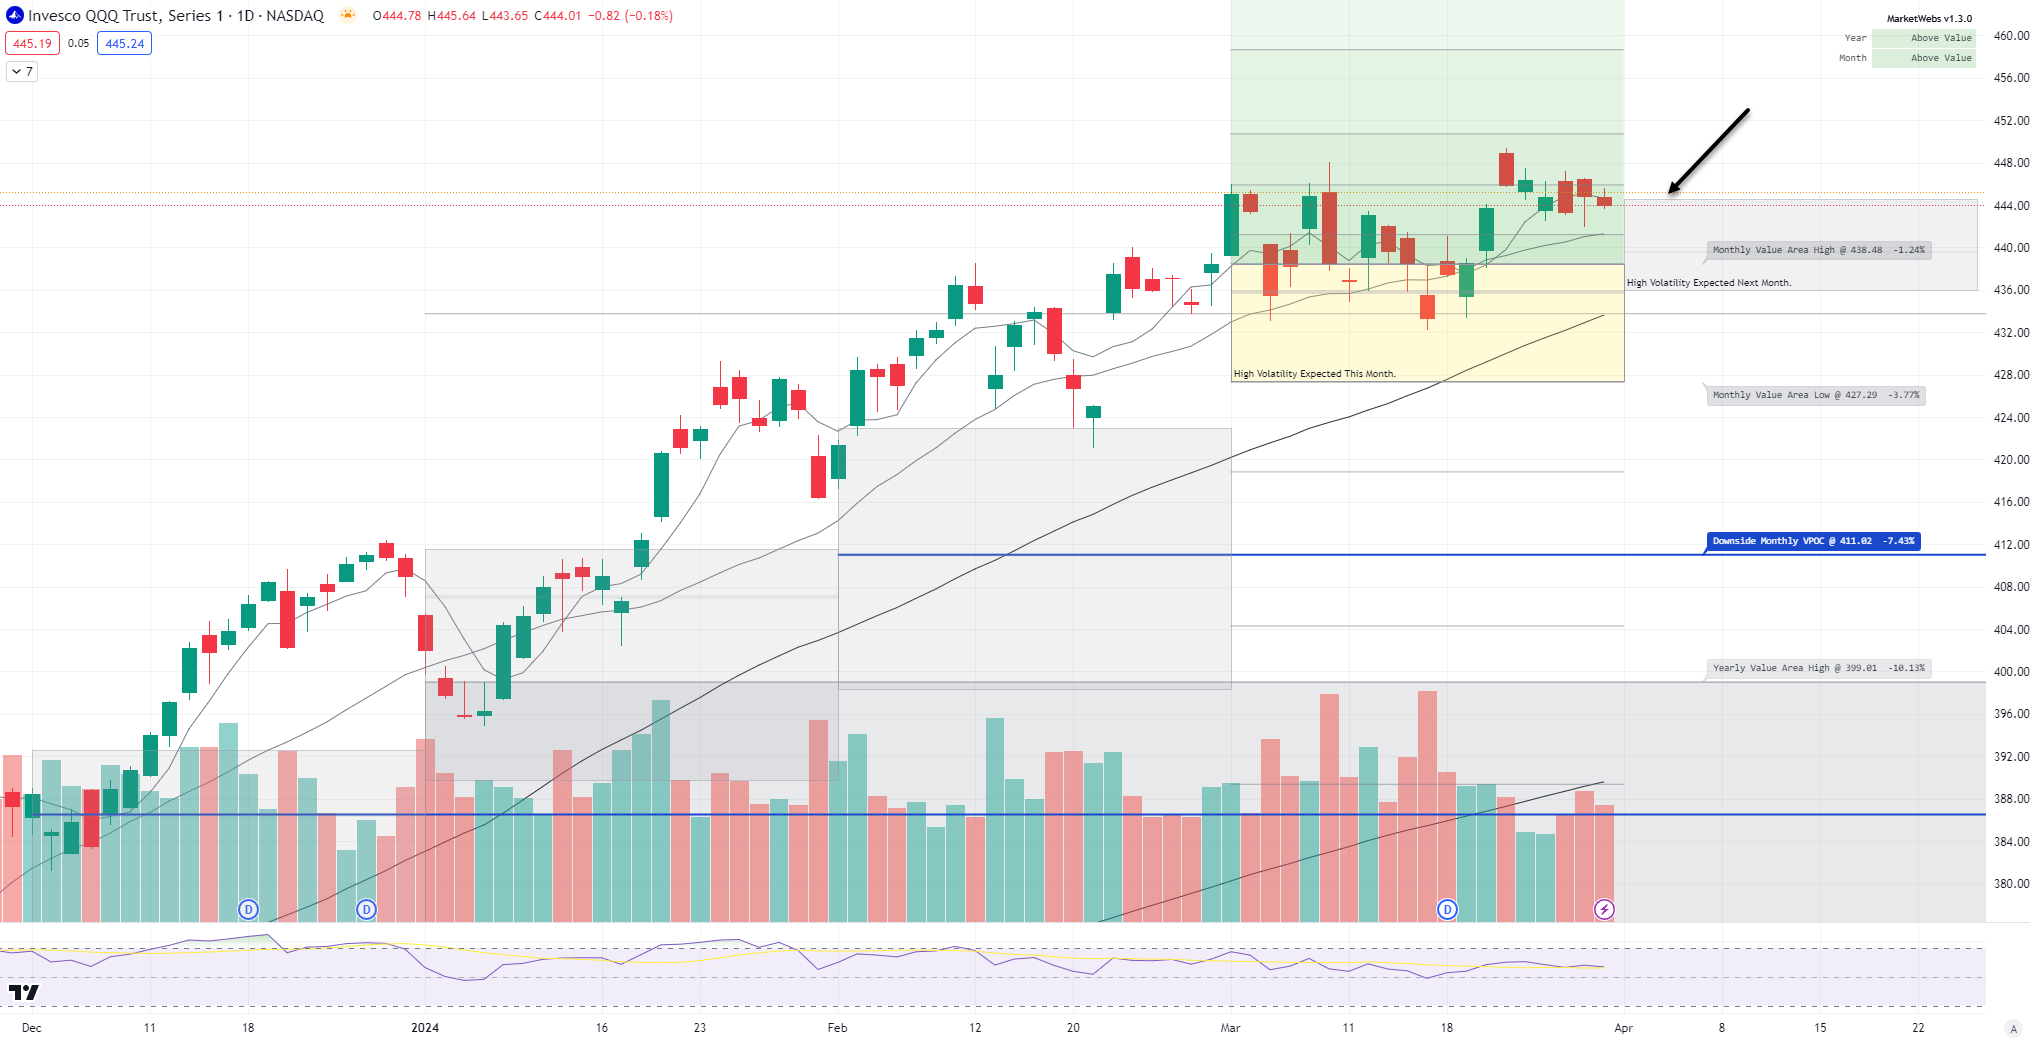
QQQ - NDX 100 ETF - Daily chart: Price ind. +0.2% this morning and will be interesting to see if price will be above / inside Value by end of day, watch $444.6. If cannot maintain above its Value Area it will indicate that price is more range bound and without momentum.
1hr chart: Price is starting the new week inside its Value Area, watch $445.98 top of value
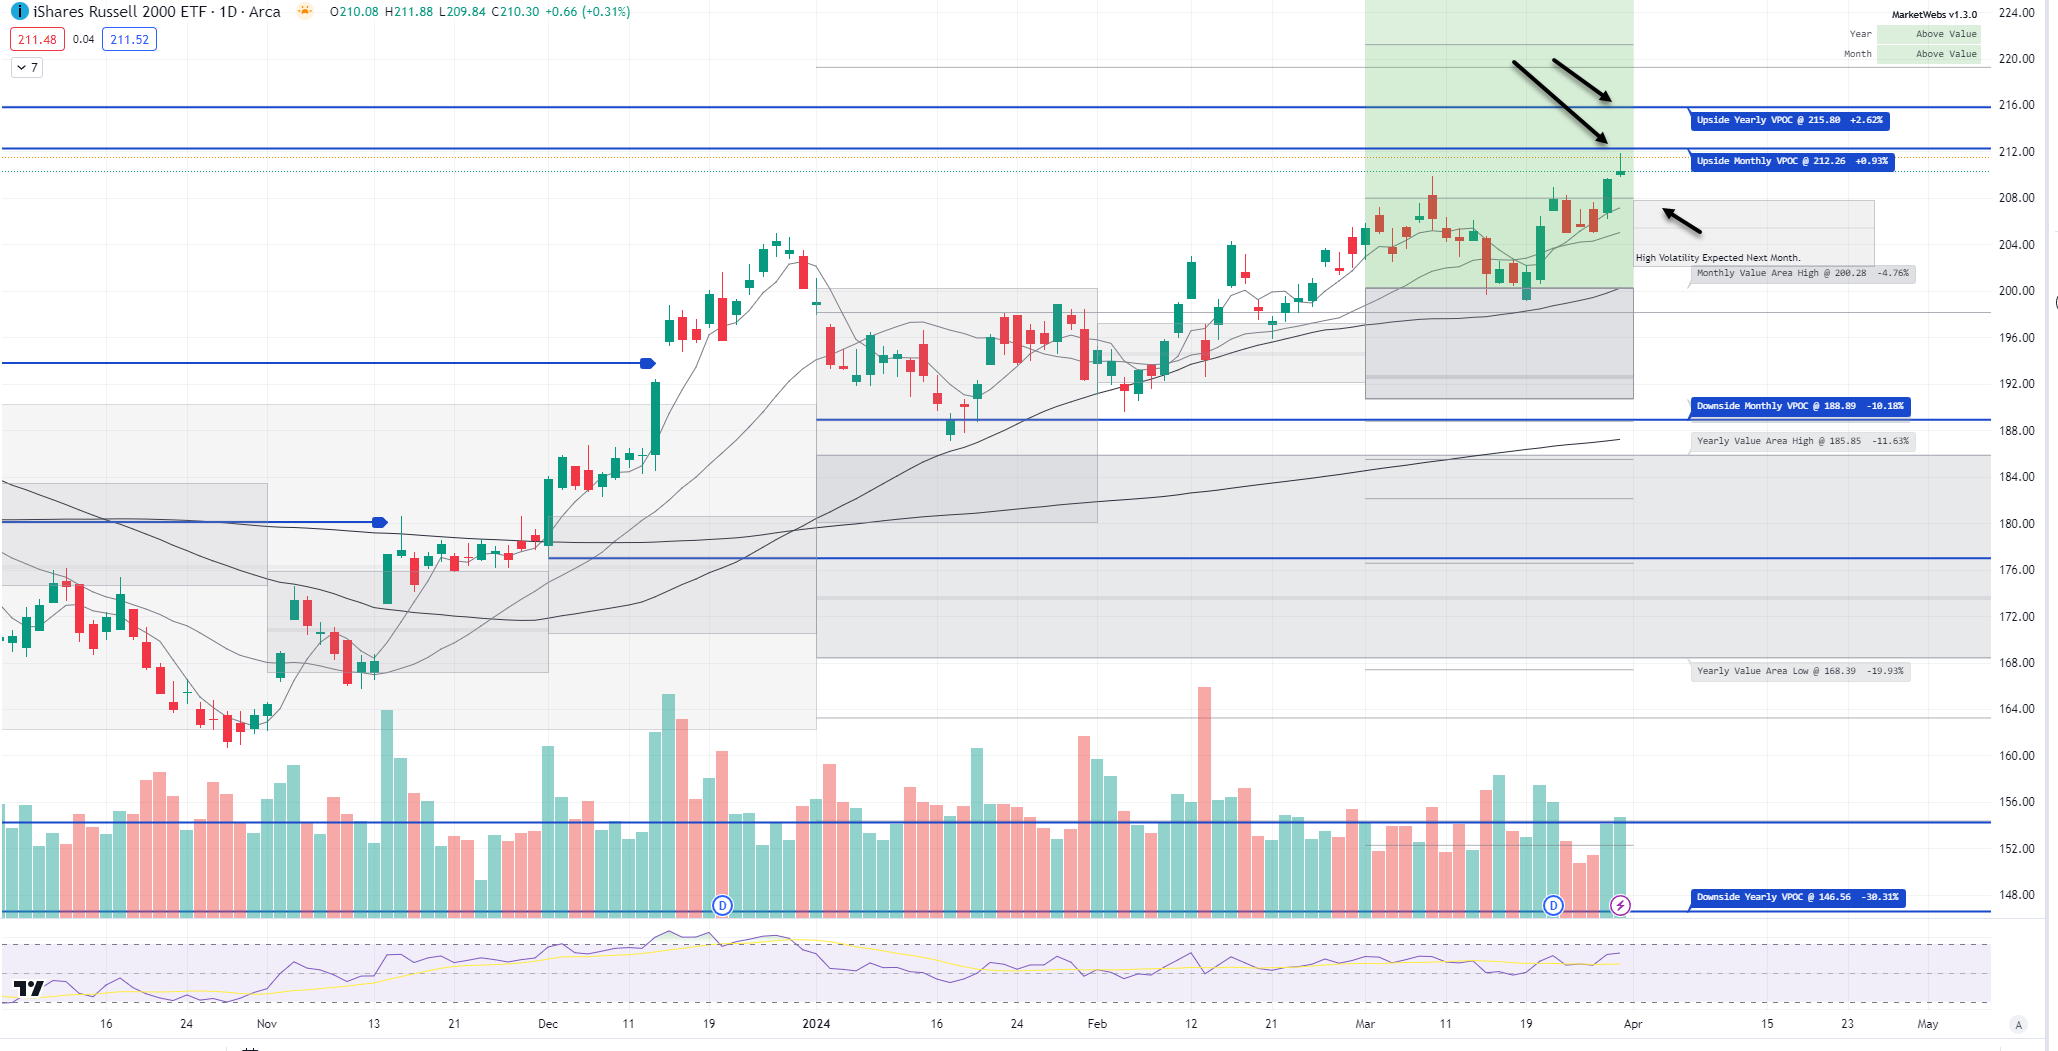
IWM - Russell Small Cap ETF- Price ind. +0.4% so starting the new month outperforming a touch. Price is getting closer to the above VPOCs (blue line), watch $212.26 and next $215.8; support is $207.8
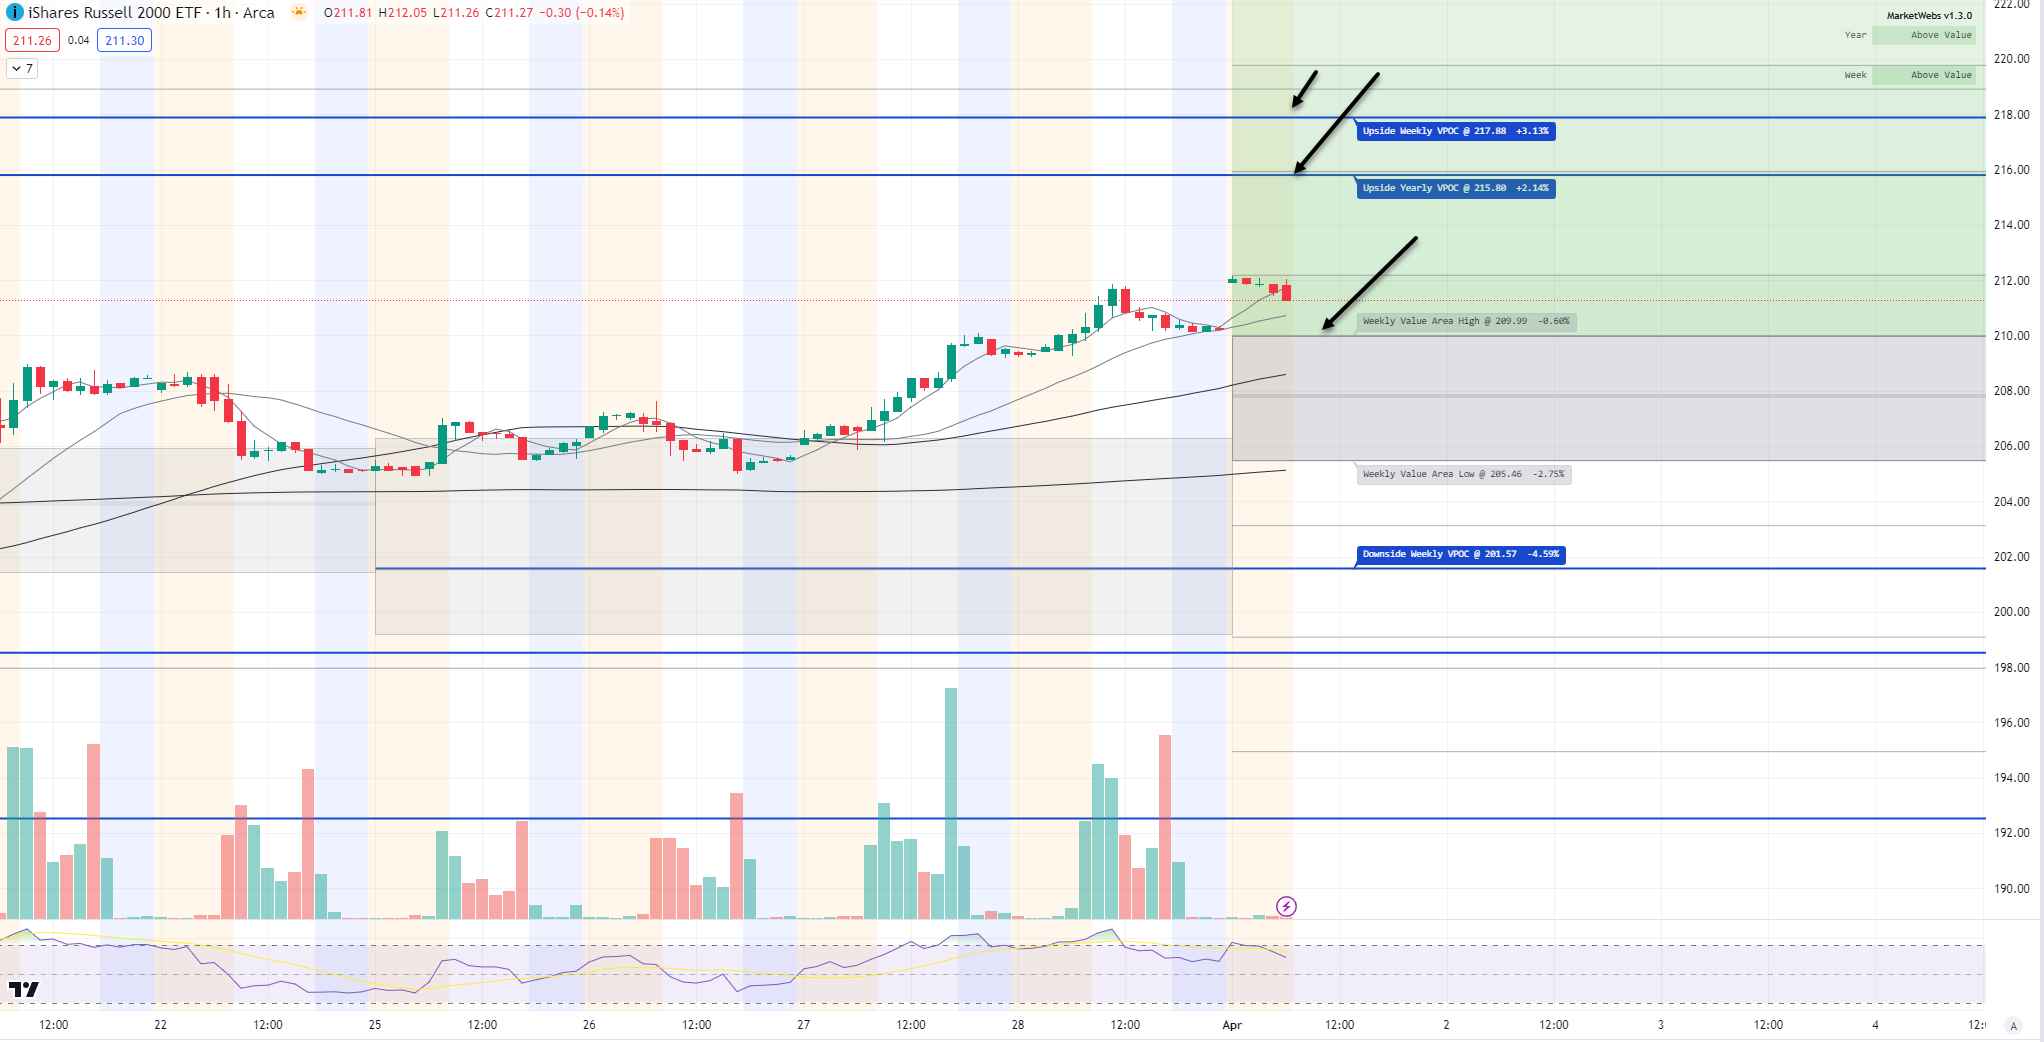
1hr chart: Price starts the new week above its Value Area, support $209.99
Here is today’s TTG Proprietary Stock Screen “Out of the Box” using Volume At Price
names trending above their Value Areas (on 3 multiple timeframes & not super extended)
Keep reading with a 7-day free trial
Subscribe to The Tribeca Trade Group to keep reading this post and get 7 days of free access to the full post archives.