

TTG Index Charts & Out of the Box Stock Screen 4/9/24 $GOOGL
TTG Index Charts & Out of the Box Stock Screen 4/9/24 $GOOGL
Out of the Box MarketWebs Screen
US Dollar -0.1% / 30yr Bonds +0.5% / Crude +0.3% & Nat Gas +1.8% / Gold +0.3% / Copper +0.9% / BTC -1.5%
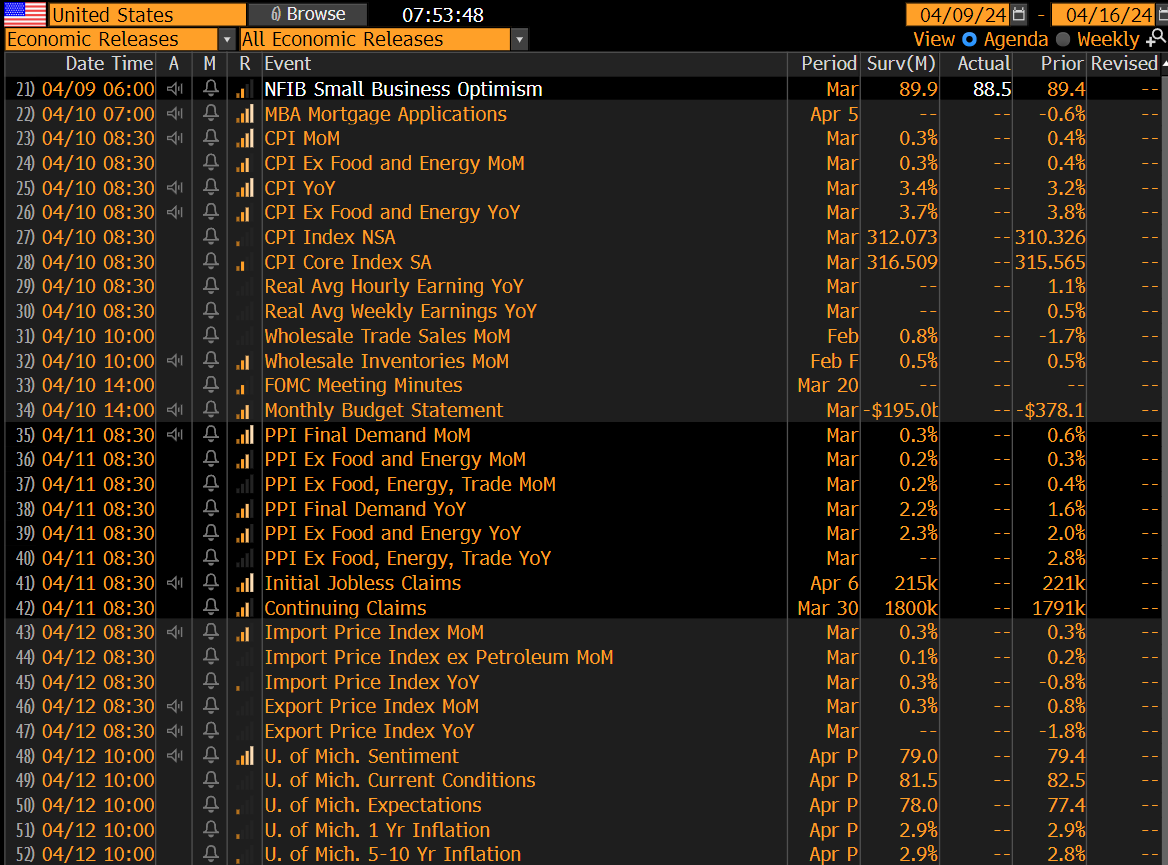
US Upcoming Economics
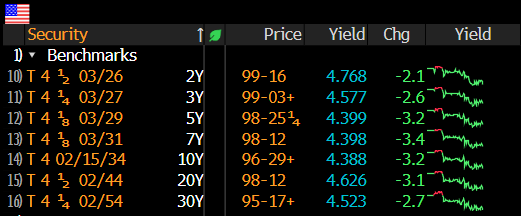
US Bond Yields
Index Updates
At TTG, I use Volume At Price in my chart analysis and I use the MarketWebs Indicator to provide Value Areas & VPOCs which indicate significant support & resistance levels. Learn More Here about Volume At Price and the MarketWebs.
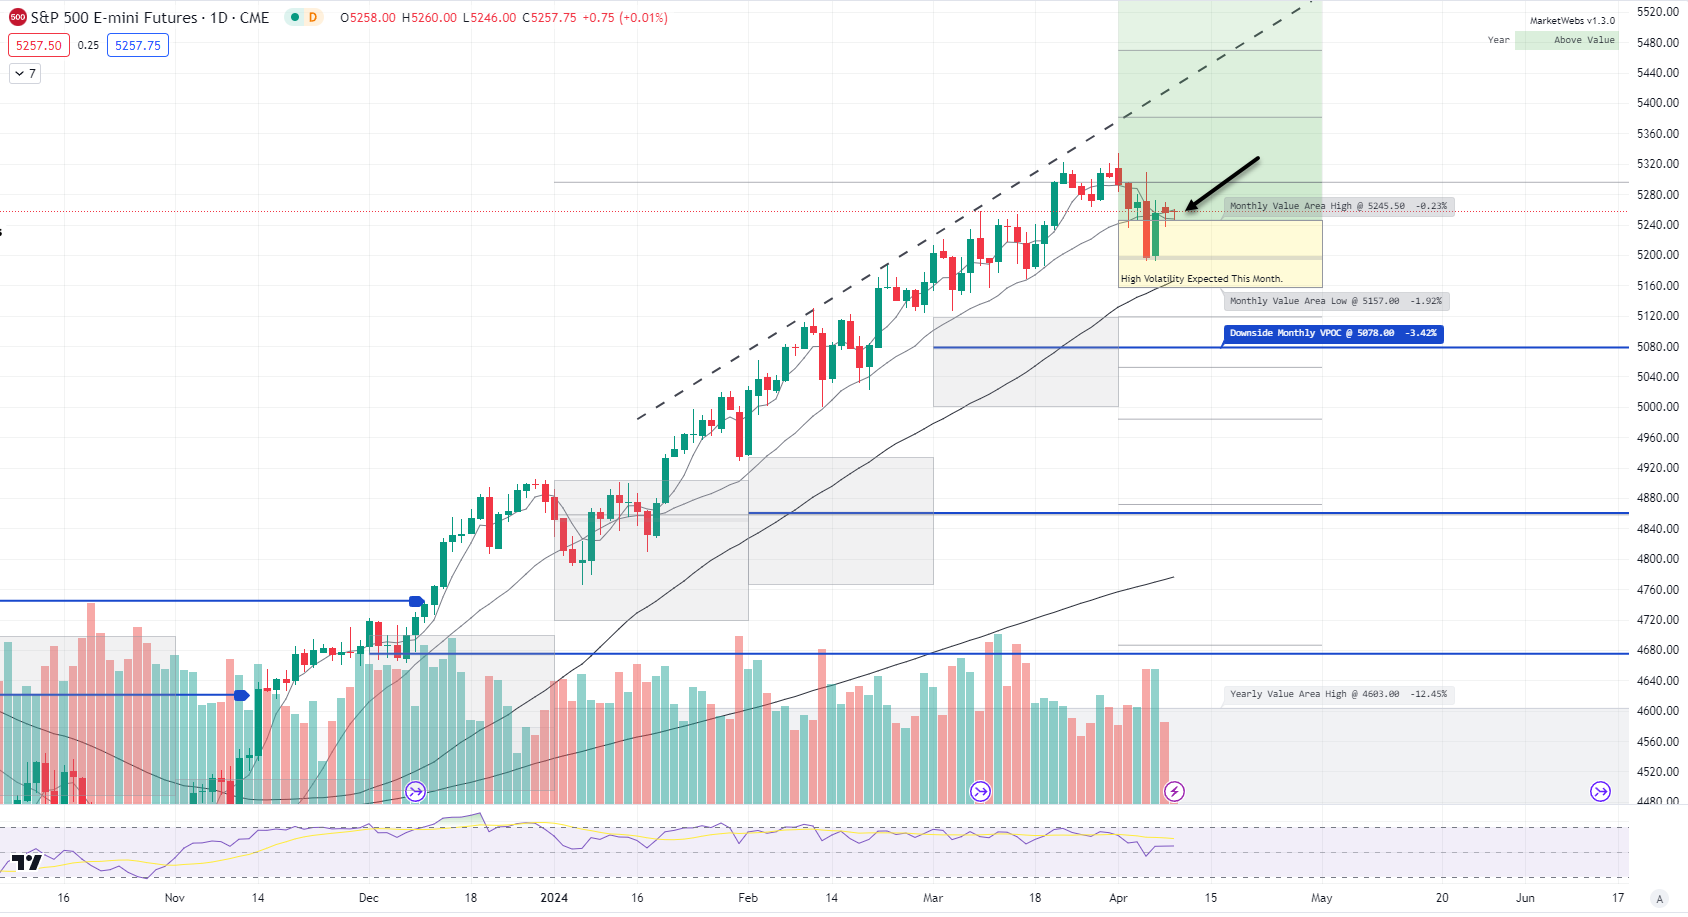
ES_F - SPX Futures - Daily chart: Not much change in the technical picture as prices moved in a very small range yesterday. Still have an important level to watch, 5245.50 is the top of the Apr Value Area and price will need to stay above for higher trending prices to continue.
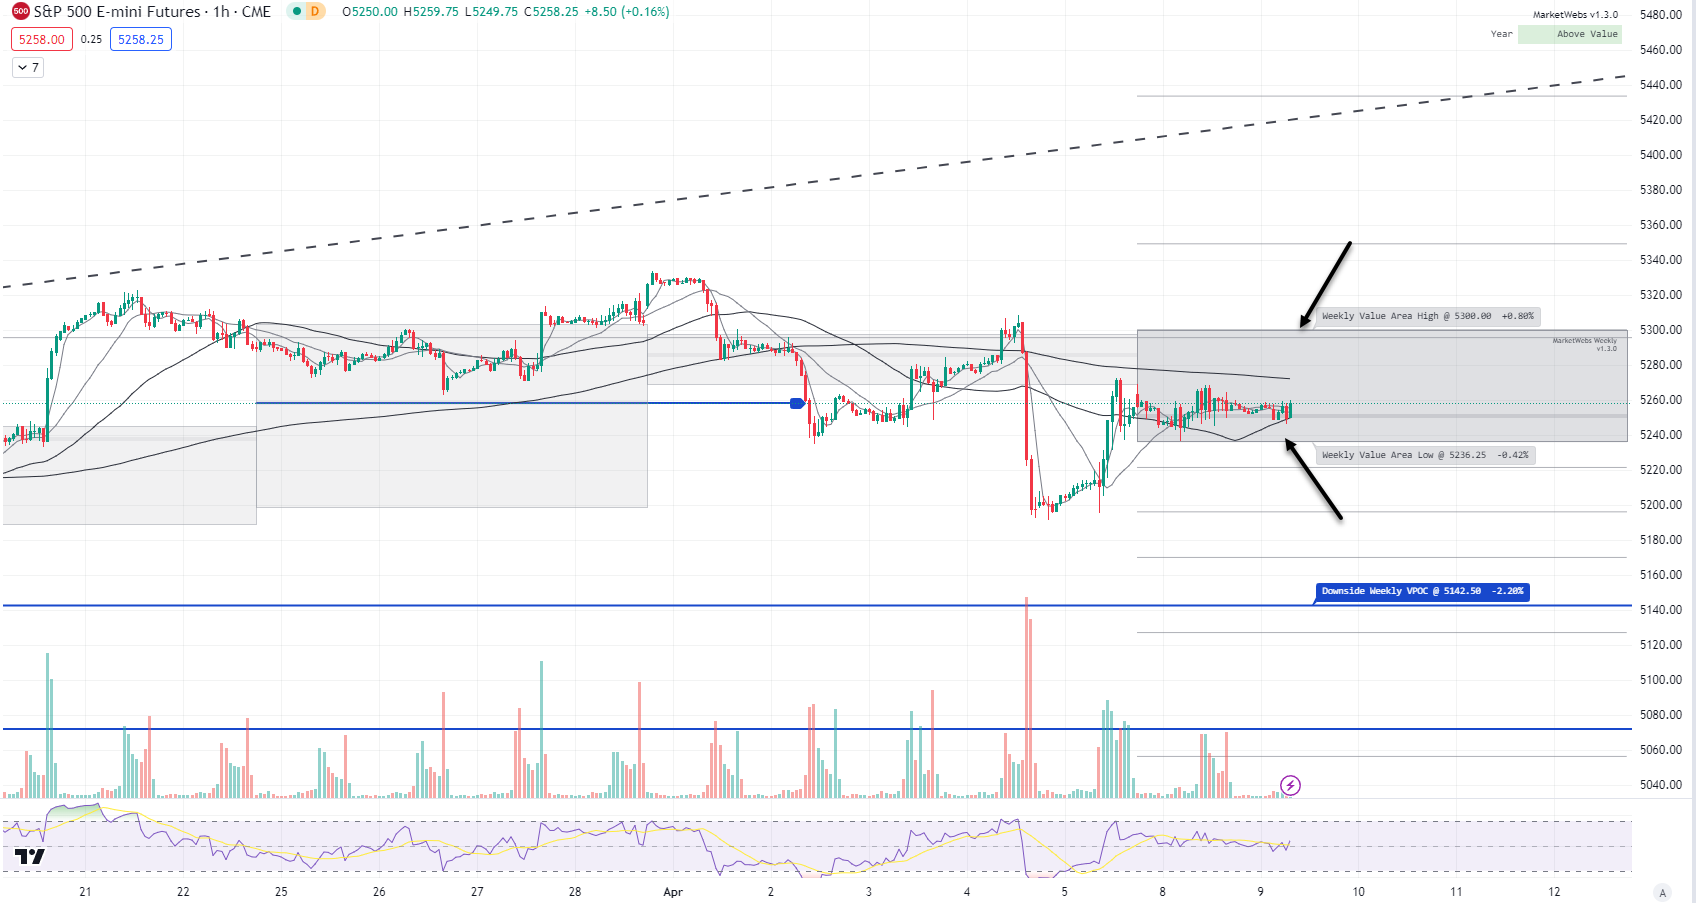
1hr chart: Price starts inside its new Value Area for the week, support level to watch 5236.25 and resistance is 5300
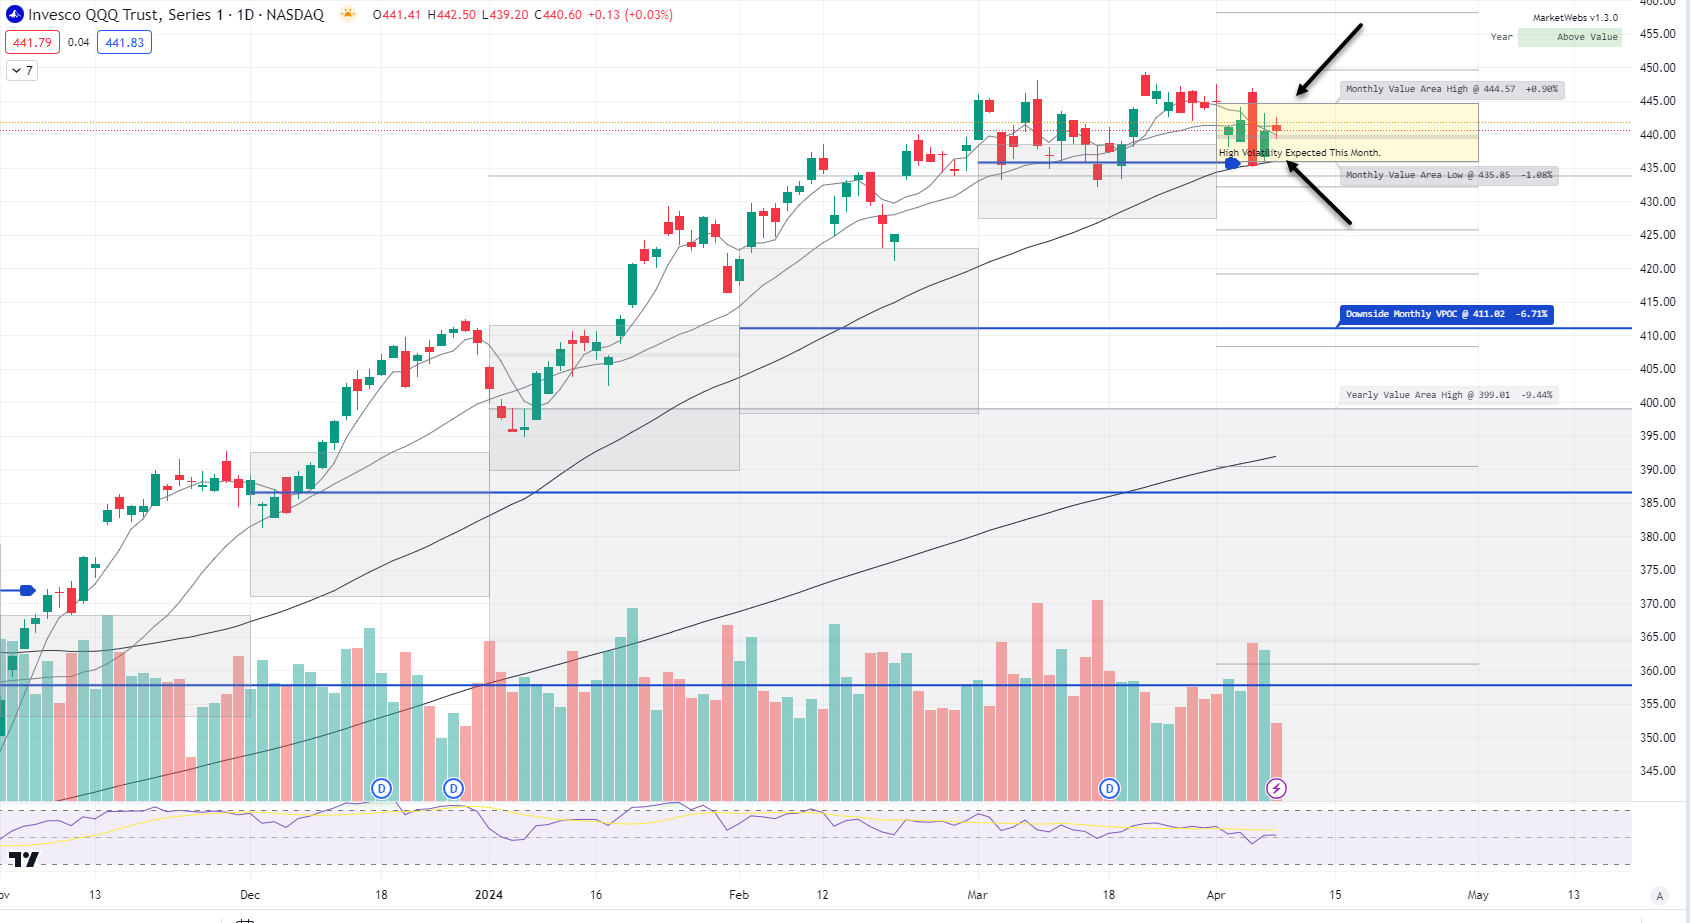
QQQ - NDX 100 ETF - Daily chart: Price ind. +0.25% this morning and is inside its April Value Area, support to watch is $435.85, resistance $444.57
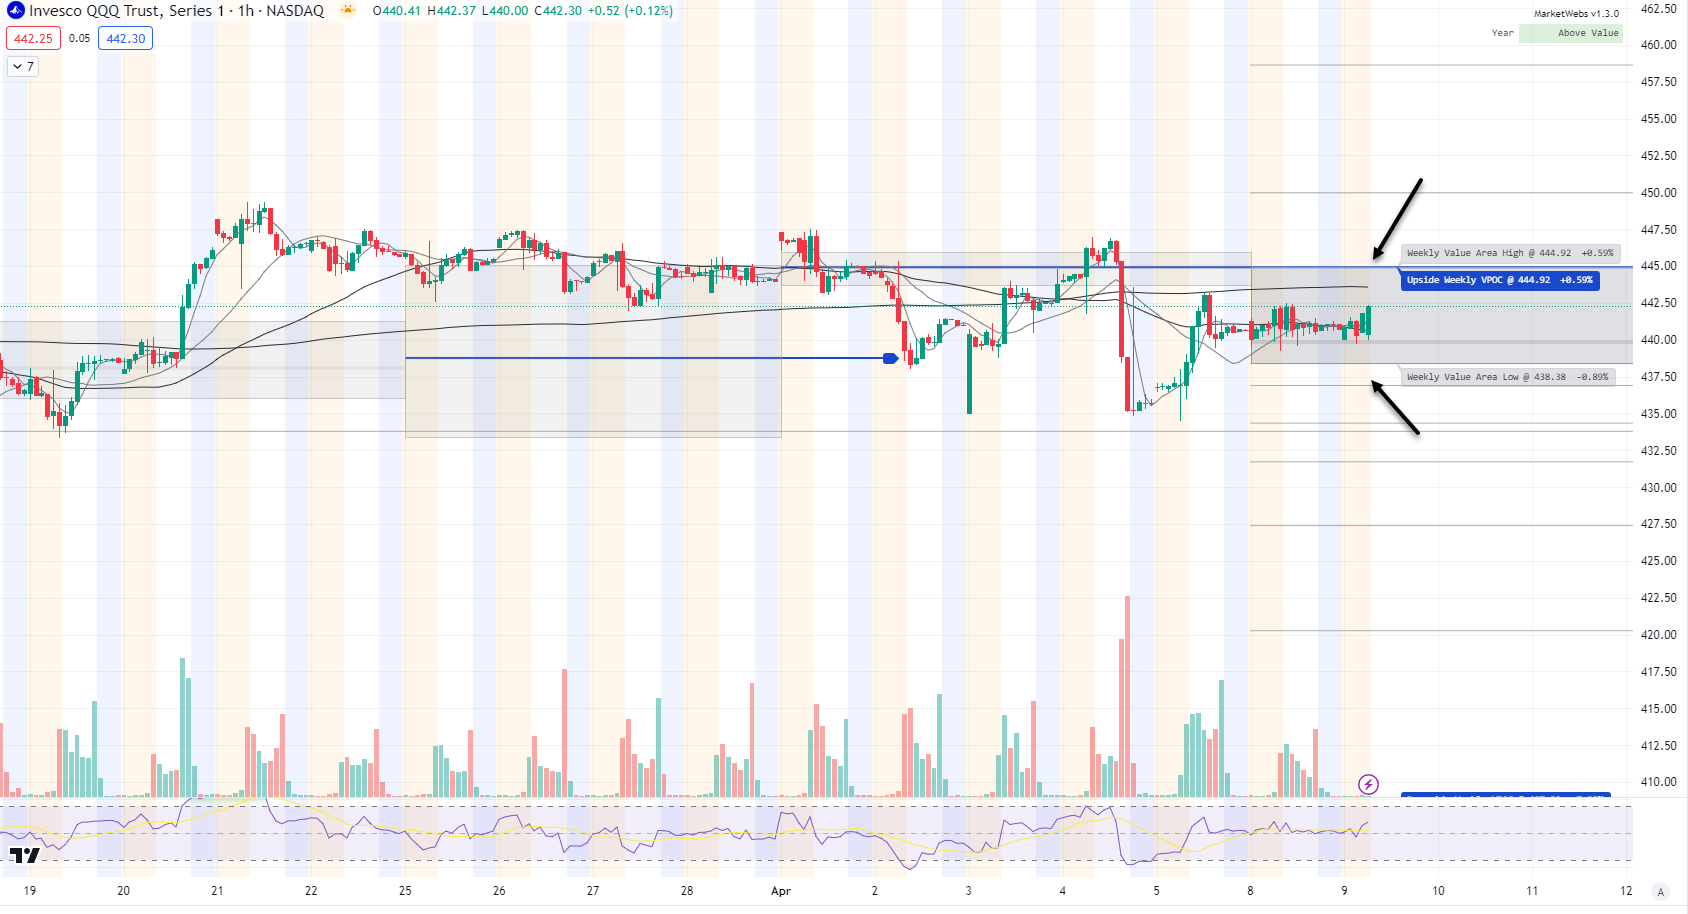
1hr chart: Price remains inside its Value Area for the week, support to watch $438.38 and resistance $444.92
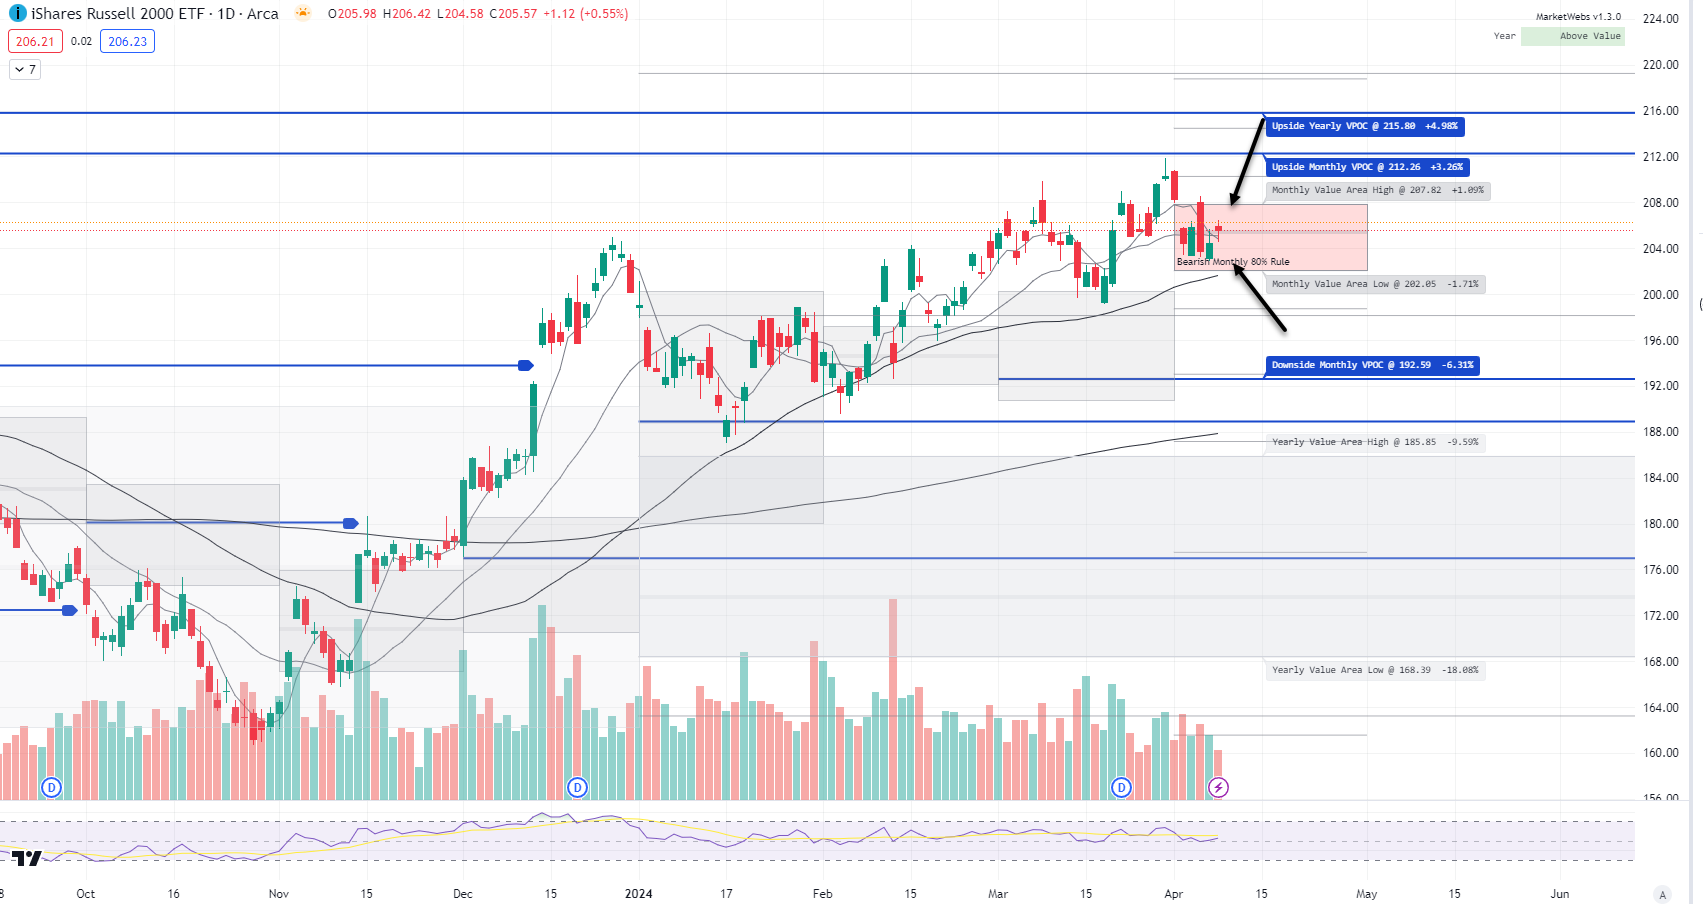
IWM - Russell Small Cap ETF- Price ind. +0.3% to start Tuesday and similar to the QQQ , inside its Value Area for the month; support to watch is $202.05 bottom of Apr Value Area & resistance $207.82 top of Value
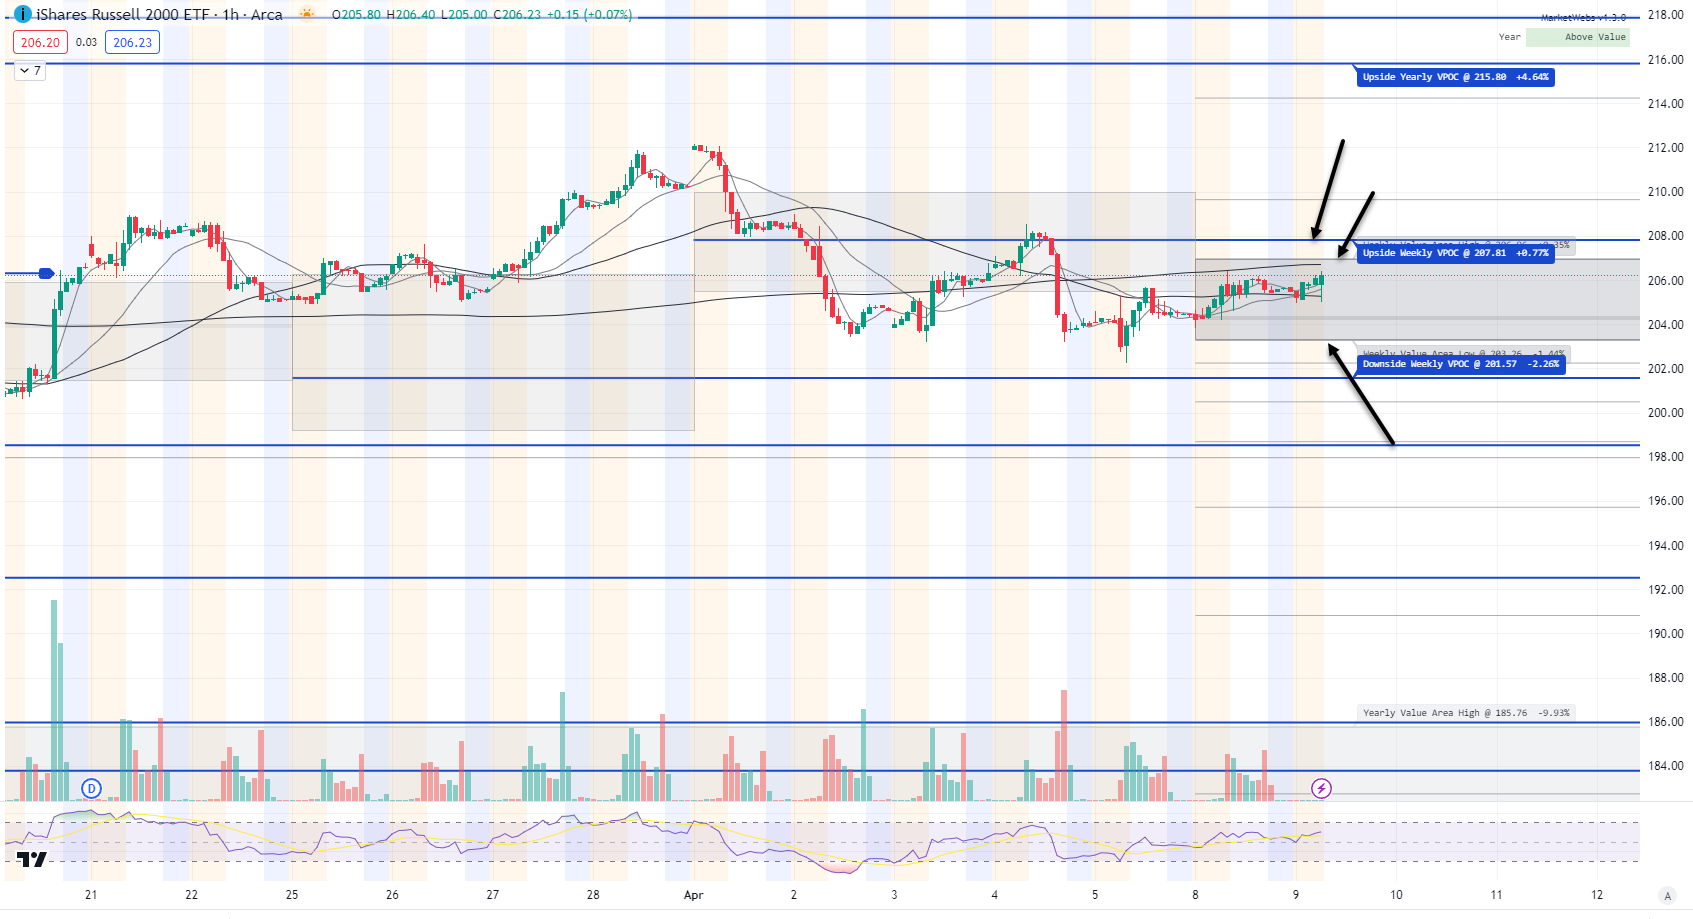
1hr chart: Price remains inside its Value Area for the week support to watch $203.26 & resistance $206.96, also note the VPOCs nearby (blue lines).
Here is today’s TTG Proprietary Stock Screen “Out of the Box” using Volume At Price
names trending above their Value Areas (on 3 multiple timeframes & not super extended)
Keep reading with a 7-day free trial
Subscribe to The Tribeca Trade Group to keep reading this post and get 7 days of free access to the full post archives.