

TTG Index Charts & Out of the Box Stock Screen 01/25/24 $PSX
TTG Index Charts & Out of the Box Stock Screen 01/25/24 $PSX
Out of the Box MarketWebs Screen
US Dollar -0.1% / 30yr Bonds +0.3% / Crude +1.1% & Nat Gas +5.9% / Gold +0.1% / Copper -0.3% / BTC +0.4%
US Upcoming Economics

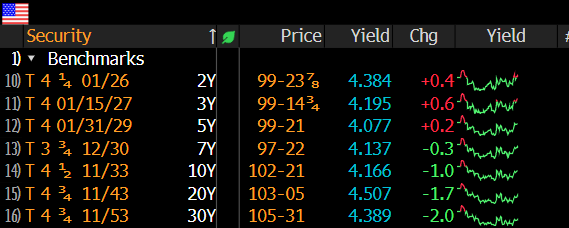
US Bond Yields
Index Updates
At TTG, I use Volume At Price in my chart analysis and I use the MarketWebs Indicator to provide Value Areas & VPOCs which indicate significant support & resistance levels. Learn More Here about Volume At Price and the MarketWebs.
$ES_F- S&P Futures - Ugly reversal yesterday as bond yields gained after a poor 5yr auction. Even after reversal, price is still holding its 5d MA (Moving Average), and that is what I am watching to see if price can maintain above this short term MA to hold the short term trend
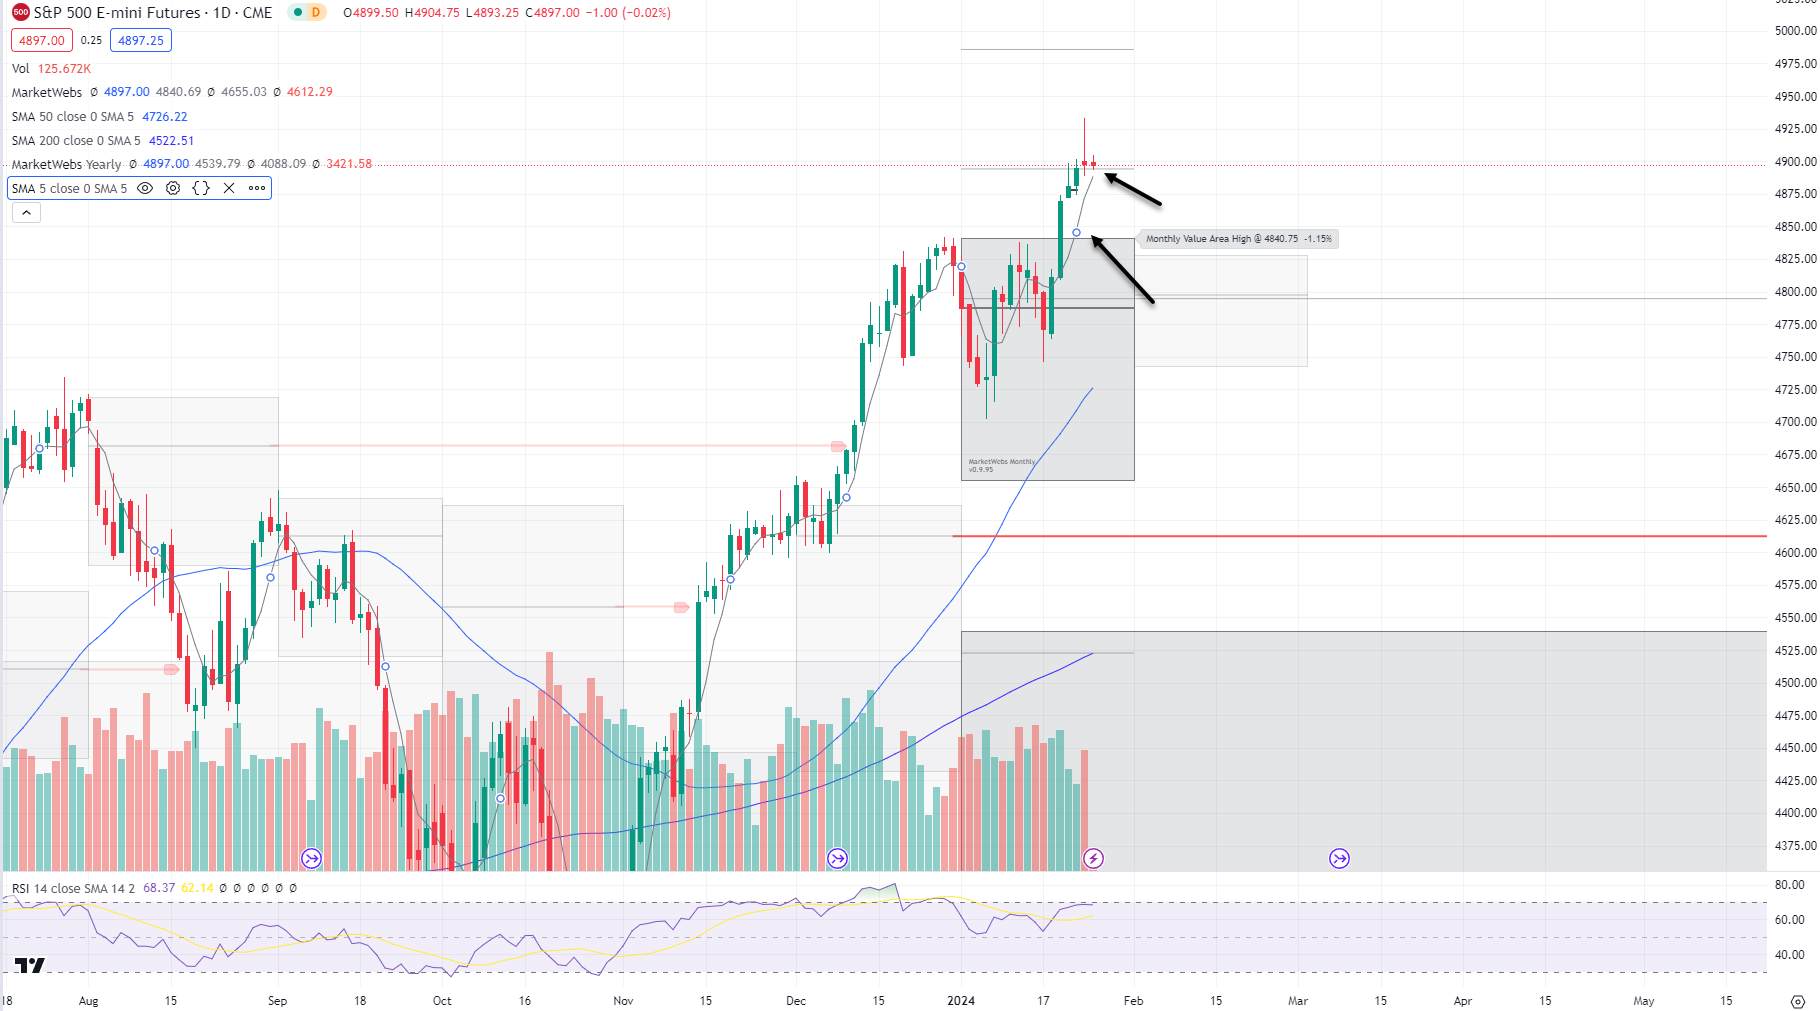
1hr chart: Price still decently above its Value Area for week, support down at 4821
QQQ - NDX 100 ETF - Daily chart: Price ind. +0.2% this morning and similar to the S&P after a toppy looking candle yesterday, price is still above its 5d MA & I am watching to see if price can stay above this short term MA
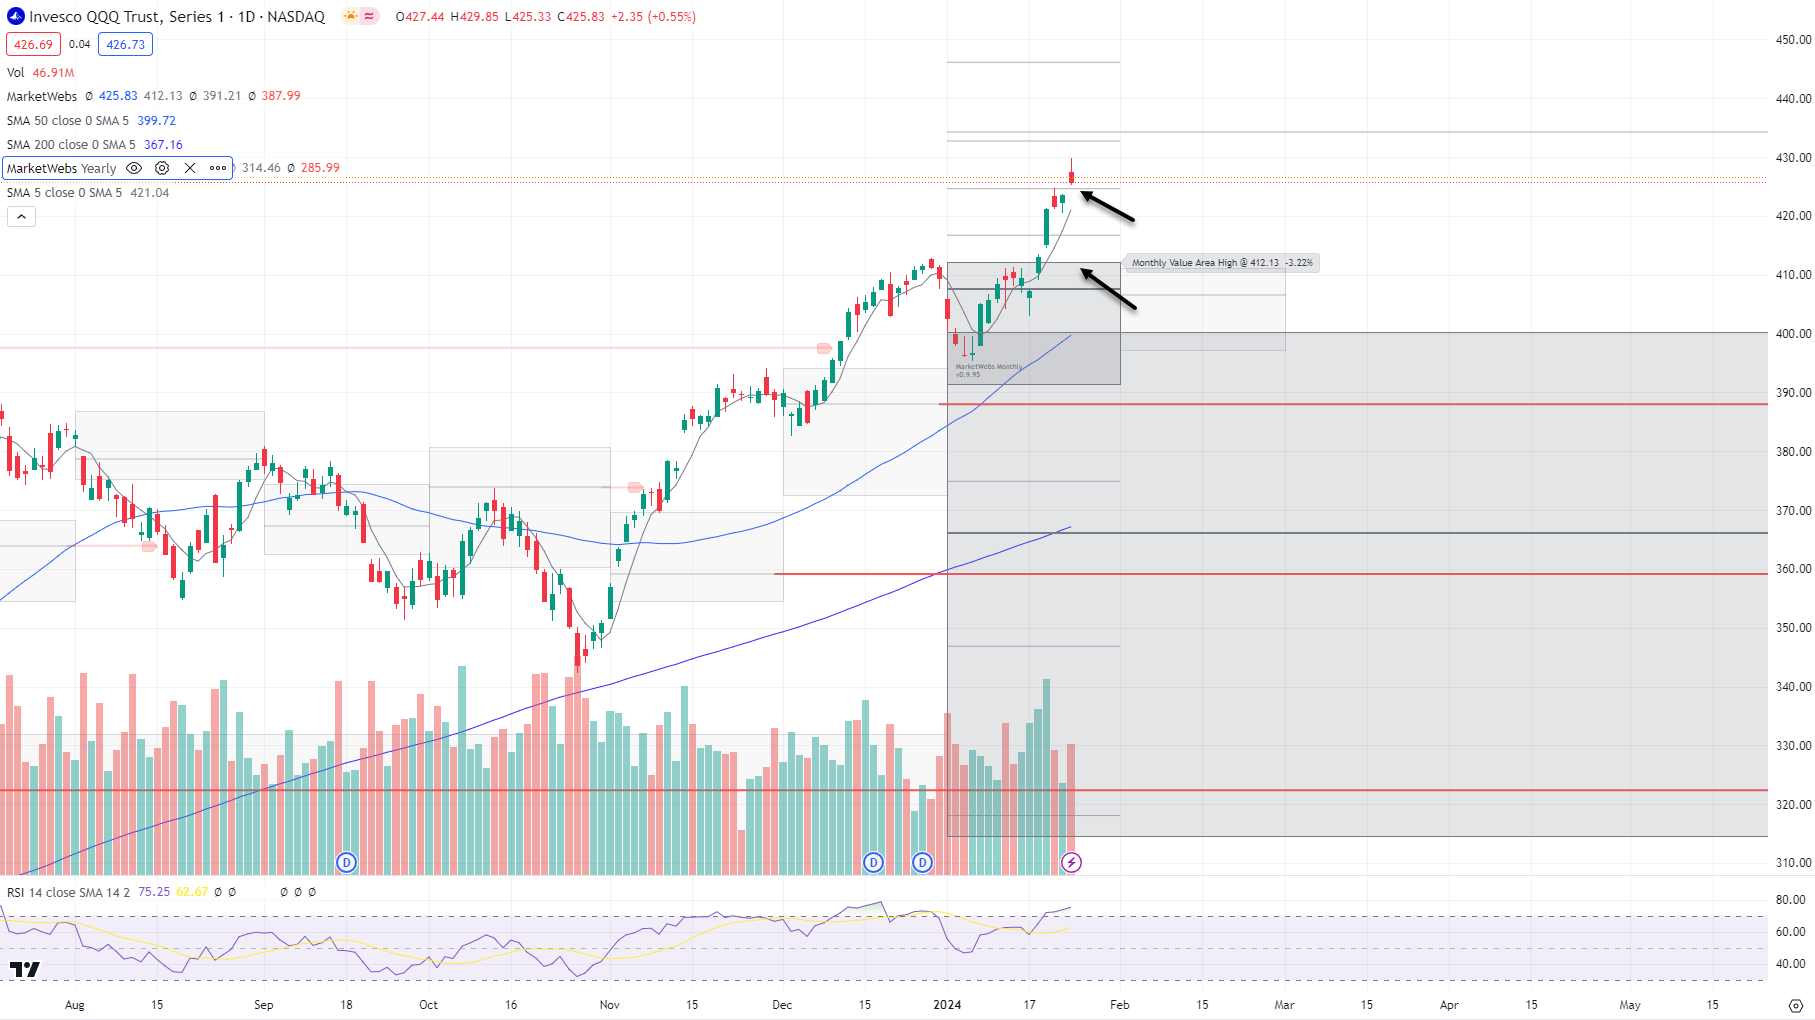
1hr chart: Price still trending above its Value Area for the week

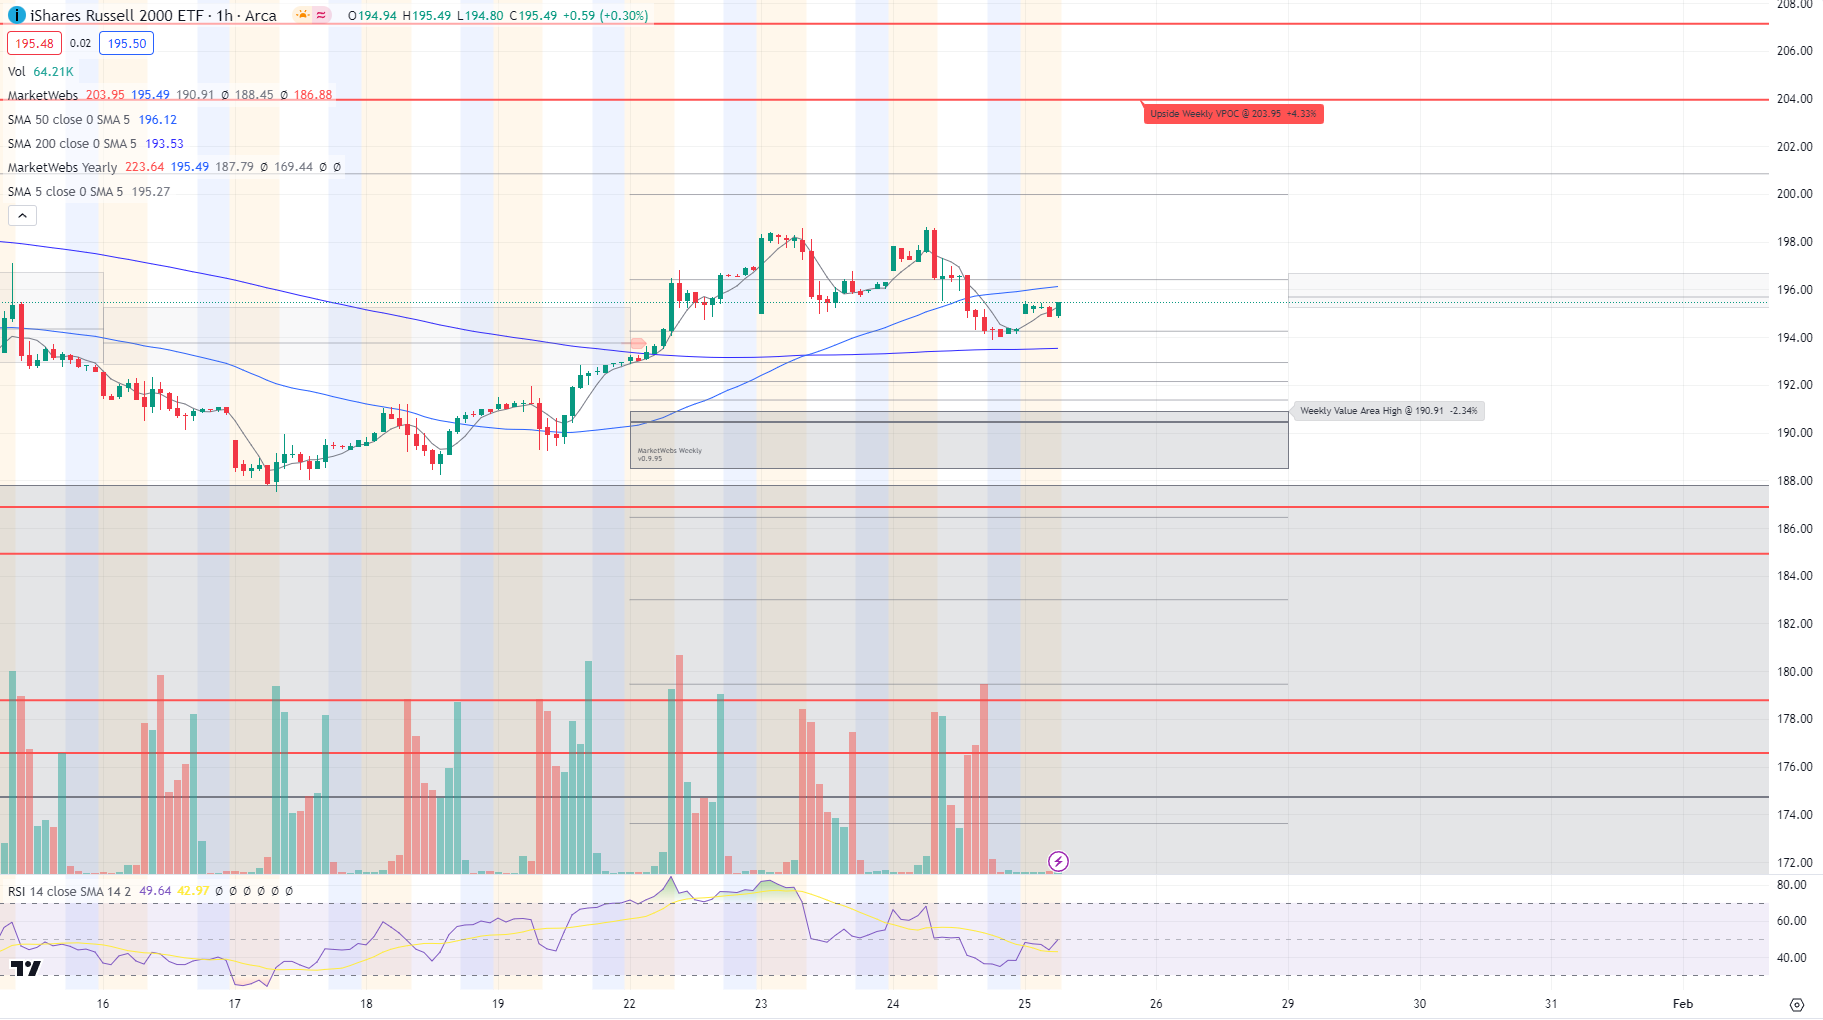
IWM - Russell Small Cap ETF- After an ugly reversal yesterday (price fell 2% from the open) , price is bouncing this morning, ind +0.5%. I would continue to watch interest rates for clues regarding the direction Small Caps. For now, price remains inside its Value Area for the month
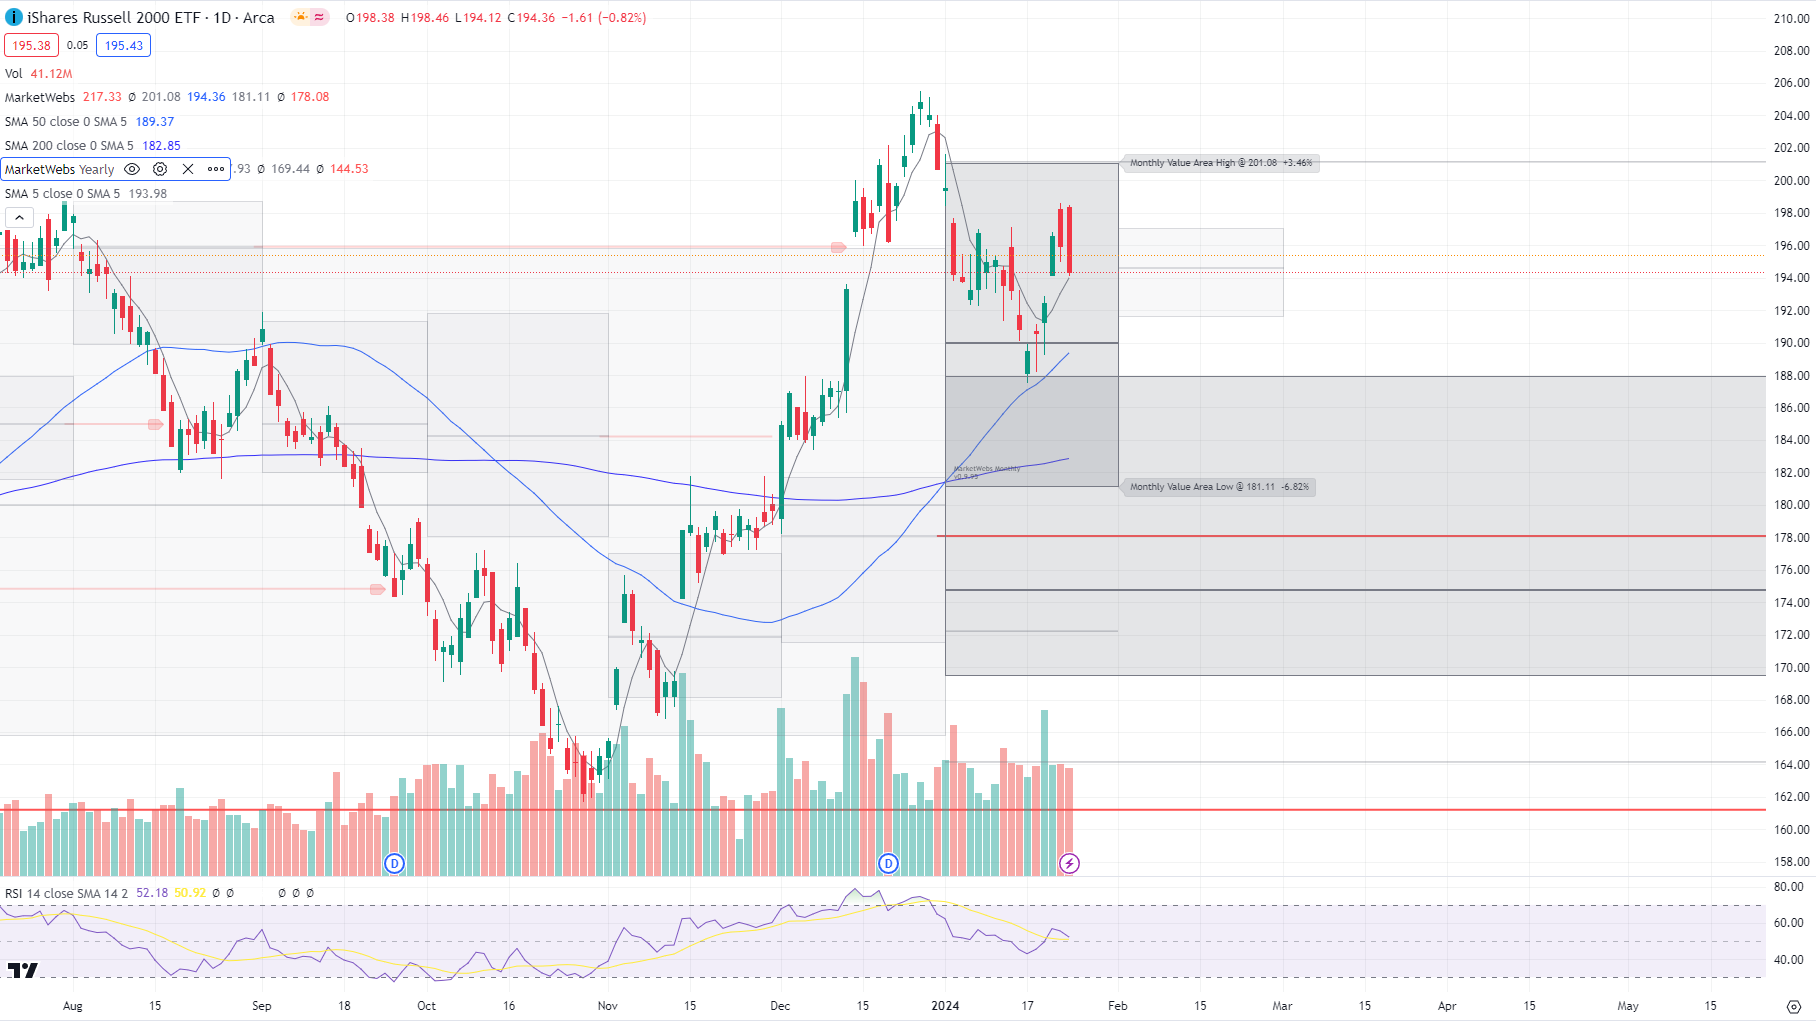
1hr chart: Price sideways for week, but still above its Value Area for the week
Here is today’s TTG Proprietary Stock Screen “Out of the Box” using Volume At Price
names trending above their Value Areas (on 3 multiple timeframes & not super extended)
Keep reading with a 7-day free trial
Subscribe to The Tribeca Trade Group to keep reading this post and get 7 days of free access to the full post archives.