

TTG Index Charts & Out of the Box Stock Screen 01/17/24 $SYK
TTG Index Charts & Out of the Box Stock Screen 01/17/24 $SYK
Out of the Box MarketWebs Screen
US Dollar +0.1% / 30yr Bonds flat / Crude -2.0% & Nat Gas -2.7% / Gold -0.1% / Copper -0.3% / BTC -1.3%
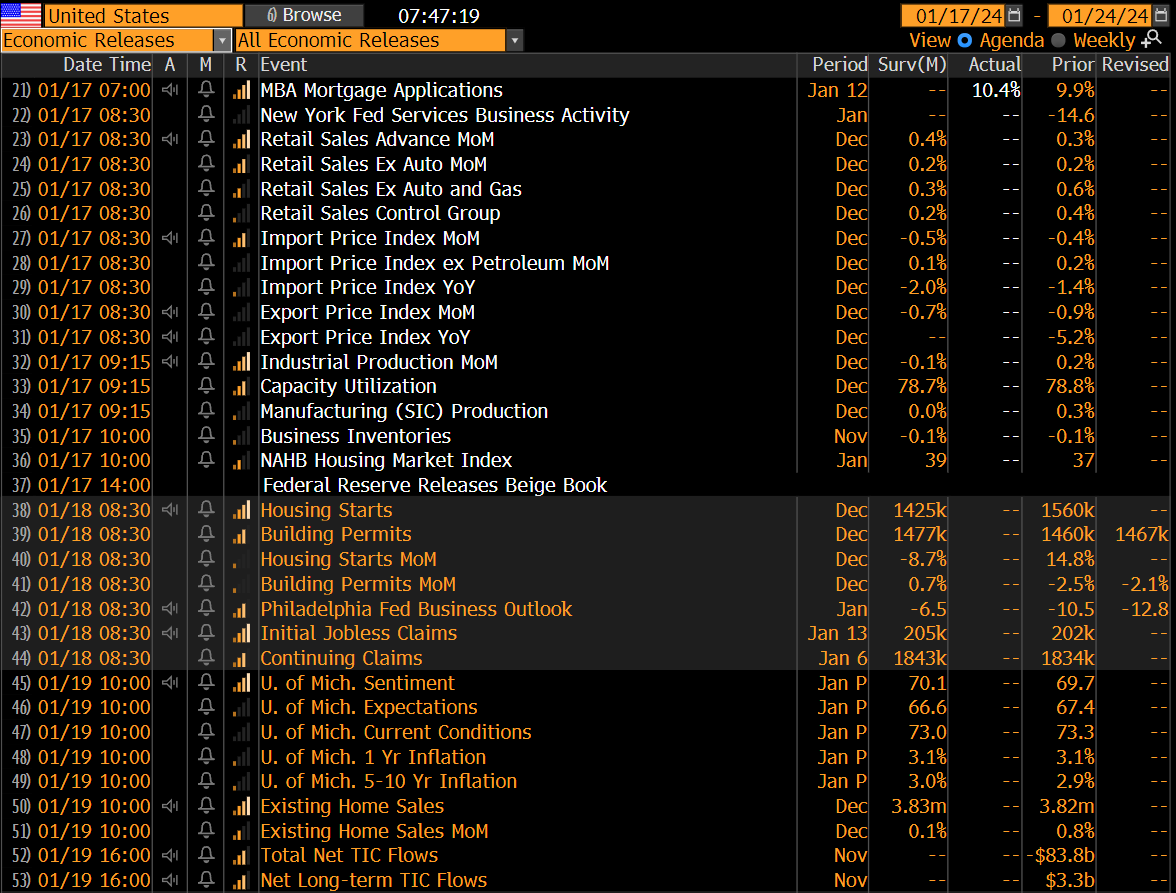
US Upcoming Economics
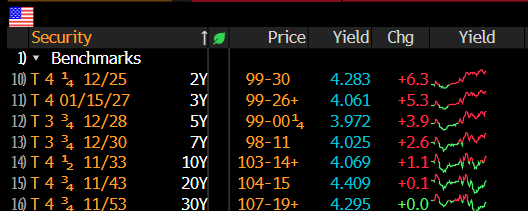
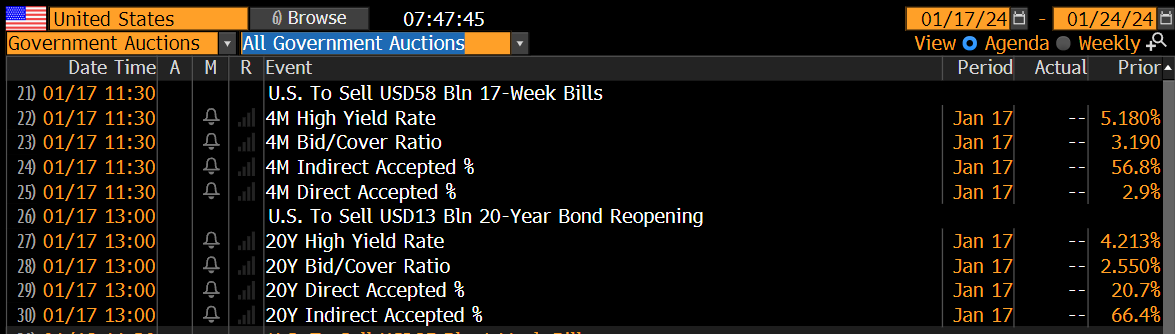
US Bond Yields & Auction Schedule
Index Updates
At TTG, I use Volume At Price in my chart analysis and I use the MarketWebs Indicator to provide Value Areas & VPOCs which indicate significant support & resistance levels. Learn More Here about Volume At Price and the MarketWebs.
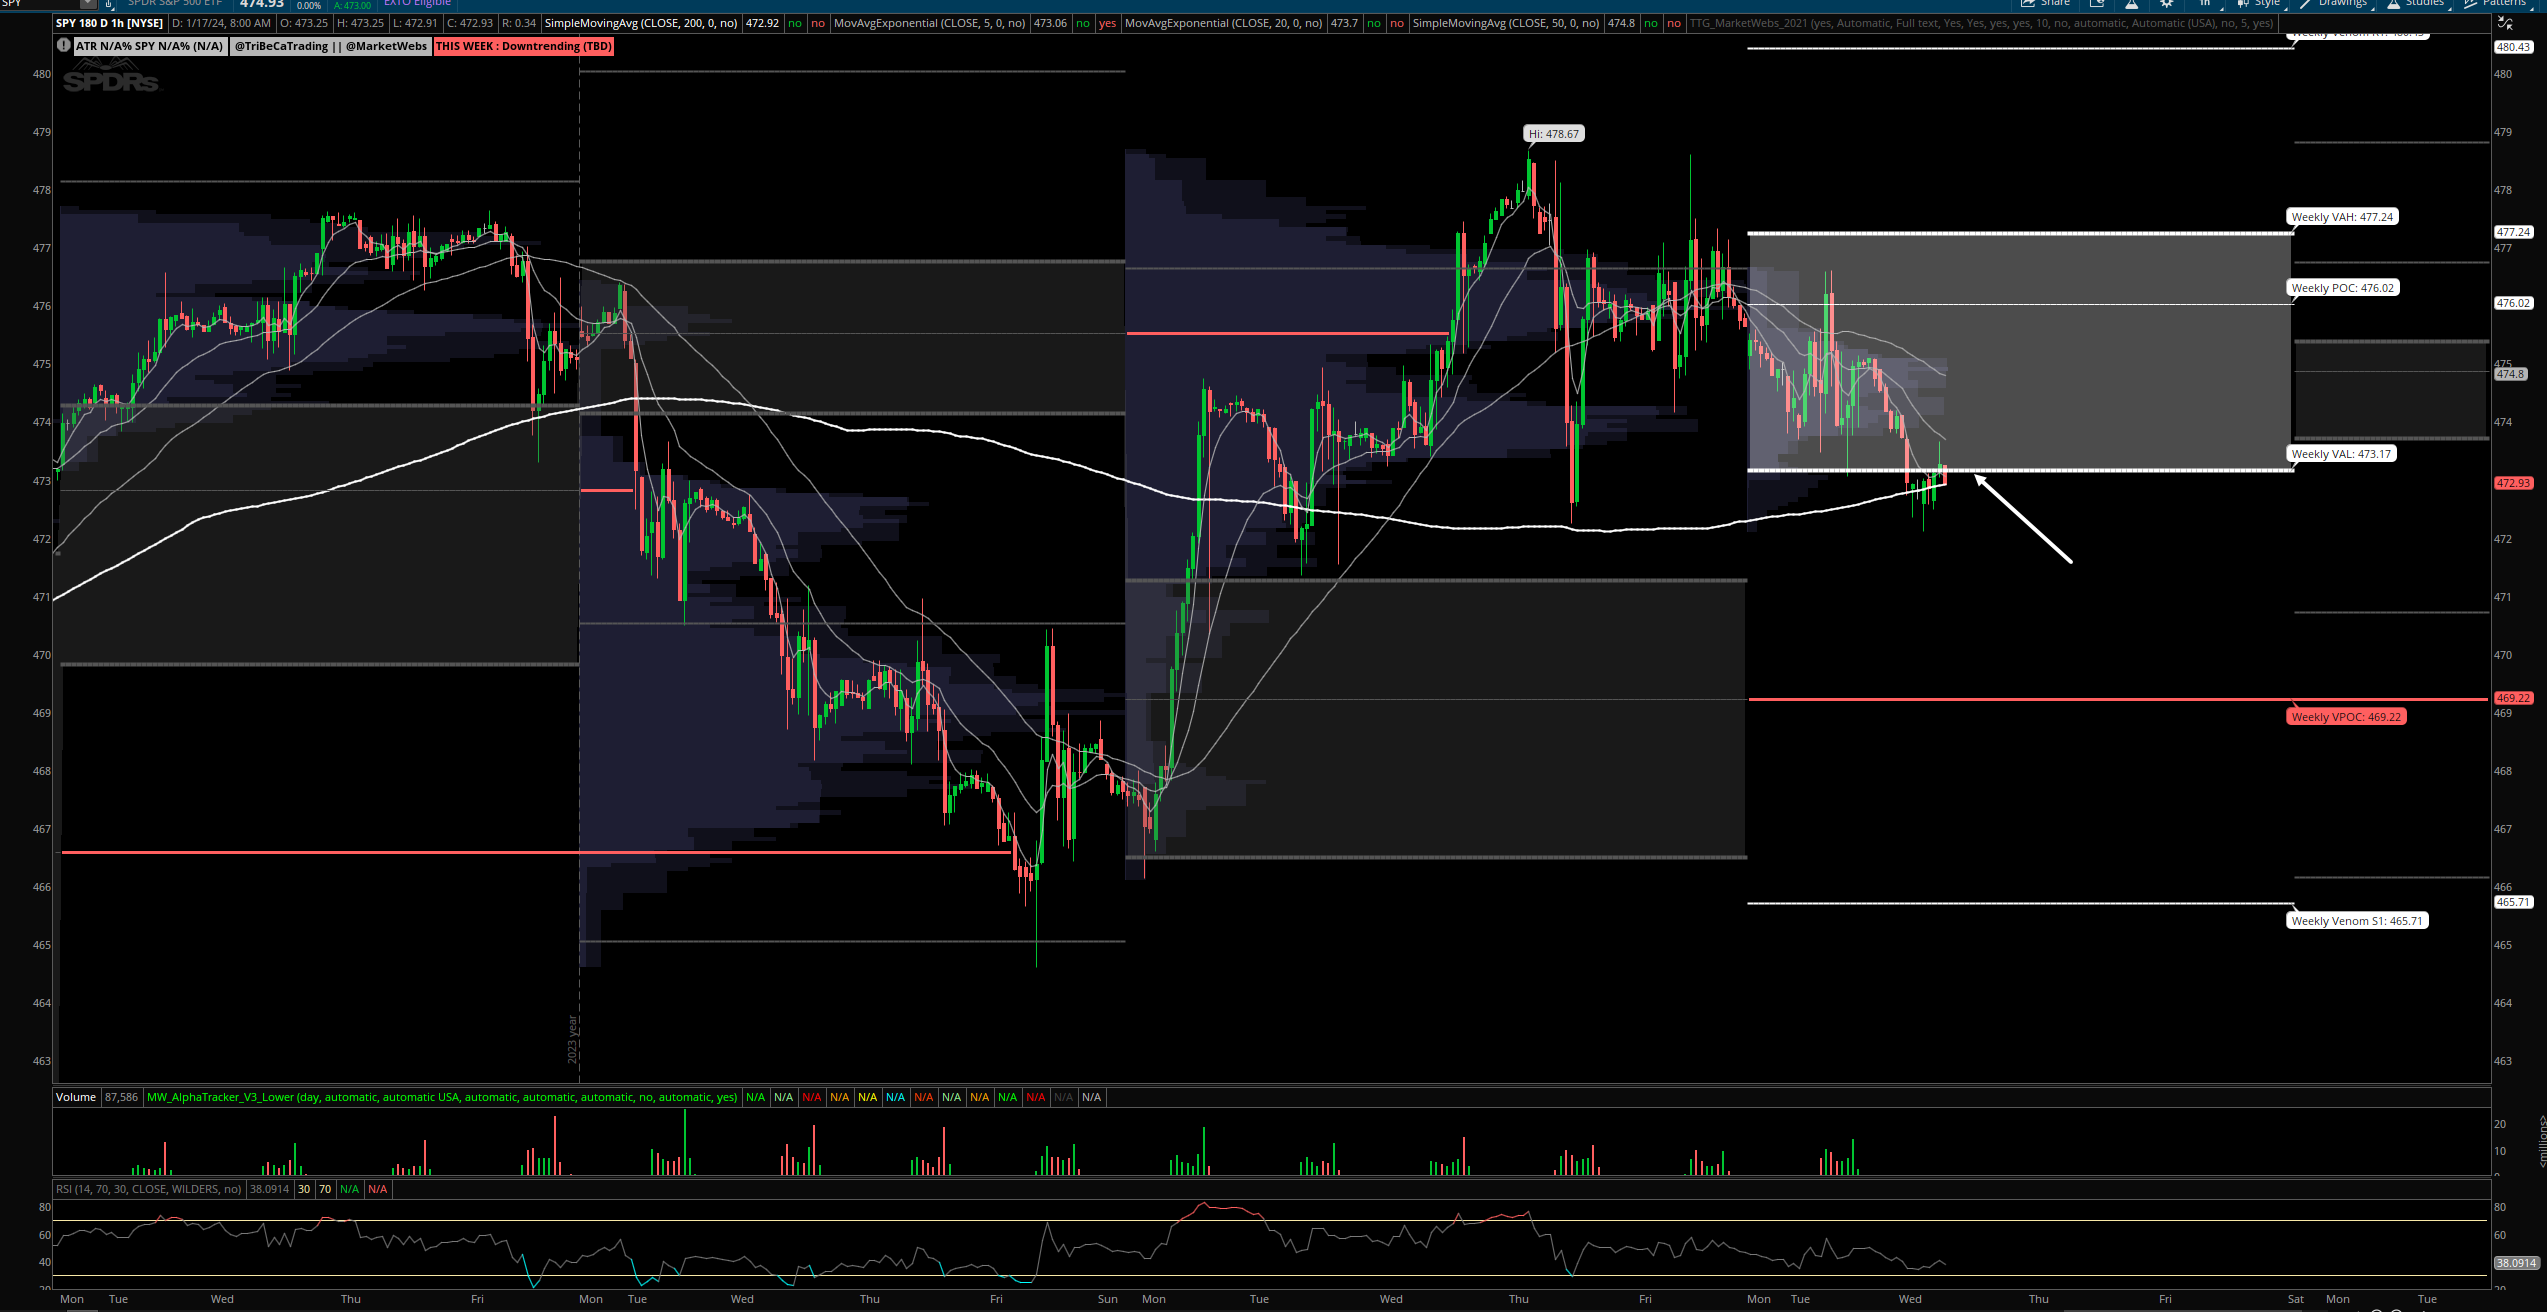
SPY- S&P ETF - Price ind -0.3%, more weakness in after hours market with China particularly weak, Hang Seng -3.7%. Price remains inside the Jan Value Area, upside level to watch here is $477.4 and downside I am watching the 20d MA
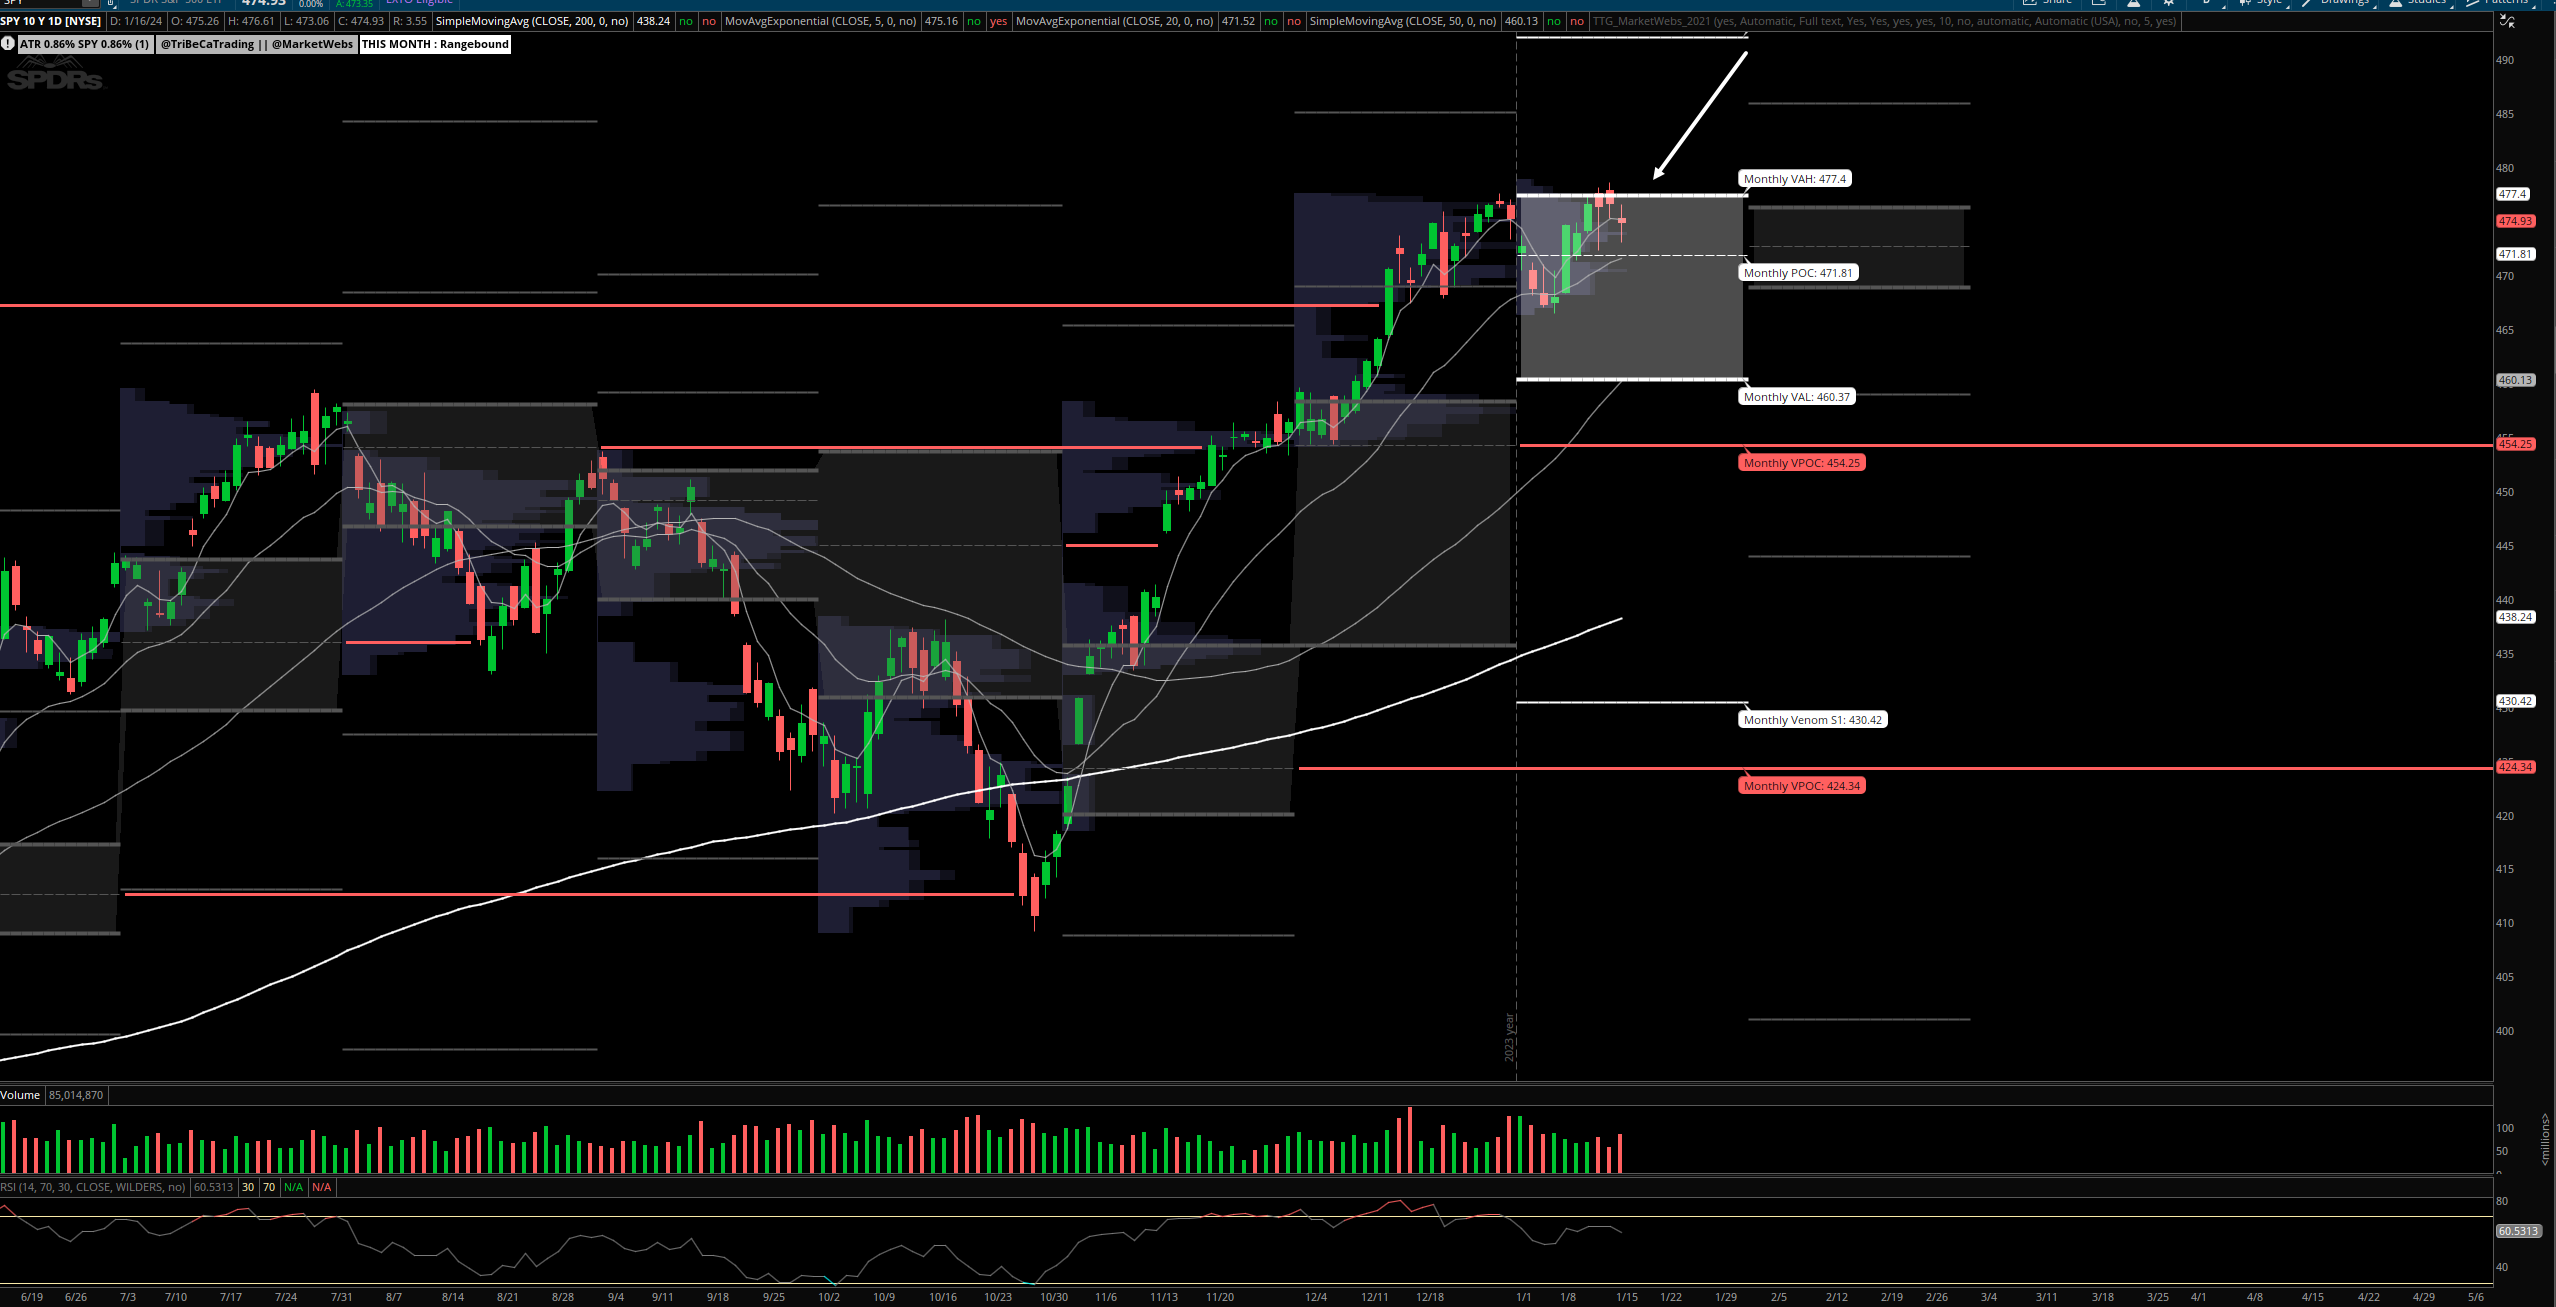
1hr chart: Price trying to hang onto this week's Value Area, level to watch here is $473.17 and that will be an important level to watch today
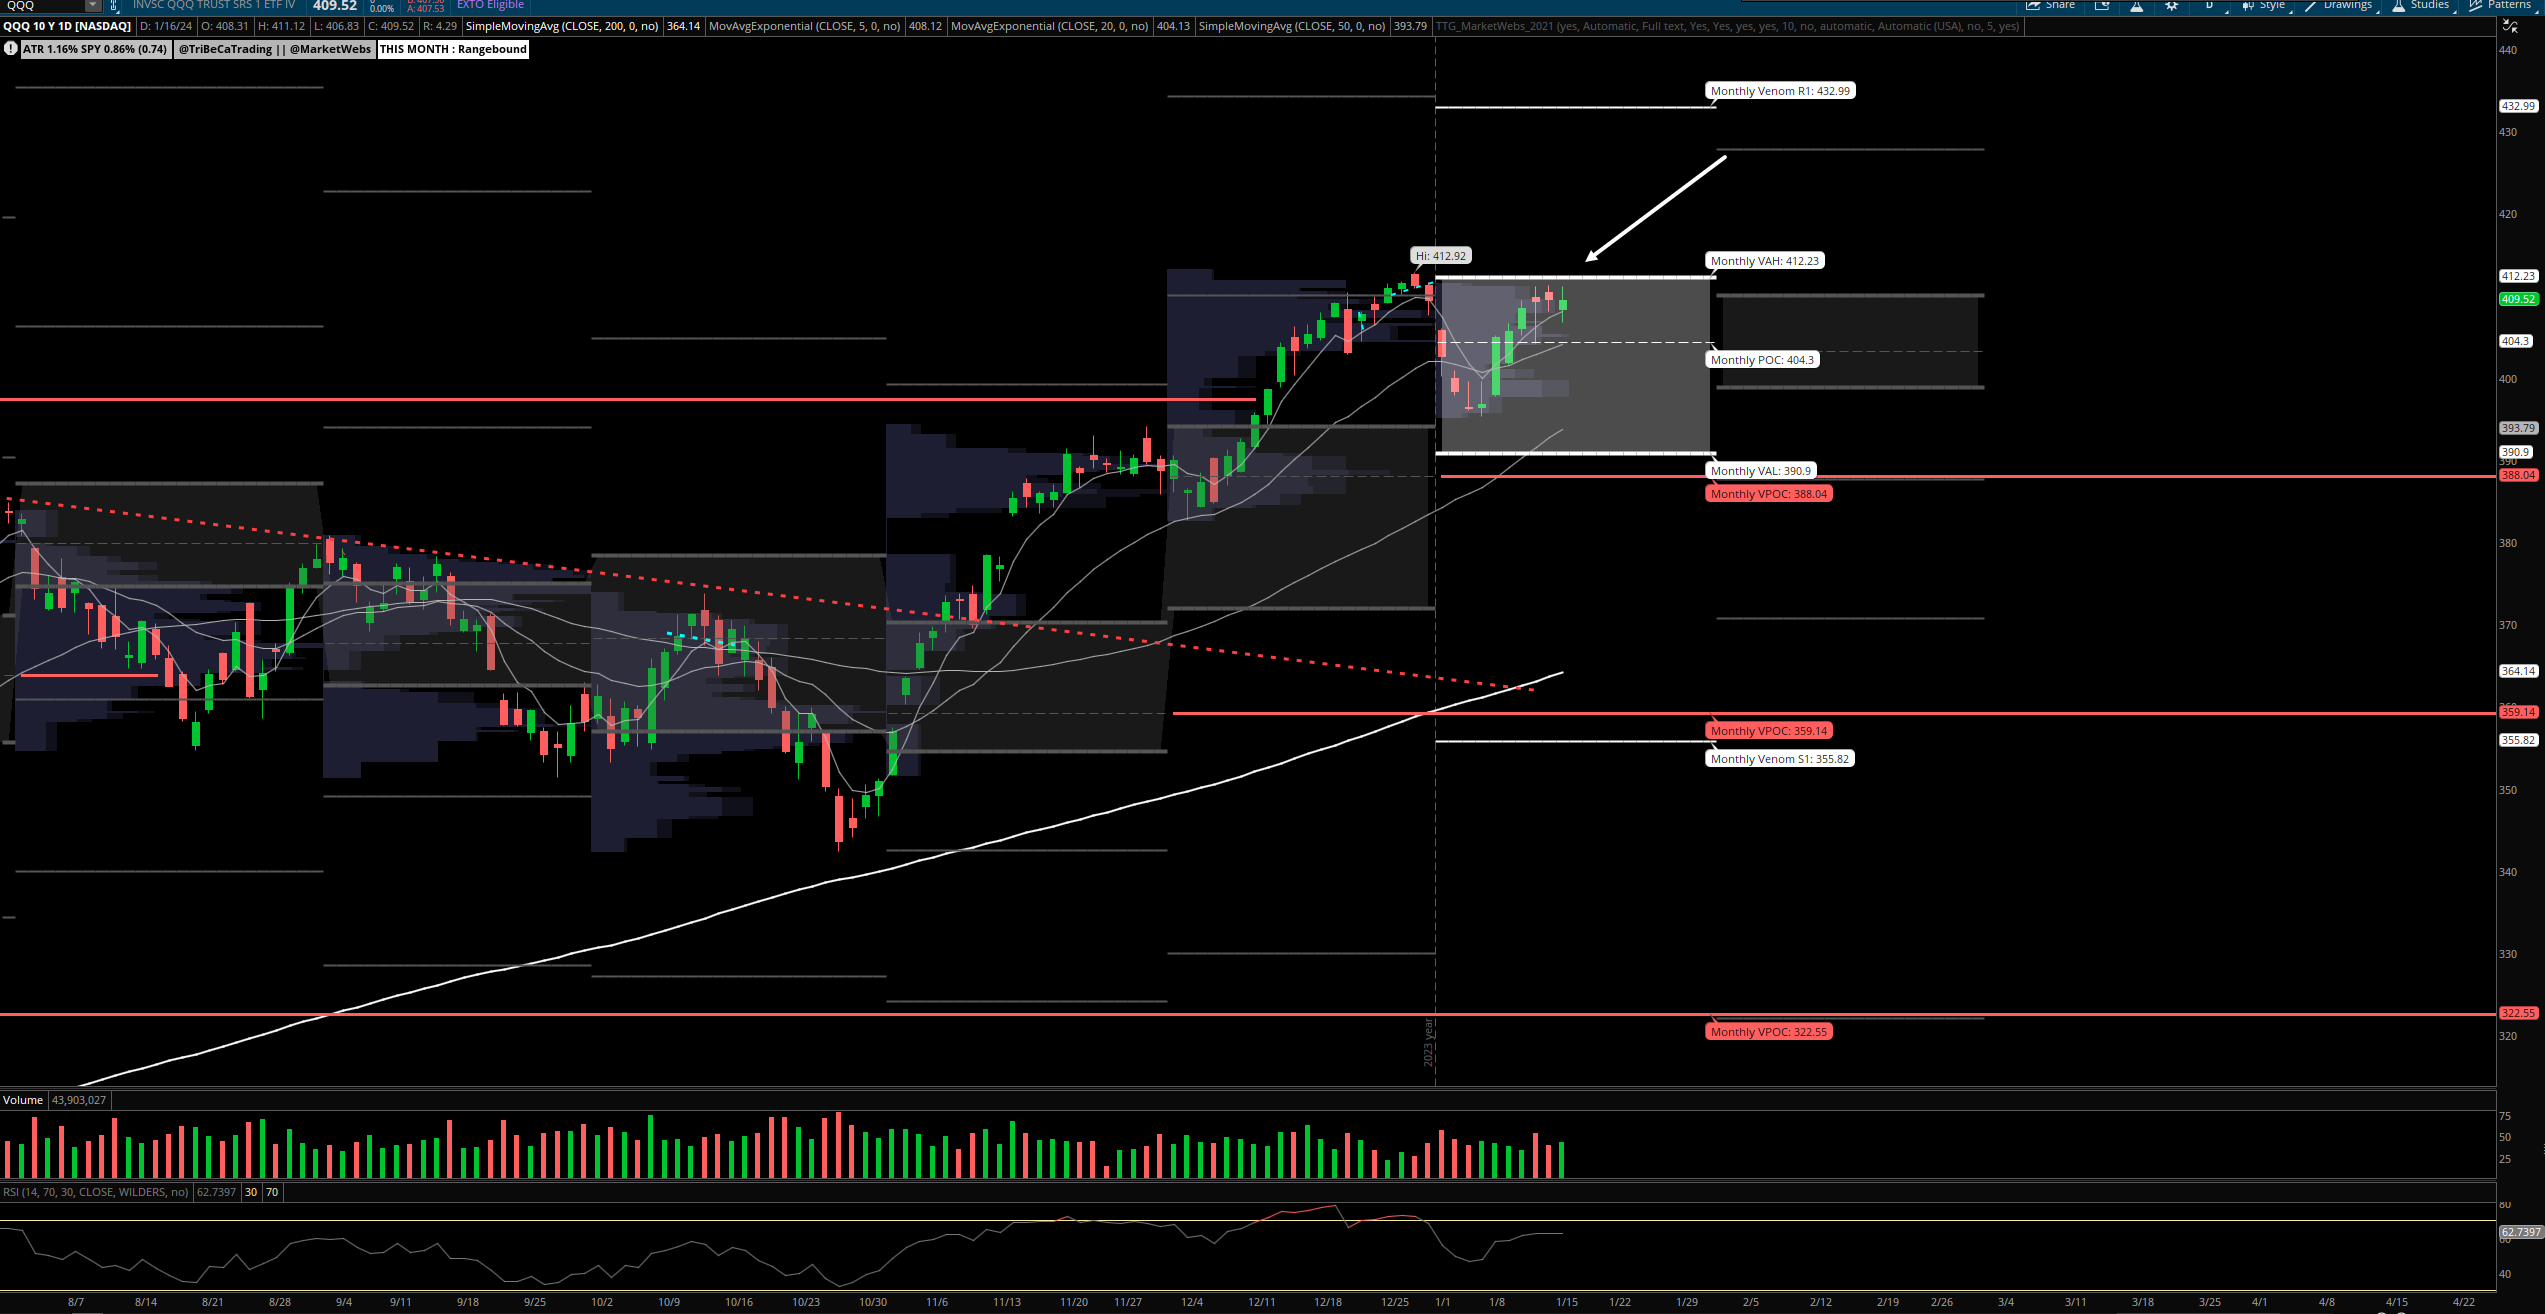
QQQ - NDX 100 ETF - Daily chart: Price ind -0.5% and will be getting a little further away from that Jan top of Value Area the upside level to watch remains $412.23
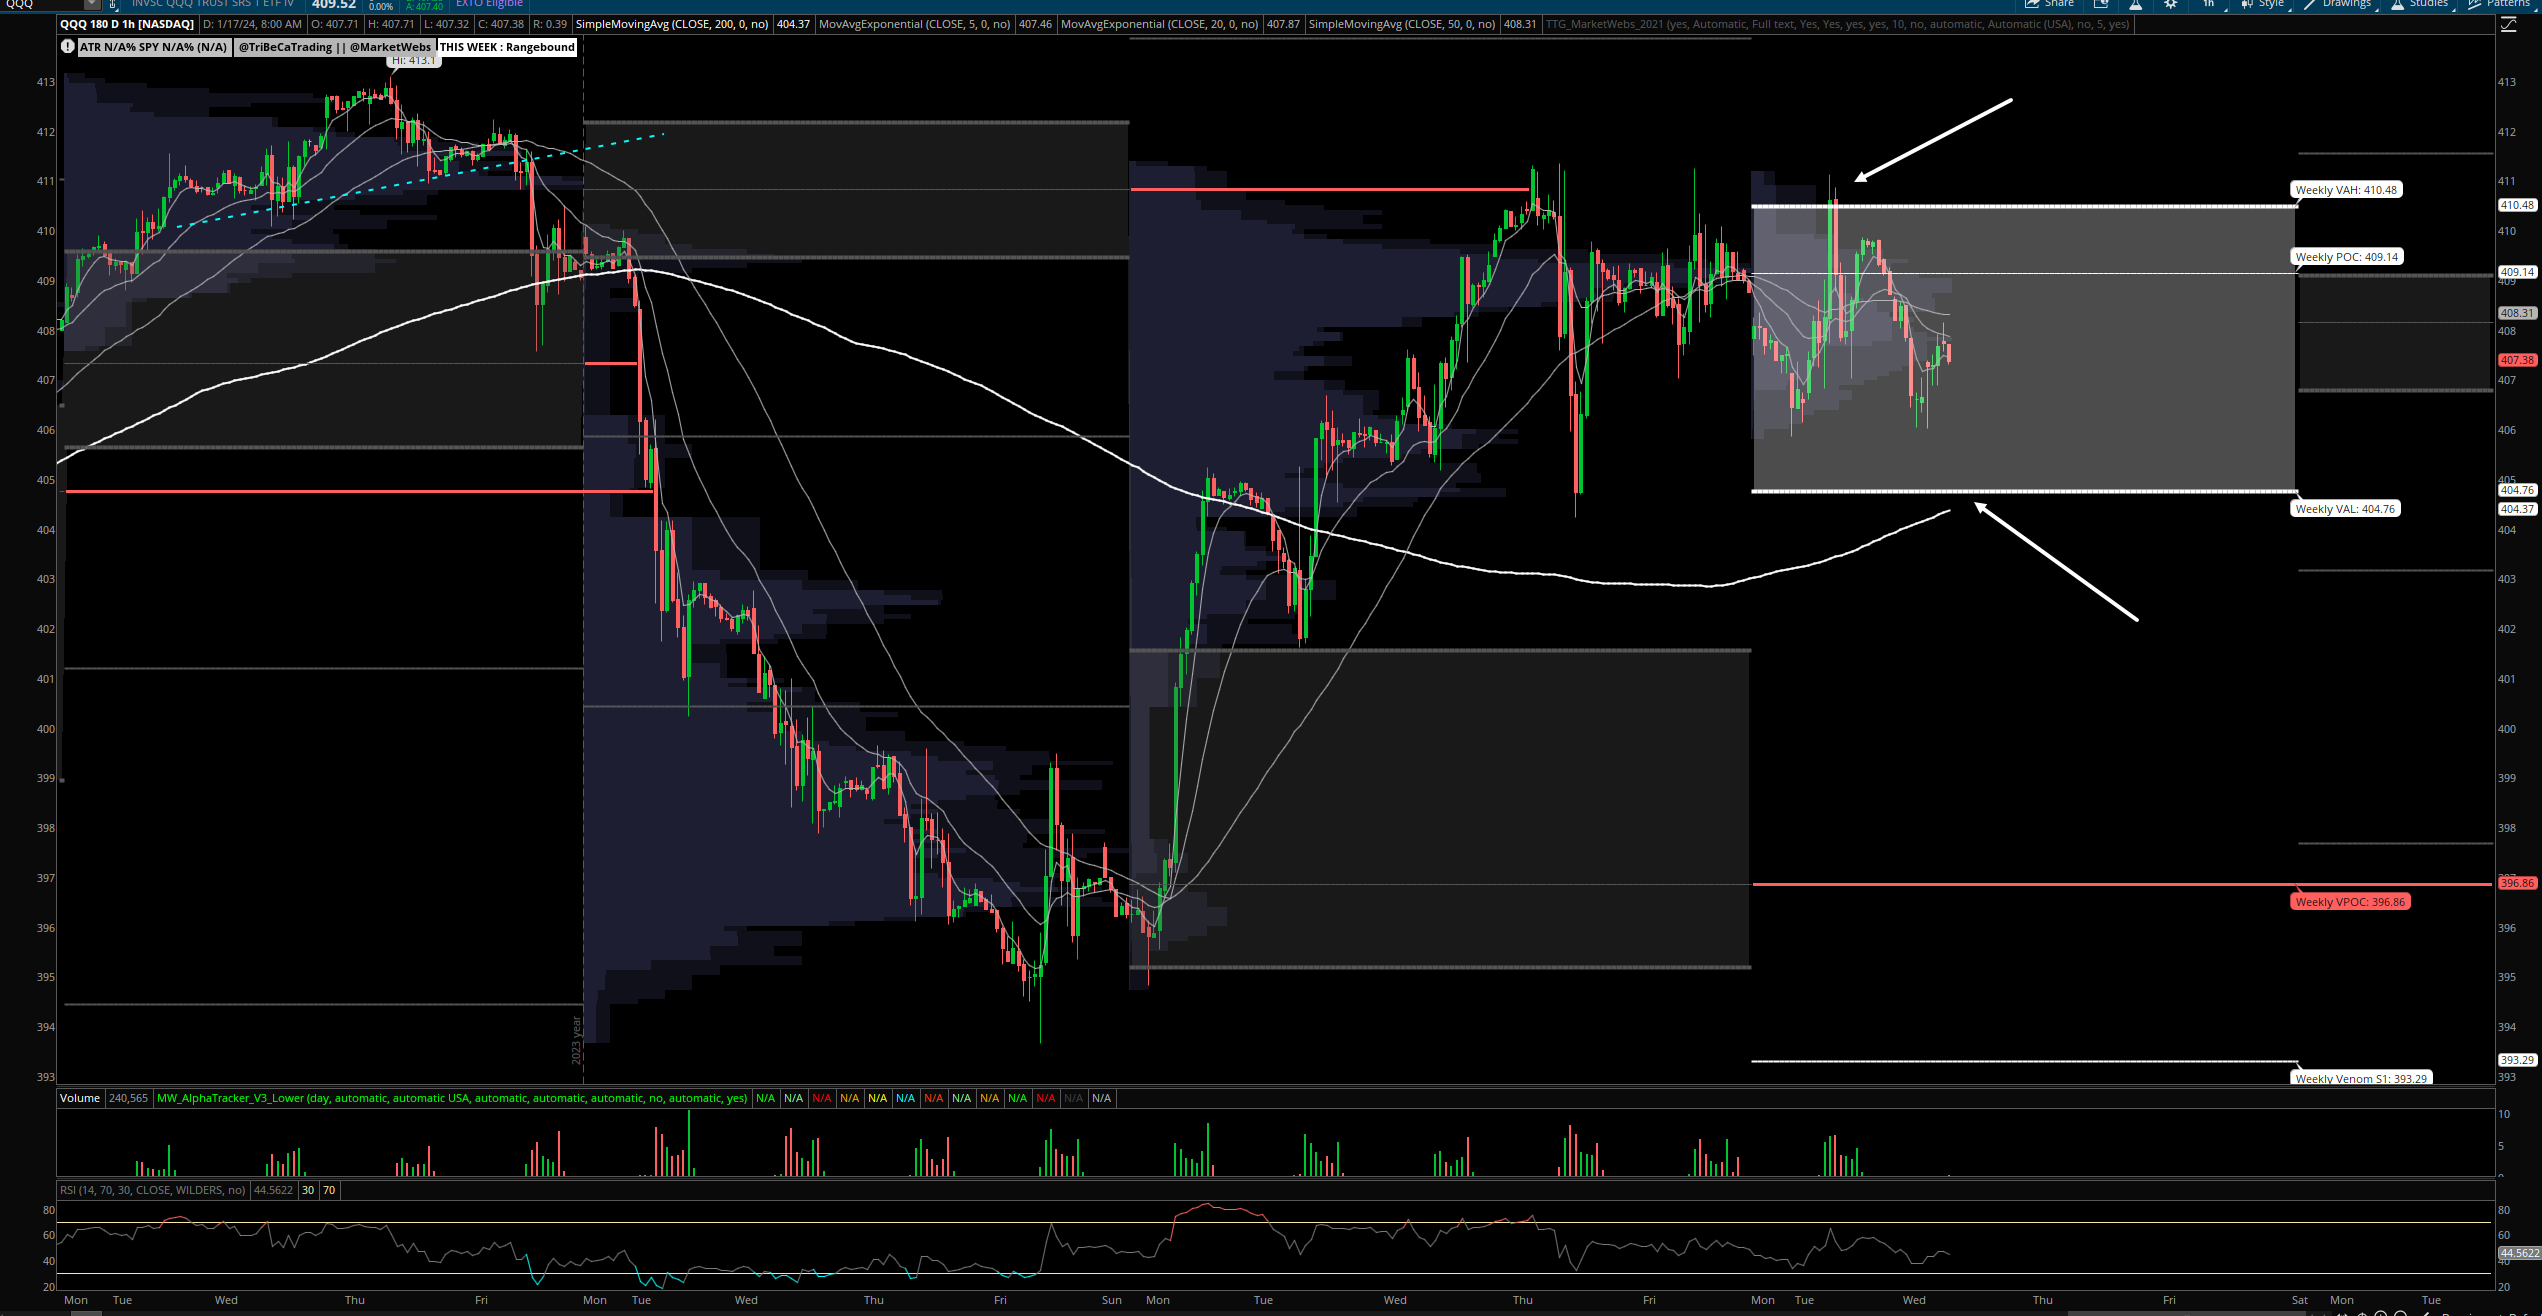
1hr chart: Price now in the middle of this week's Value Area after getting rejected at the top of the Value Area yesterday , levels to watch below
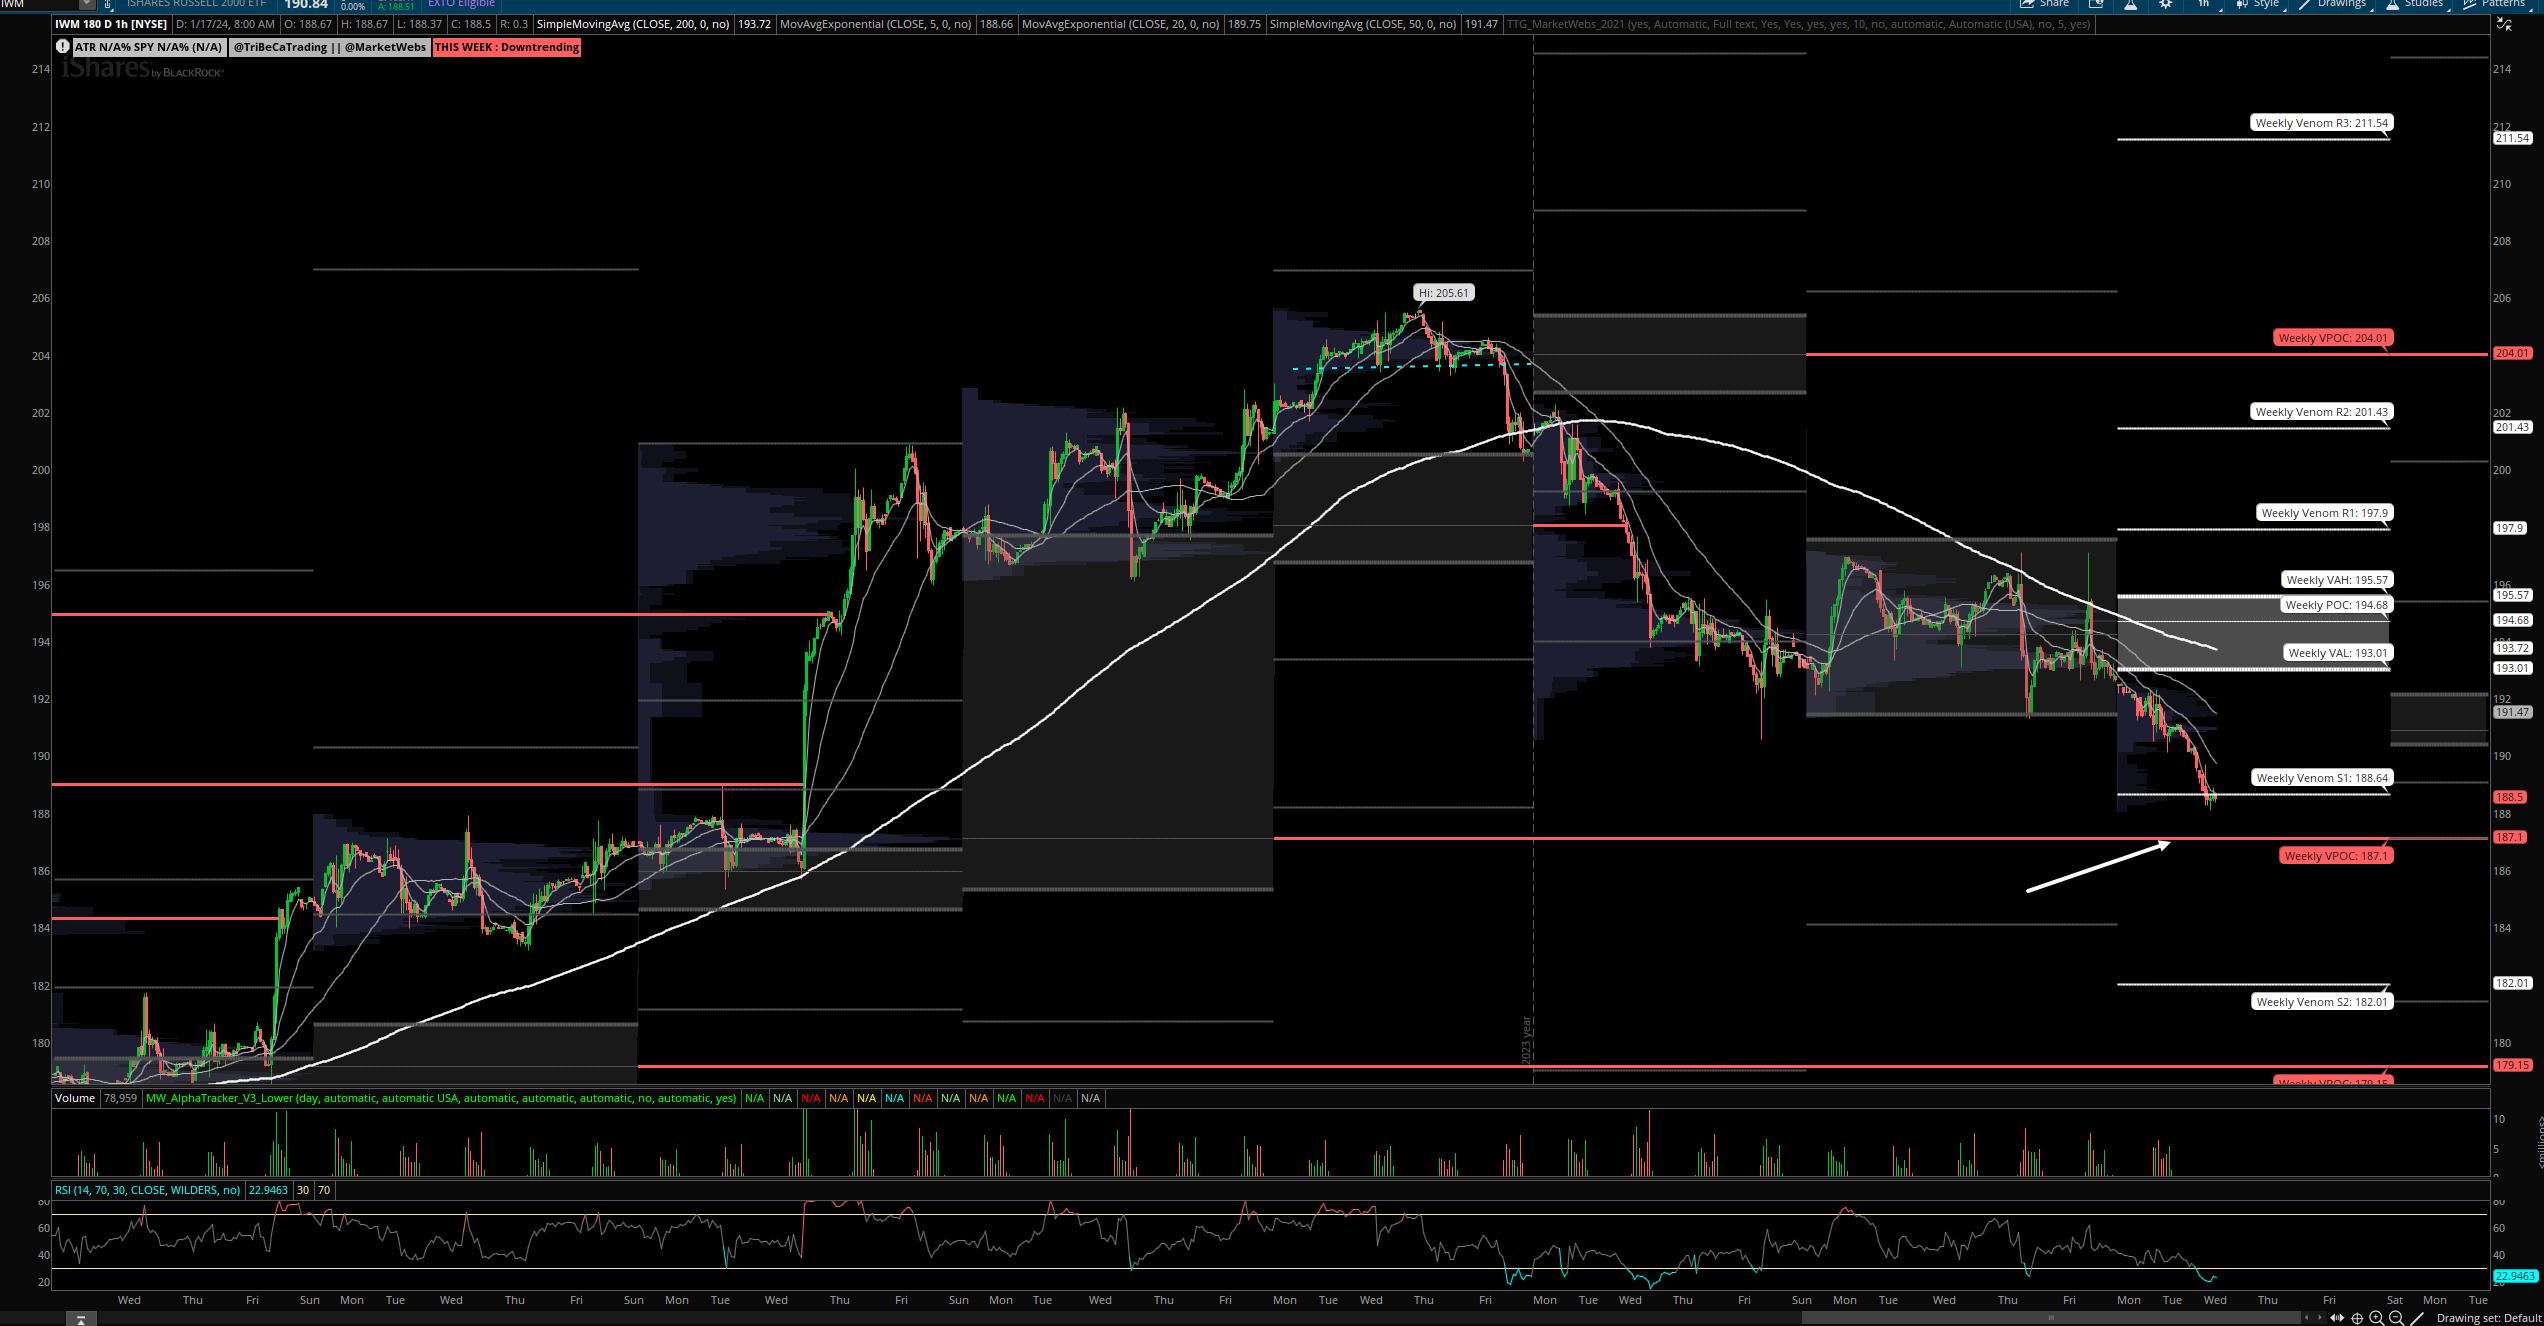
IWM - Russell Small Cap ETF- Price ind -0.7% and trailing once again & failed to move higher on Friday is below its short term 5 & 20d MAs (Moving Averages)
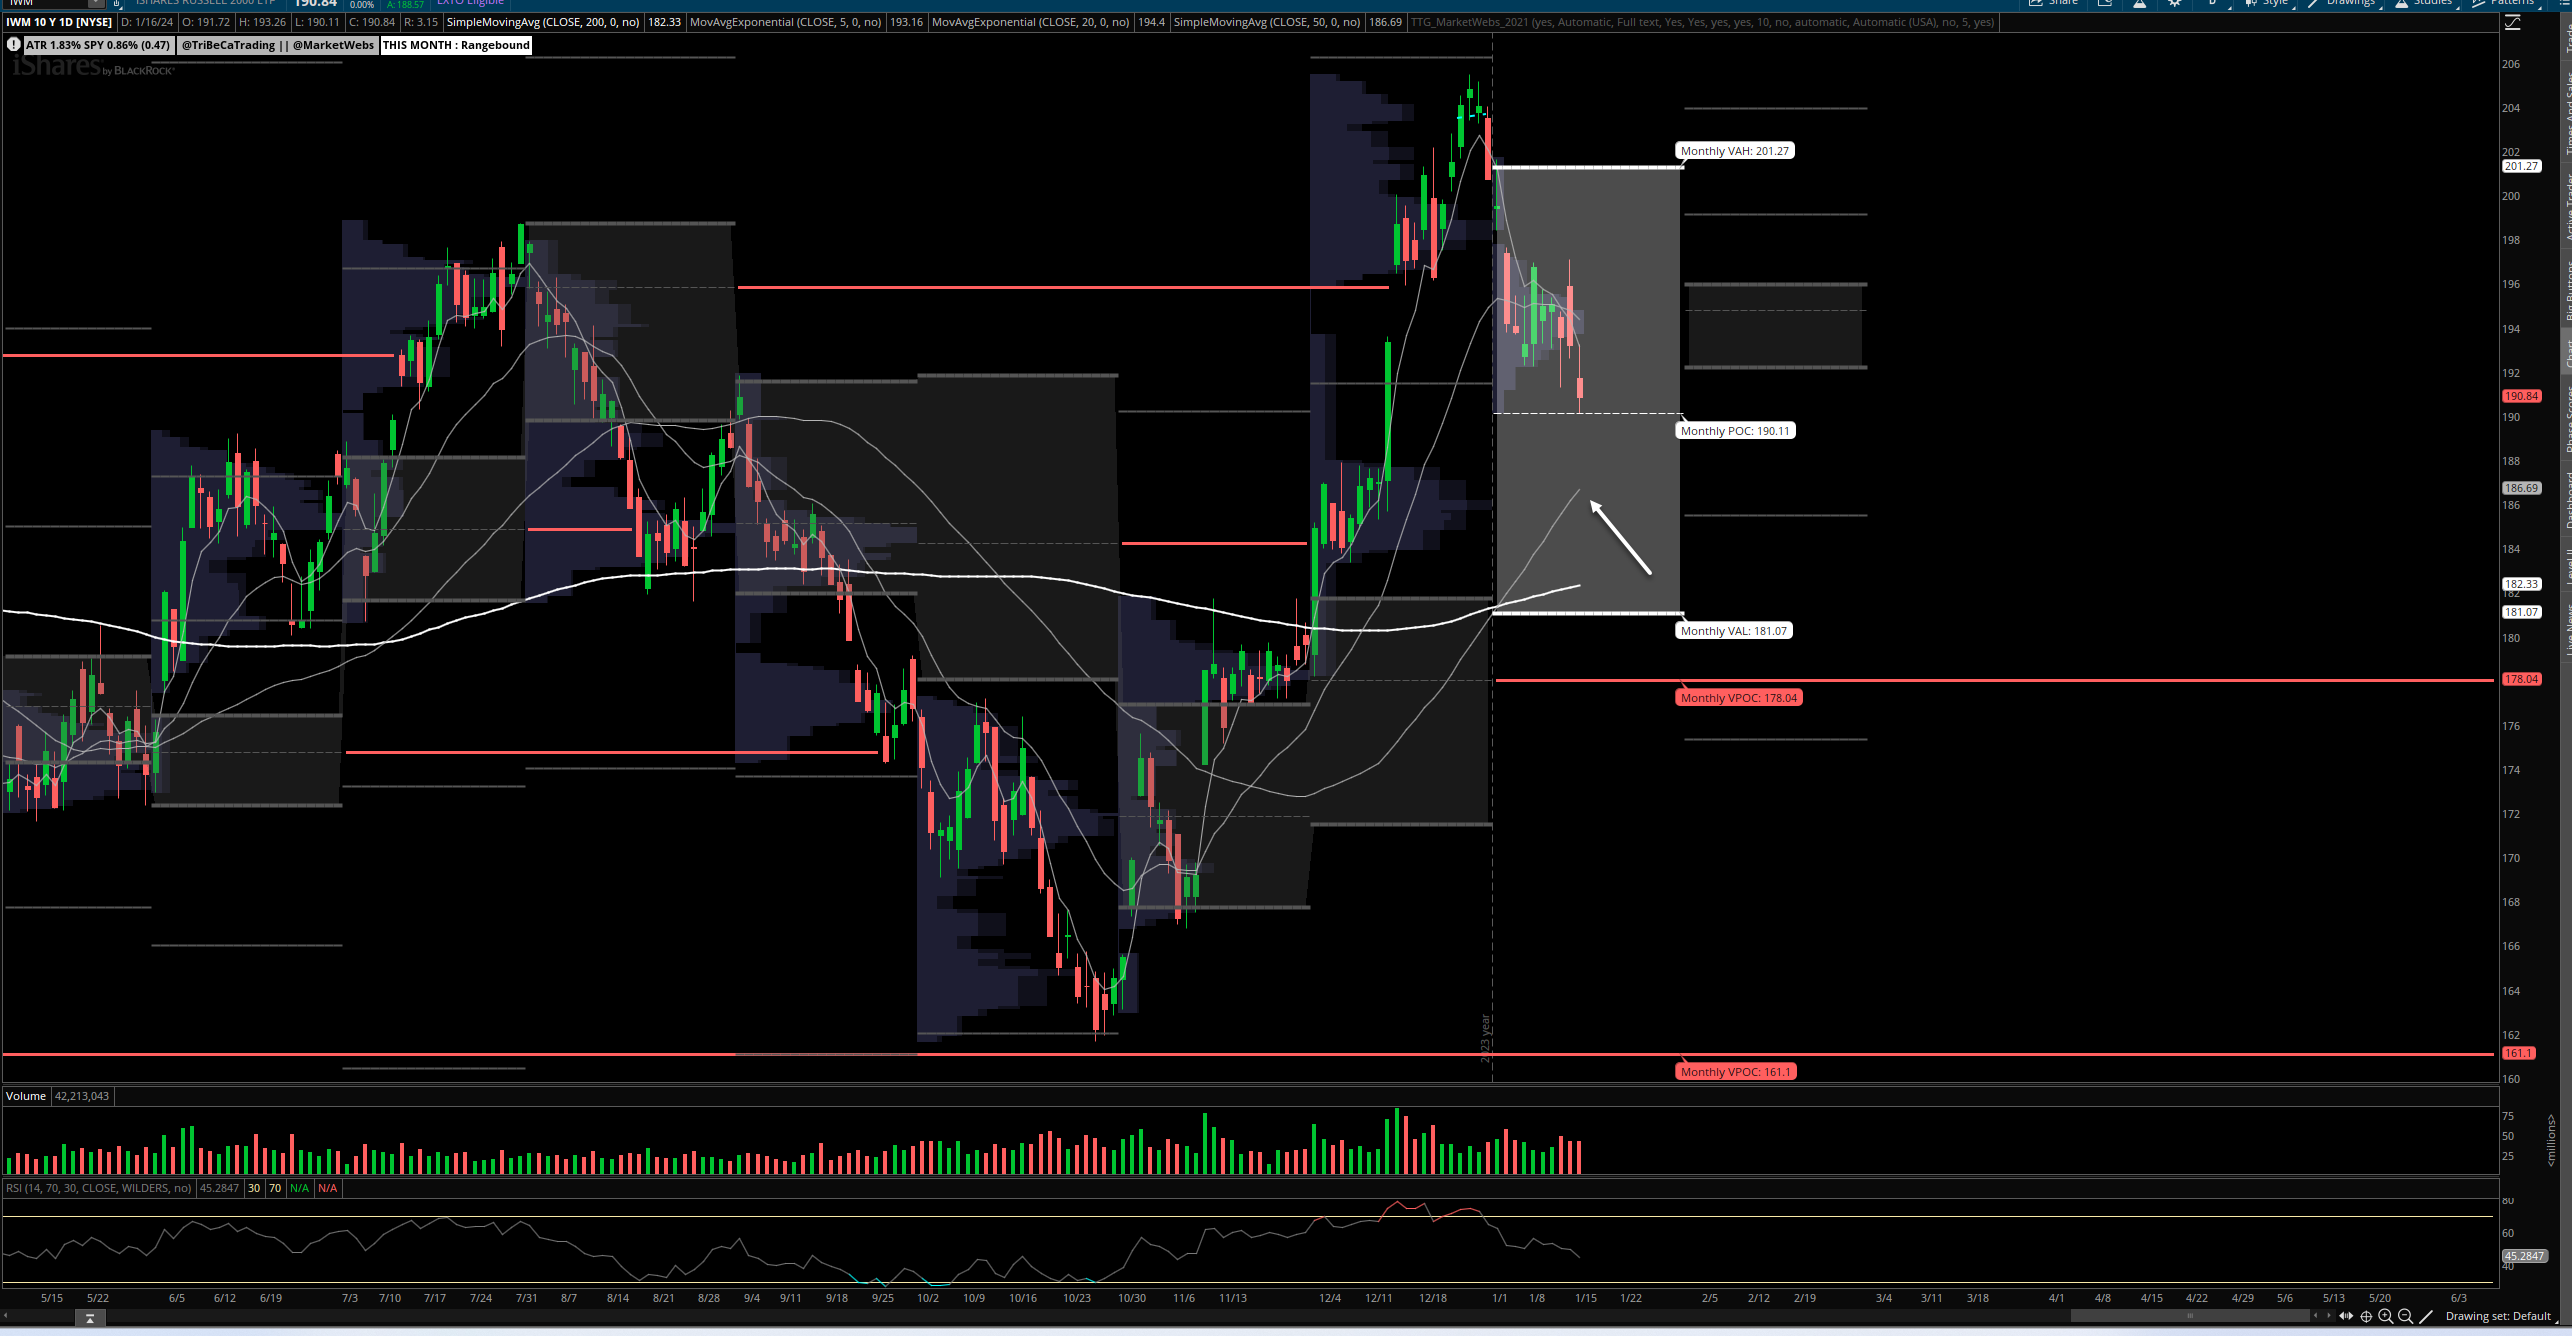
1hr chart: Price moving lower towards VPOC (red line) $187.10 which could be some support / demand
Here is today’s TTG Proprietary Stock Screen “Out of the Box” using Volume At Price
names trending above their Value Areas (on 3 multiple timeframes & not super extended)
Keep reading with a 7-day free trial
Subscribe to The Tribeca Trade Group to keep reading this post and get 7 days of free access to the full post archives.