

TTG Index Charts & Out of the Box Stock Screen 3/12/24 $WFRD
TTG Index Charts & Out of the Box Stock Screen 3/12/24 $WFRD
Out of the Box MarketWebs Screen
US Dollar flat / 30yr Bonds +0.3% / Crude +0.1% & Nat Gas +3.1% / Gold -0.4% / Copper +0.4% / BTC -0.3%
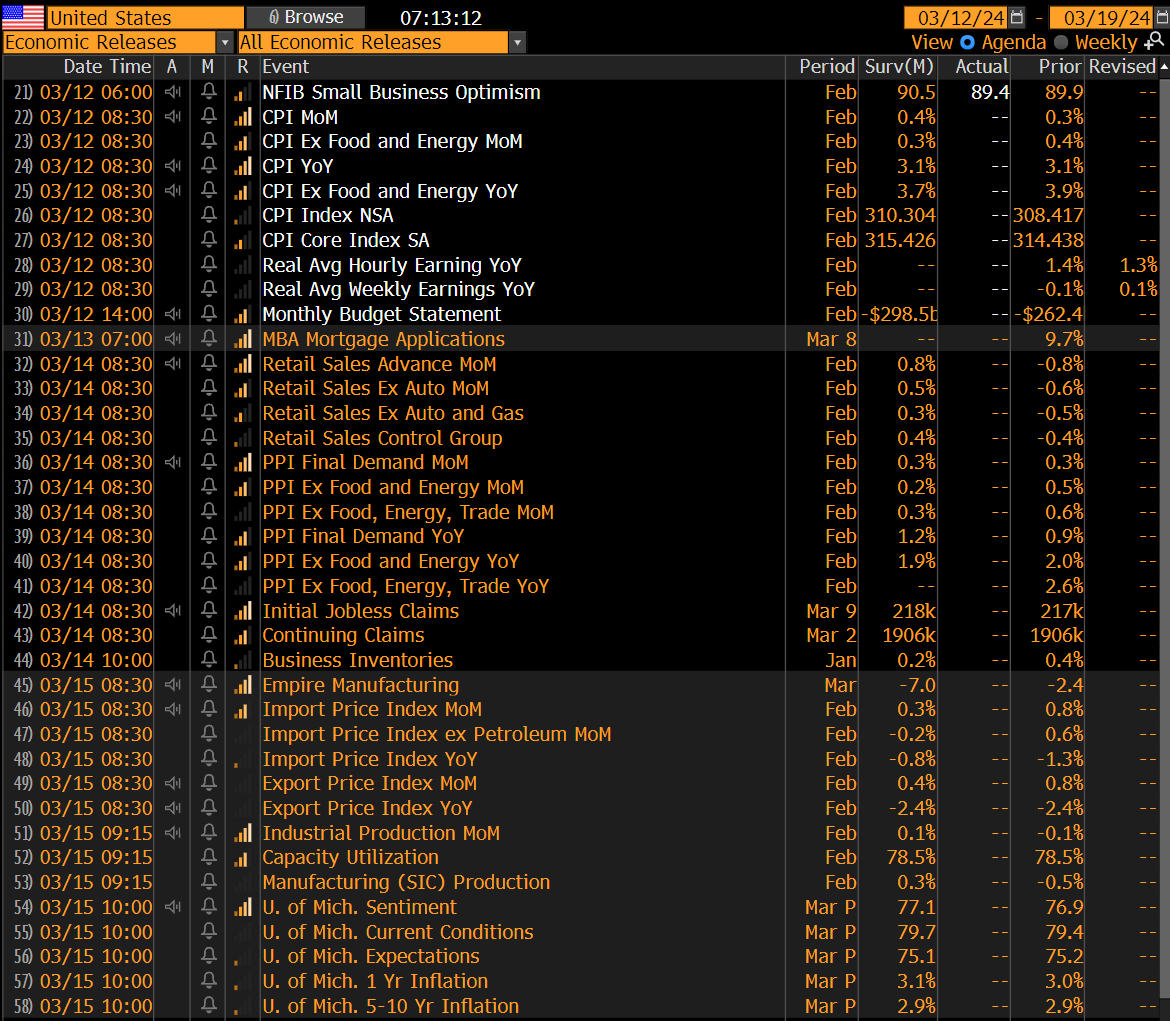
US Upcoming Economics
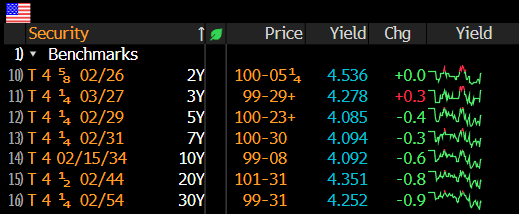
US Bond Yields
Index Updates
At TTG, I use Volume At Price in my chart analysis and I use the MarketWebs Indicator to provide Value Areas & VPOCs which indicate significant support & resistance levels. Learn More Here about Volume At Price and the MarketWebs.
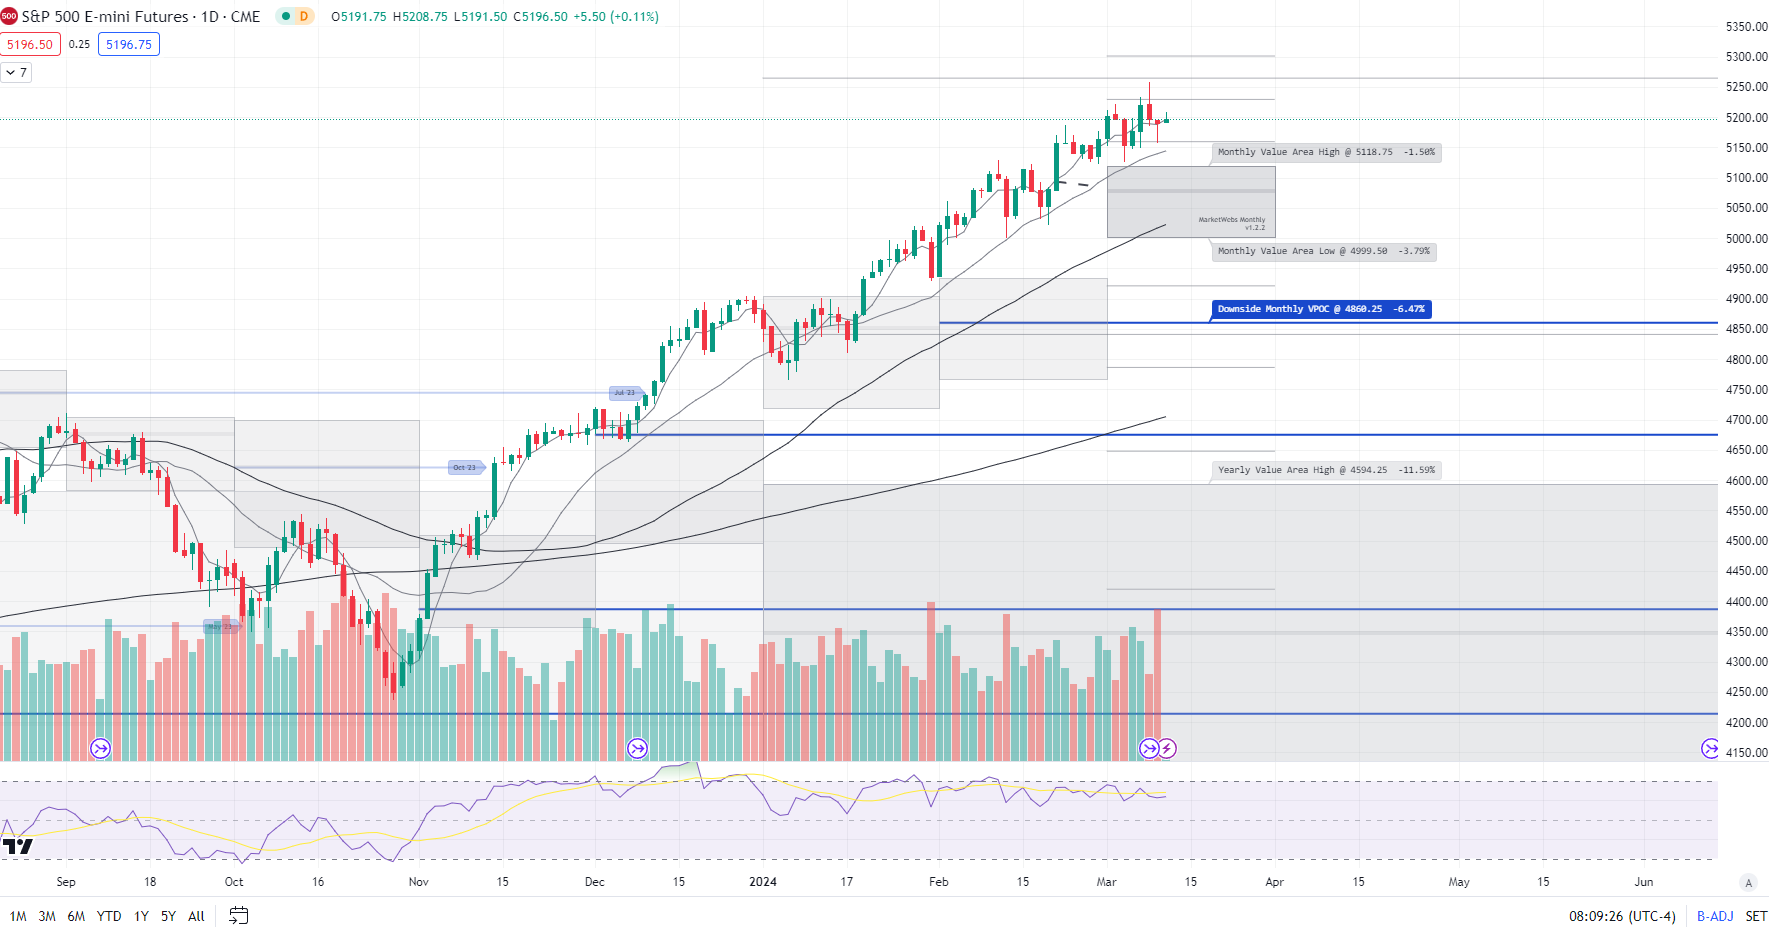
ES_F - SPX Futures - Price ind. +0.2% this morning ahead of the CPI report and right in the middle of the channel and at its 5d MA and above its Mar Value Area
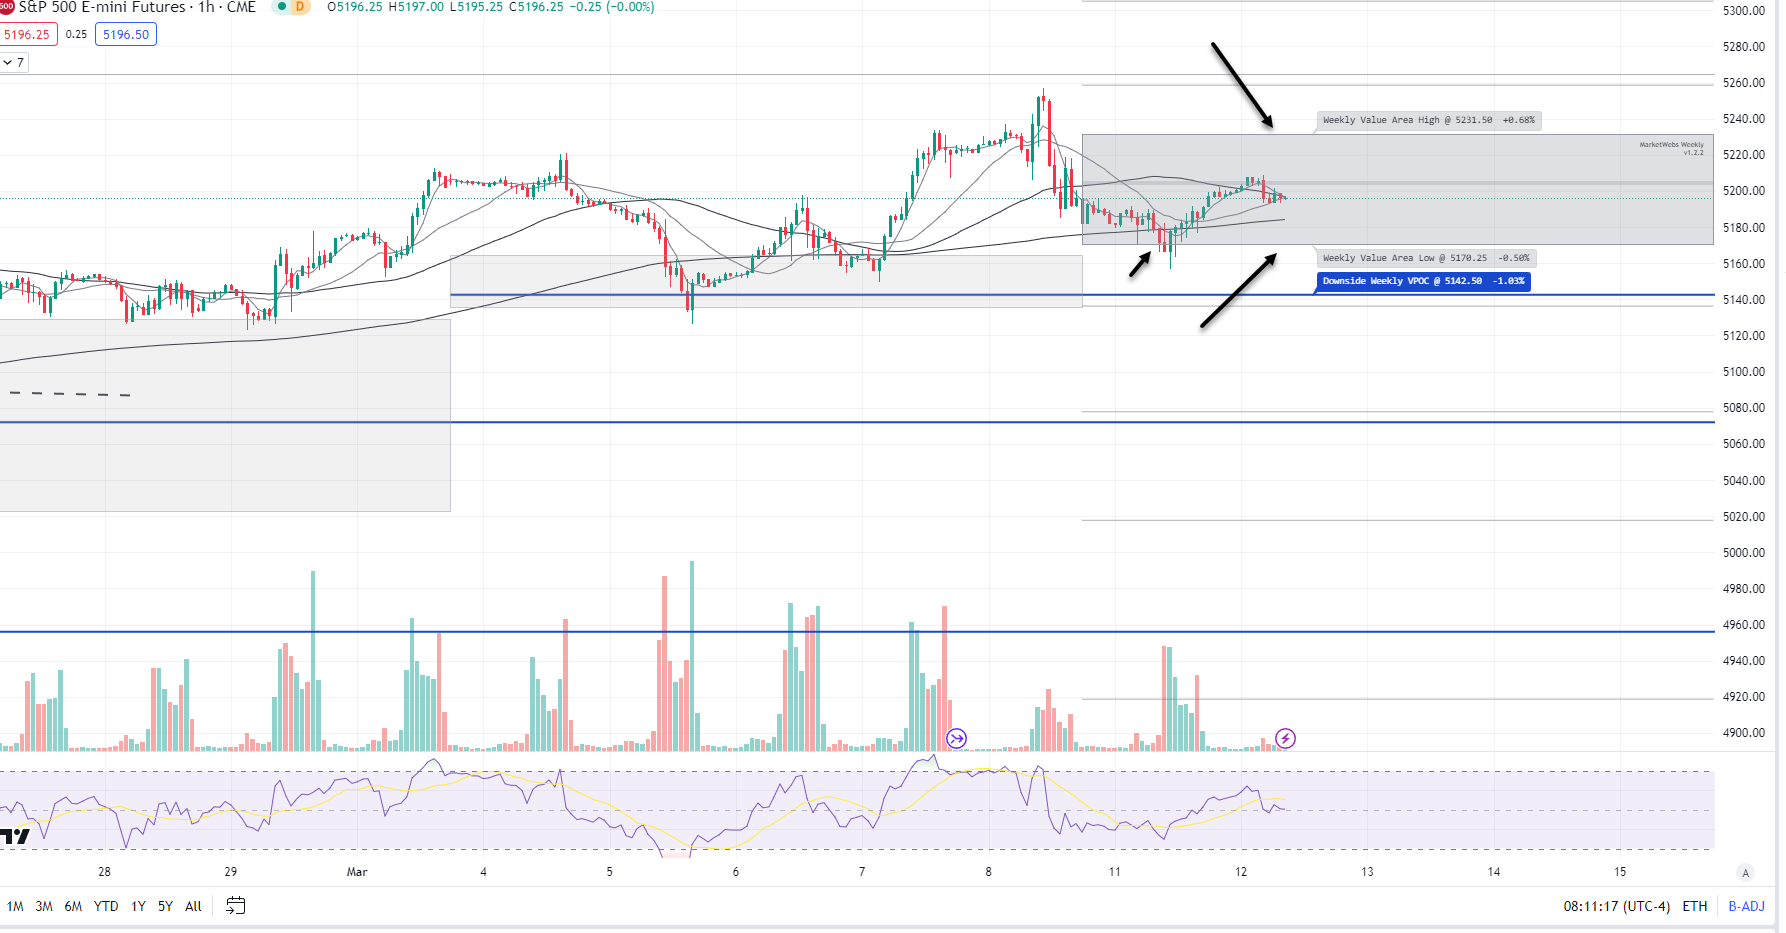
1hr chart: Price in the middle of its Value Area for the week after testing bottom of value yesterday so it appears the market is waiting for the CPI report to establish direction
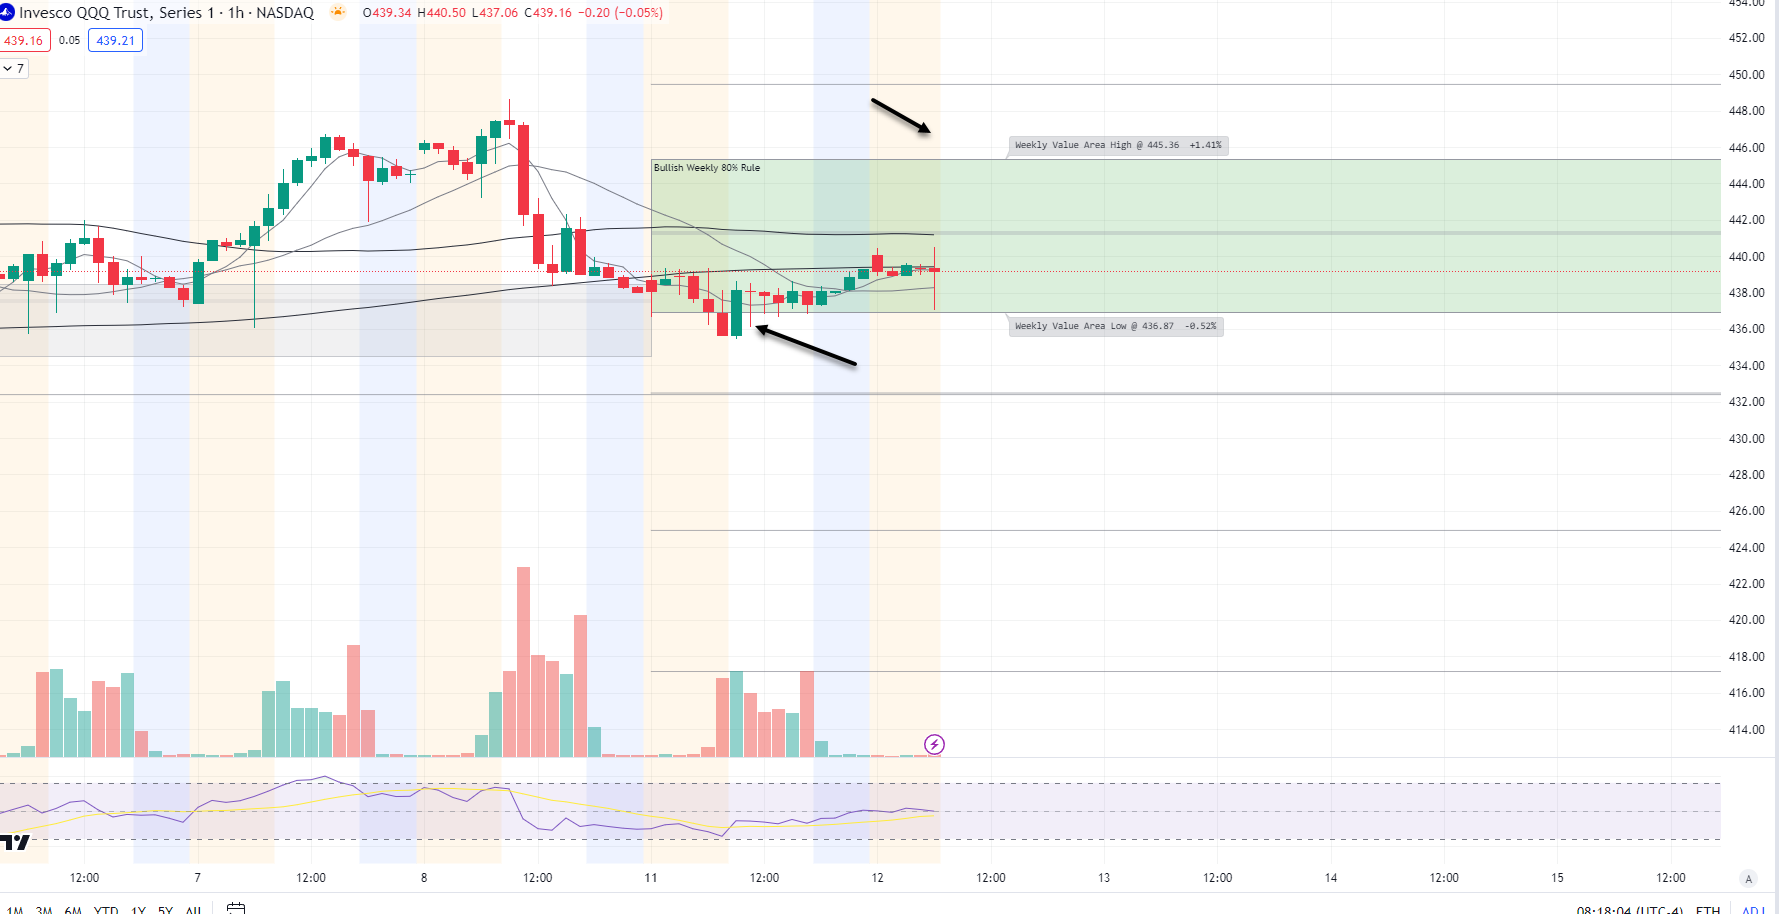
QQQ - NDX 100 ETF - Daily chart: Price ind. +0.4% this morning with ORCL strong earnings helping the early strength in Tech / Software.
Note, price is now inside its Mar Value Area which has triggered the Bearish 80% rule, ,meaning there is an 80% chance price travels through the Value Area down to $427.86 (unless price can reclaim $439.06)

1hr chart: Interesting price is inside its Value Area for the week and the Bullish 80% rule is on this timeframe so we have a bit of a conflict here - for now, watch $436.87 support
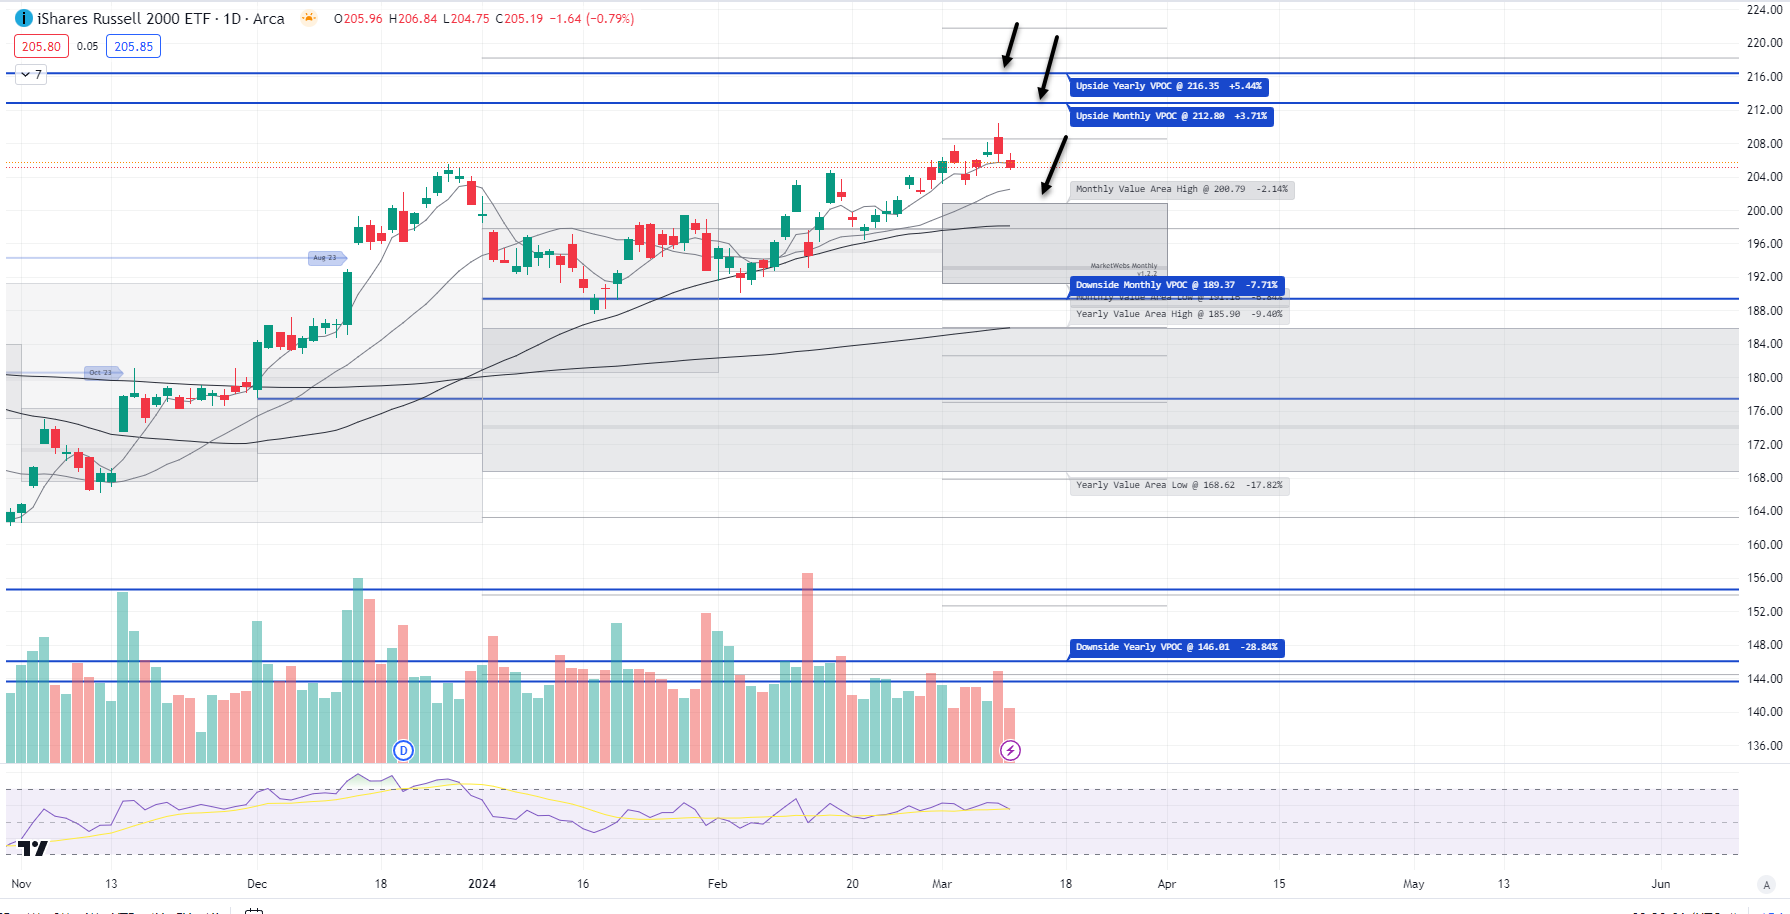
IWM - Russell Small Cap ETF- Price ind. +0.2% and not much change here to report, let's see if price can get back above its 5d MA
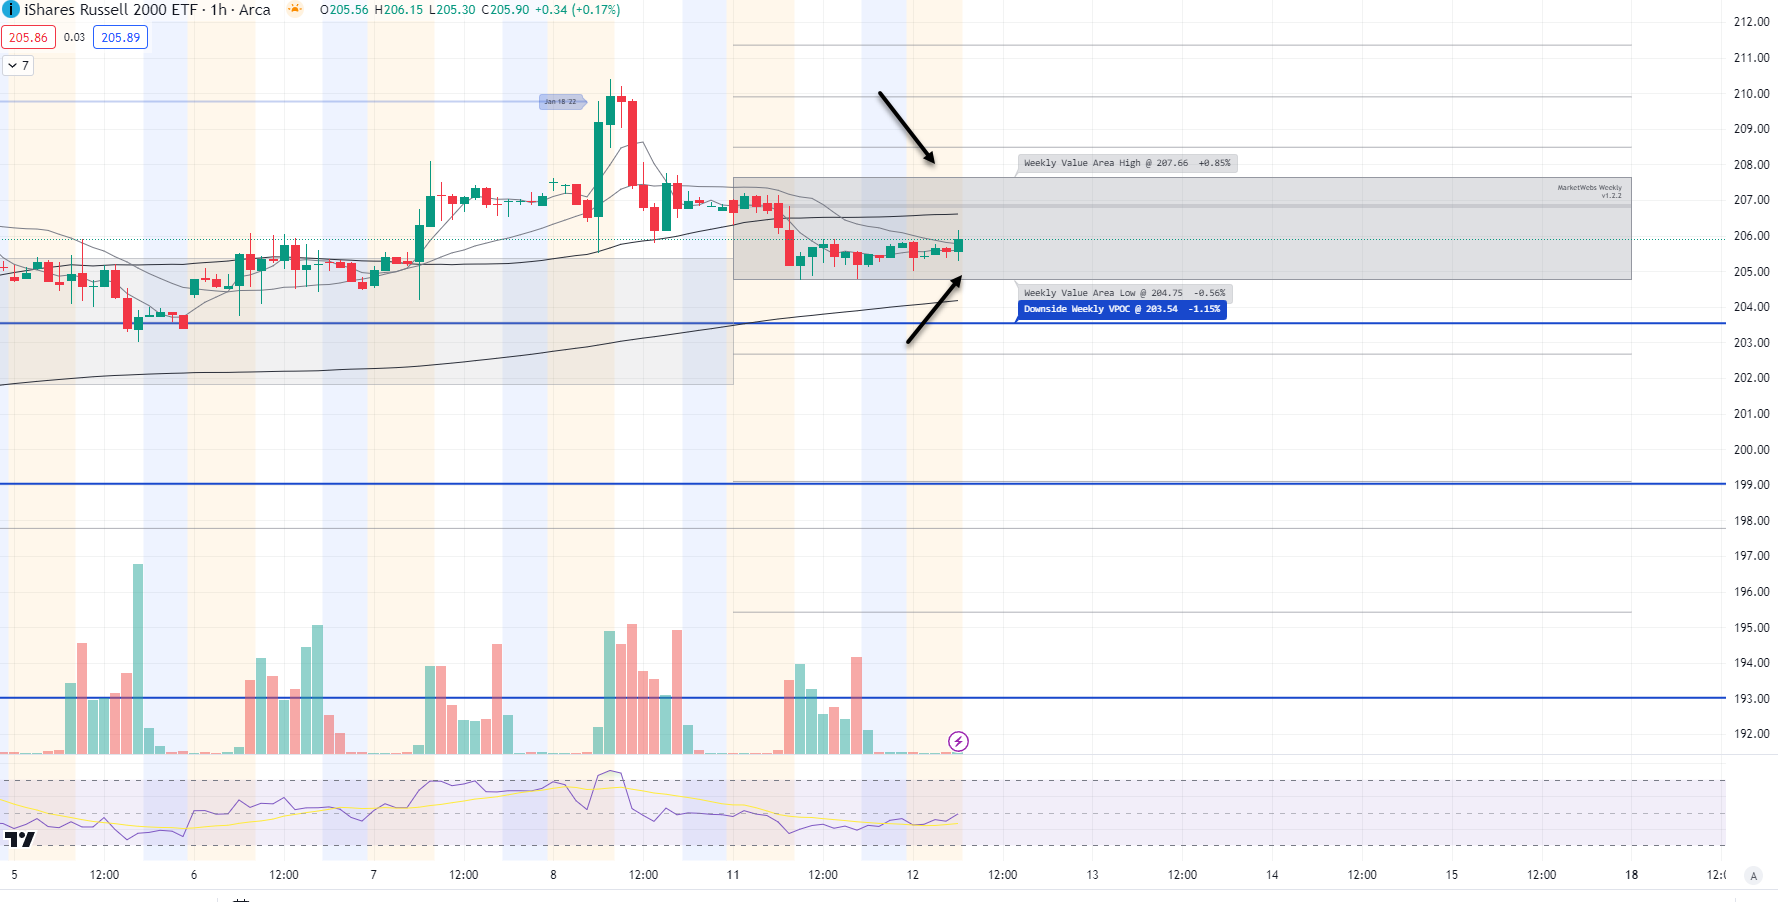
1hr chart: Price remains inside its Value Area for the week, levels to watch below
Here is today’s TTG Proprietary Stock Screen “Out of the Box” using Volume At Price
names trending above their Value Areas (on 3 multiple timeframes & not super extended)
Keep reading with a 7-day free trial
Subscribe to The Tribeca Trade Group to keep reading this post and get 7 days of free access to the full post archives.