

TTG Index Charts & Out of the Box Stock Screen 3/18/24 $ITW
TTG Index Charts & Out of the Box Stock Screen 3/18/24 $ITW
Out of the Box MarketWebs Screen
US Dollar -0.1% / 30yr Bonds -0.2% / Crude +0.5% & Nat Gas +4.4% / Gold +0.1% / Copper +0.2% / BTC -0.8%
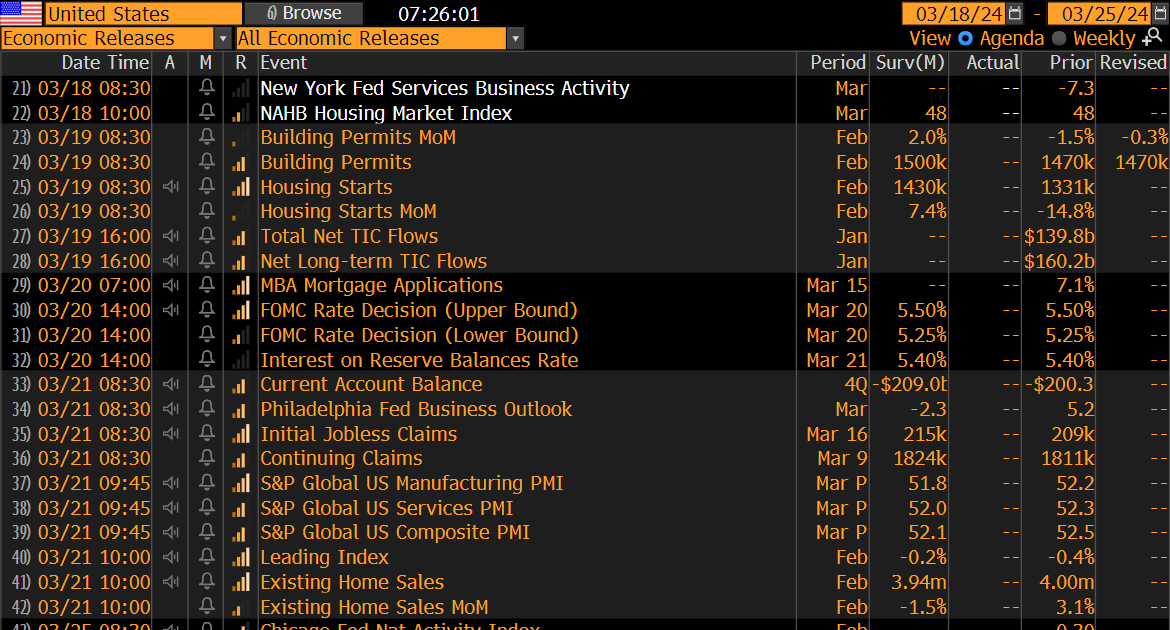
US Upcoming Economics
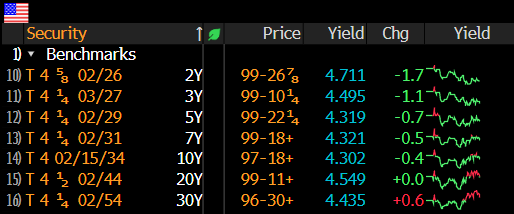
US Bond Yields
Index Updates
At TTG, I use Volume At Price in my chart analysis and I use the MarketWebs Indicator to provide Value Areas & VPOCs which indicate significant support & resistance levels. Learn More Here about Volume At Price and the MarketWebs.
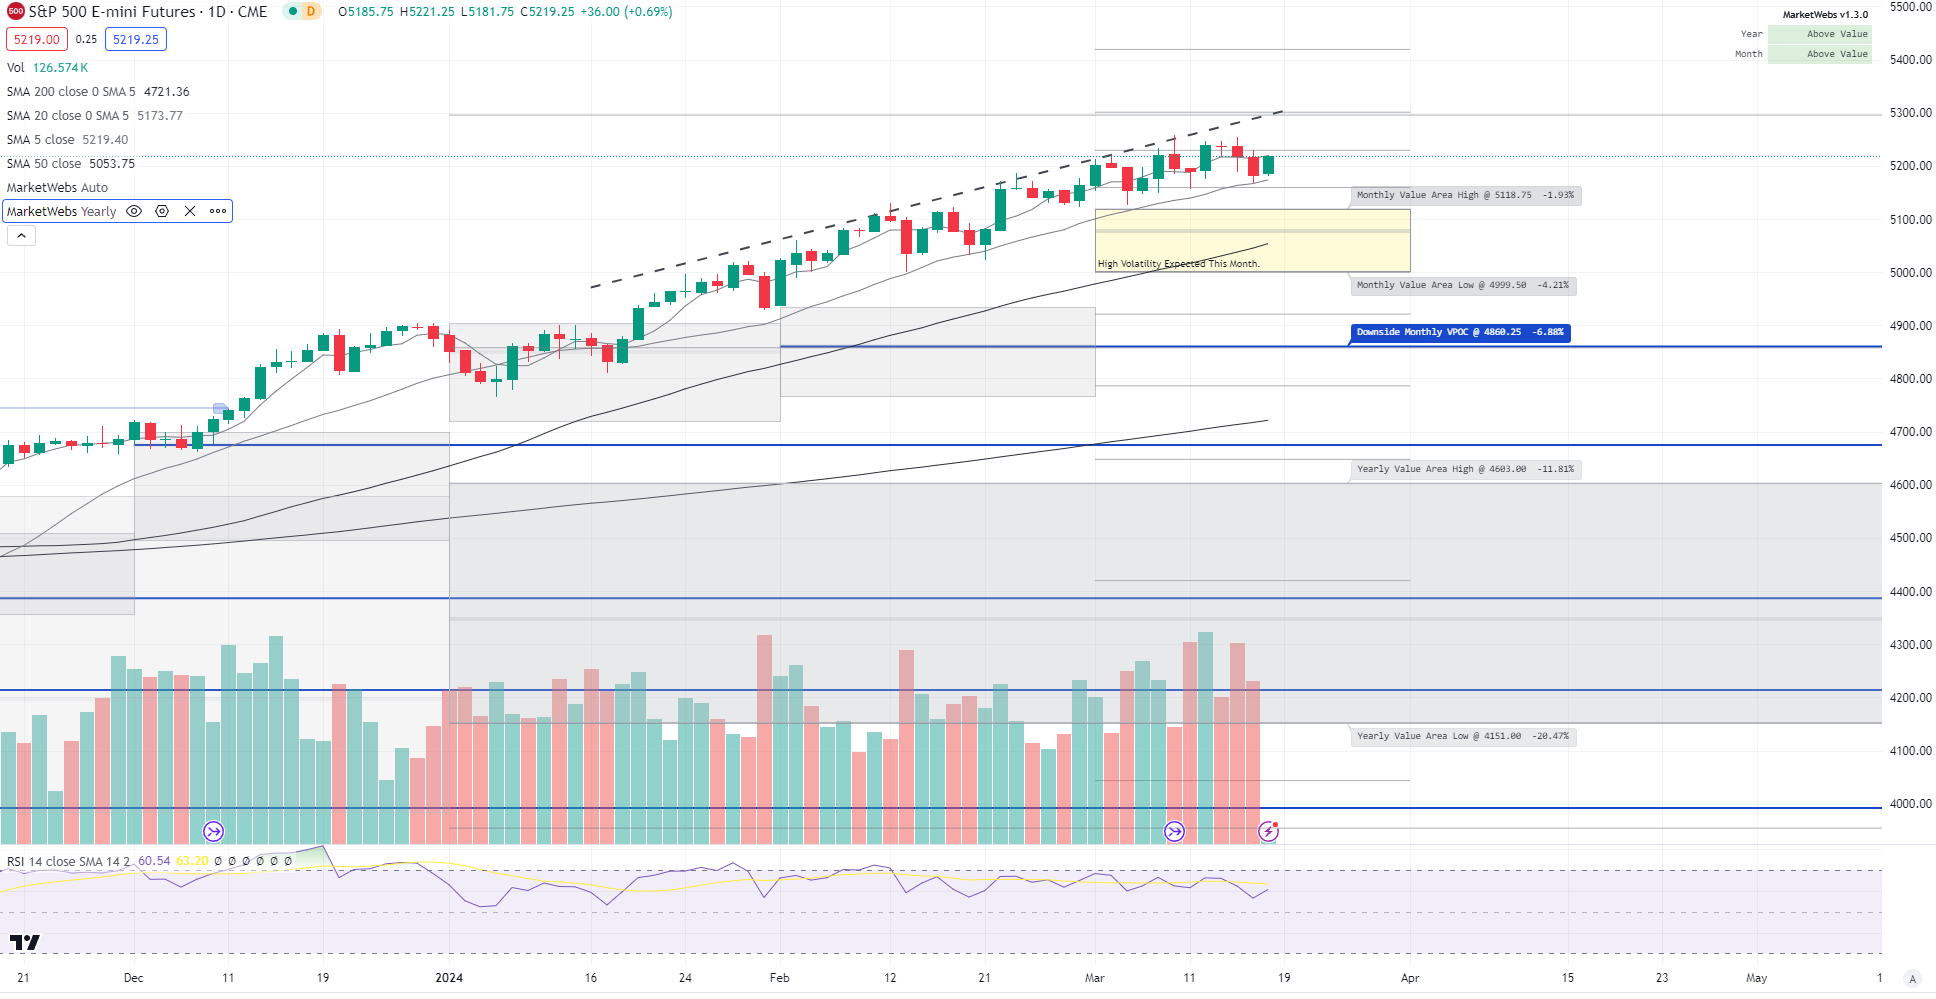
ES_F - SPX Futures - Big bounce this morning after Quad Witching on Friday, price ind. +0.8% and remains inside the uptrend channel and above its Mar Value Area & 20d MA (Moving Average)
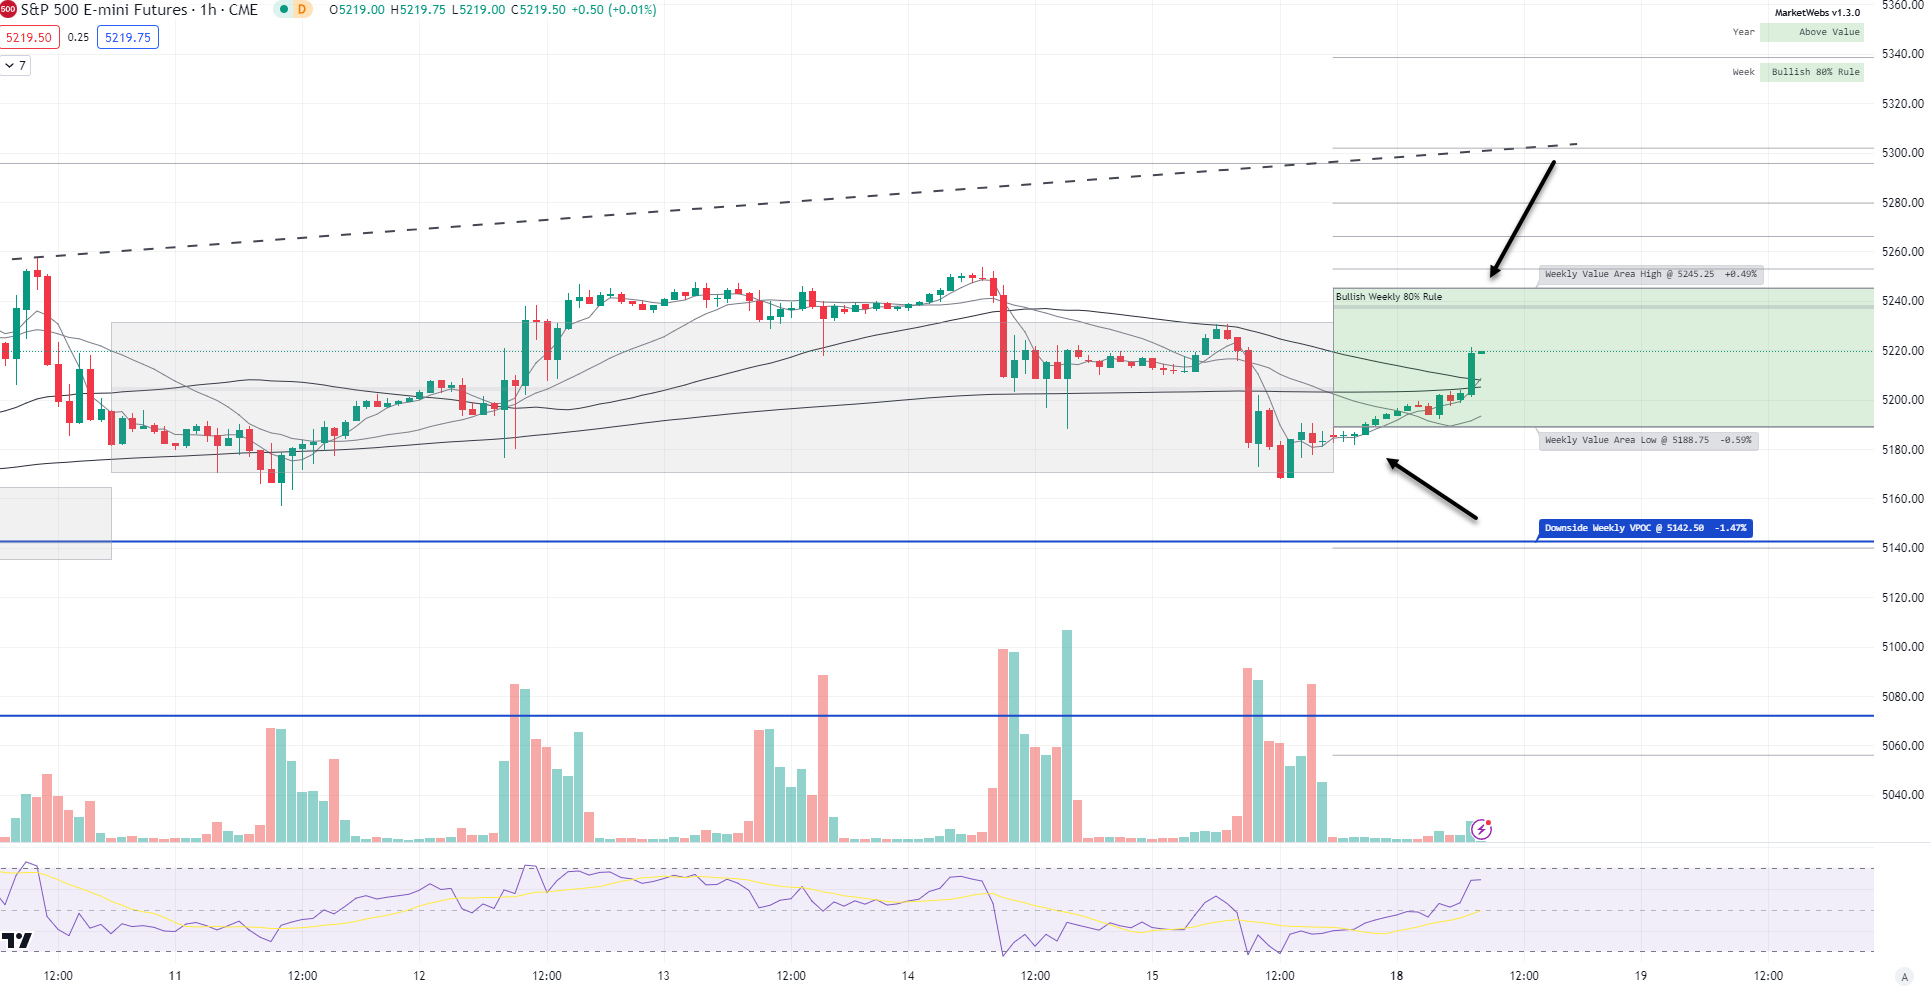
1hr chart: Price inside its new Value Area for the week and the #bullish 80% rule is in effect, resistance 5245.25
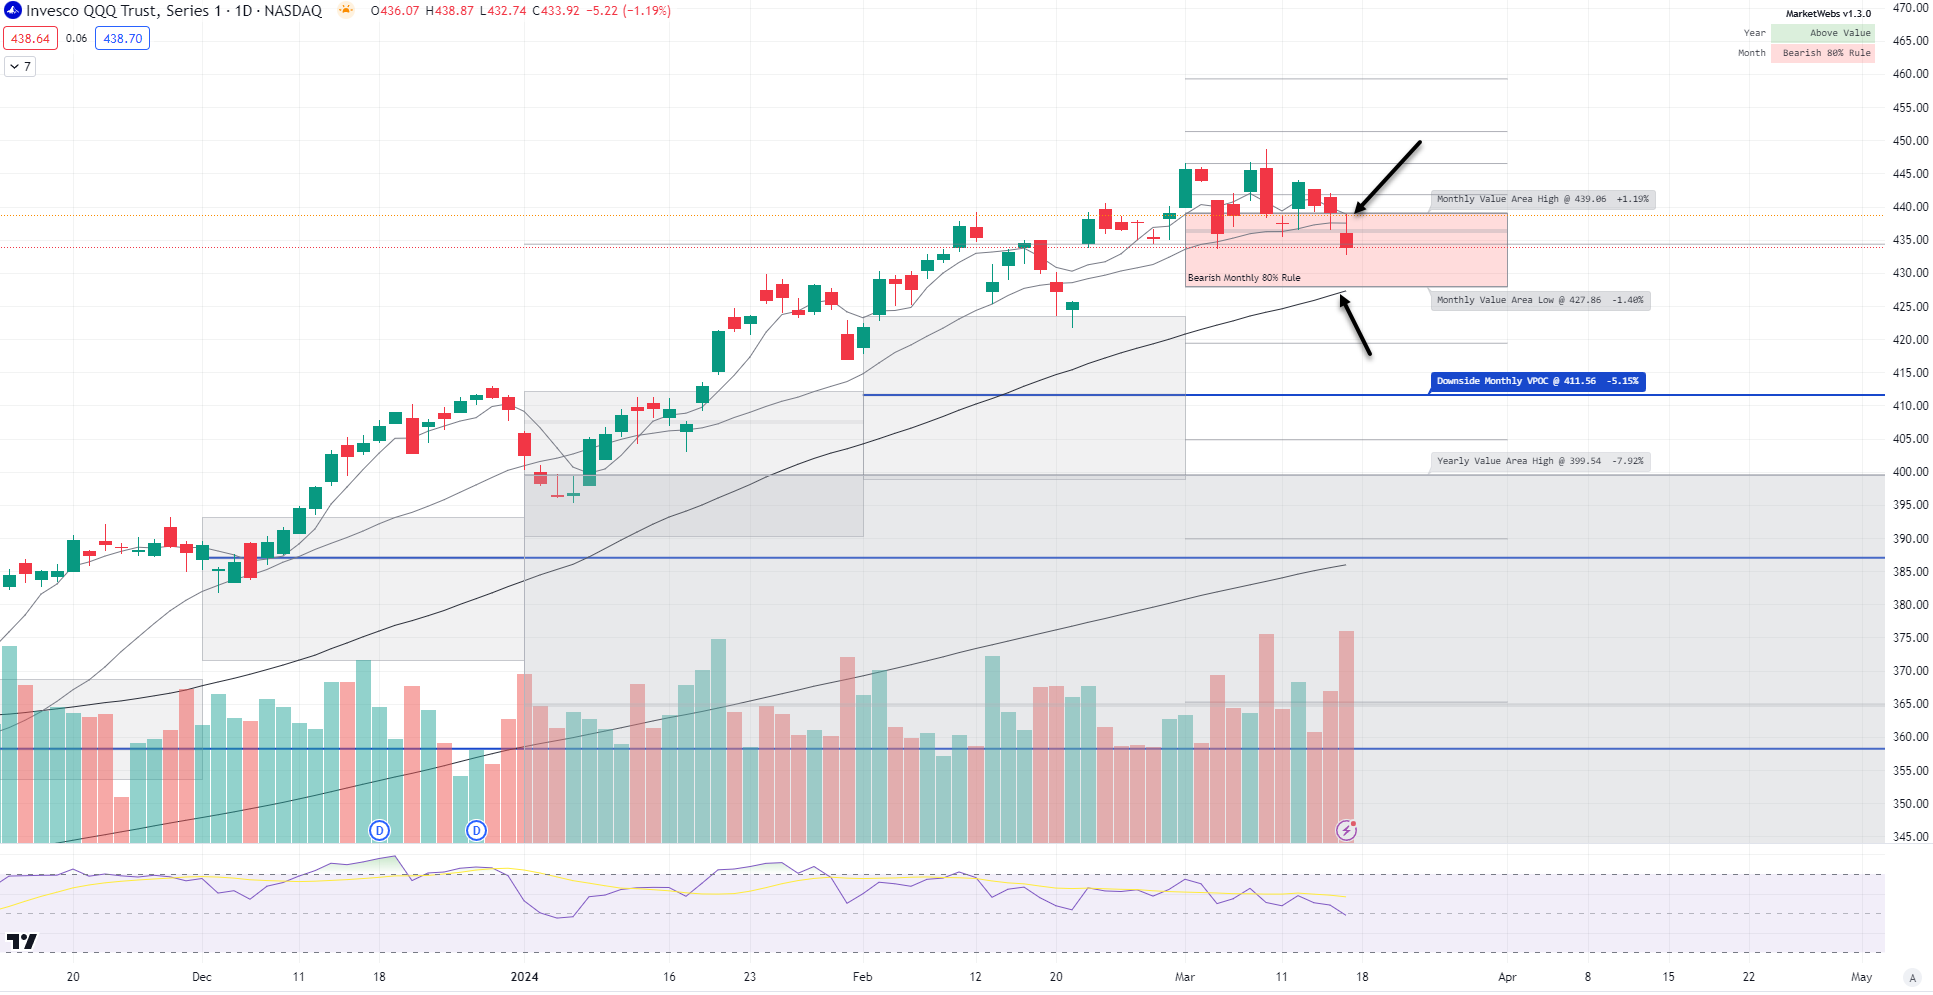
QQQ - NDX 100 ETF - Daily chart: Big move premkt with QQQ ind. +1.2% with GOOGL +5.3% and NVDA +2.8% responsible for a good portion of premkt gains. It will be interesting to see if price can retake its Mar Value Area, level to watch is $439.06 and that would cancel the bearish 80% rule.
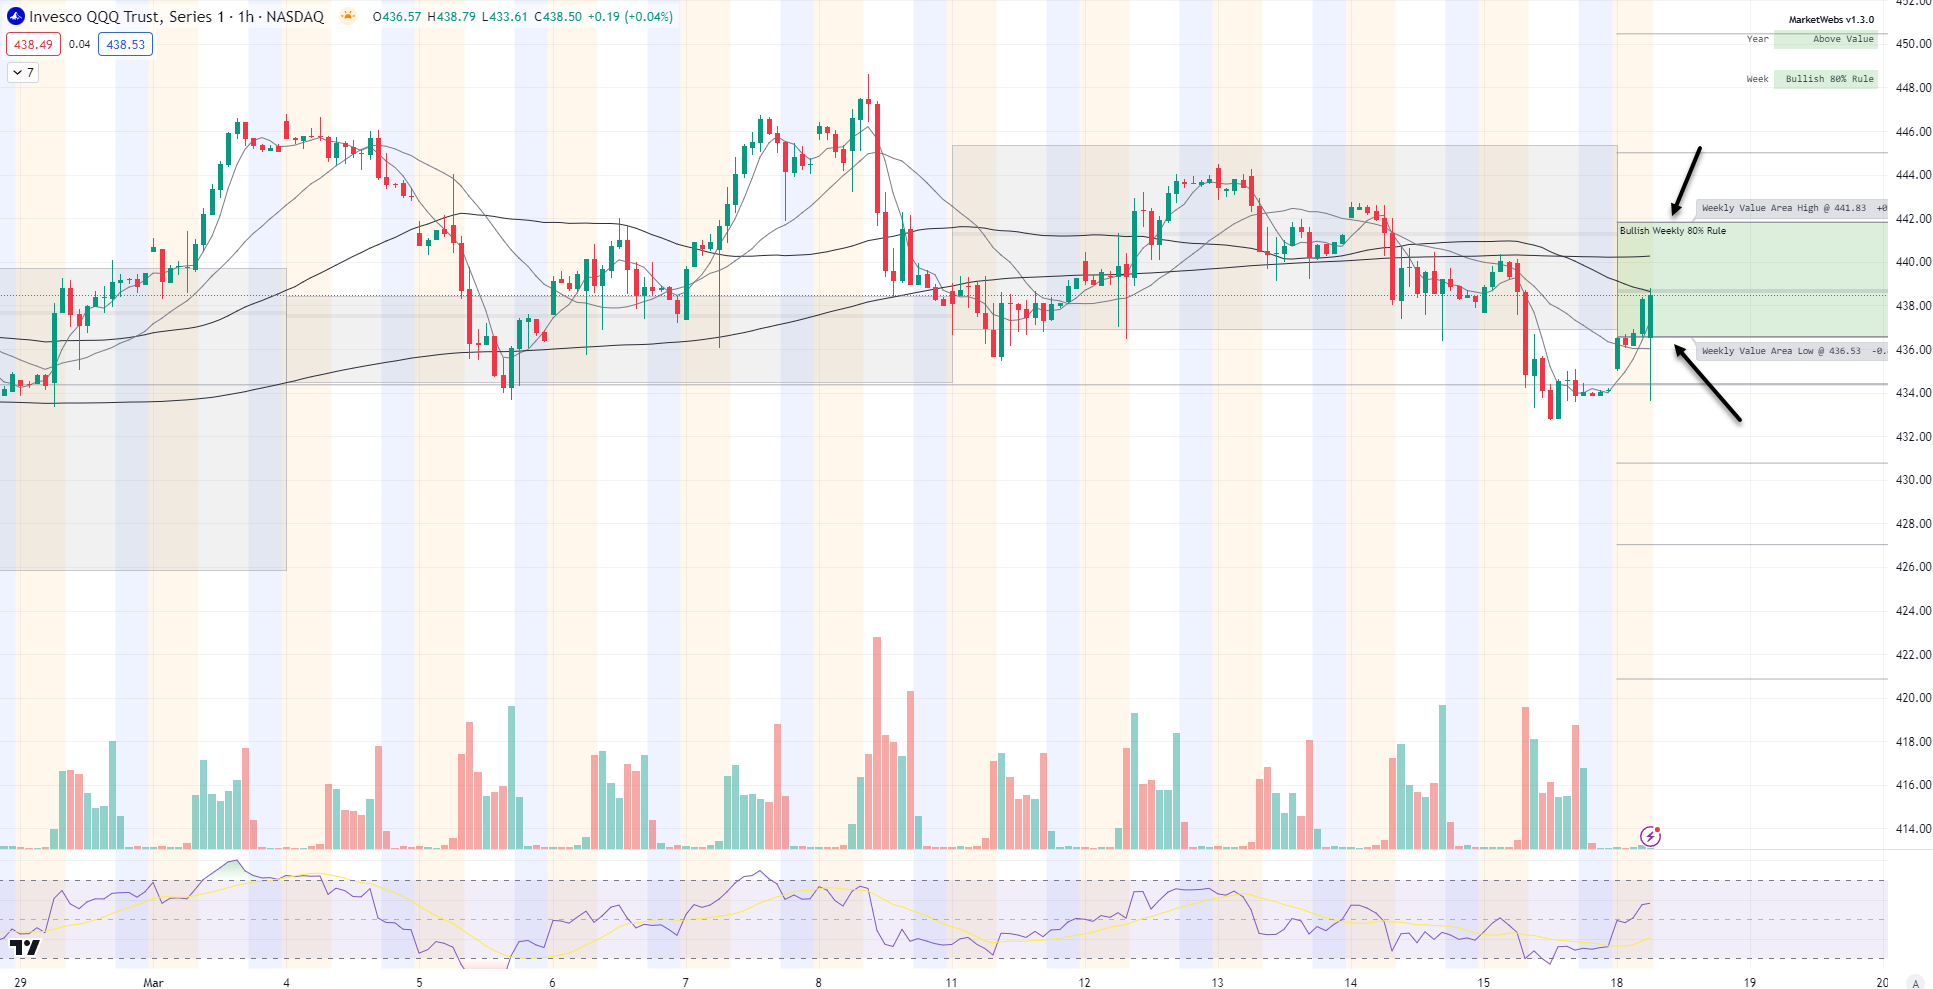
1hr chart: Price is inside its new Value Area for the week, and the #bullish 80% rule is in effect, resistance to watch $441.83
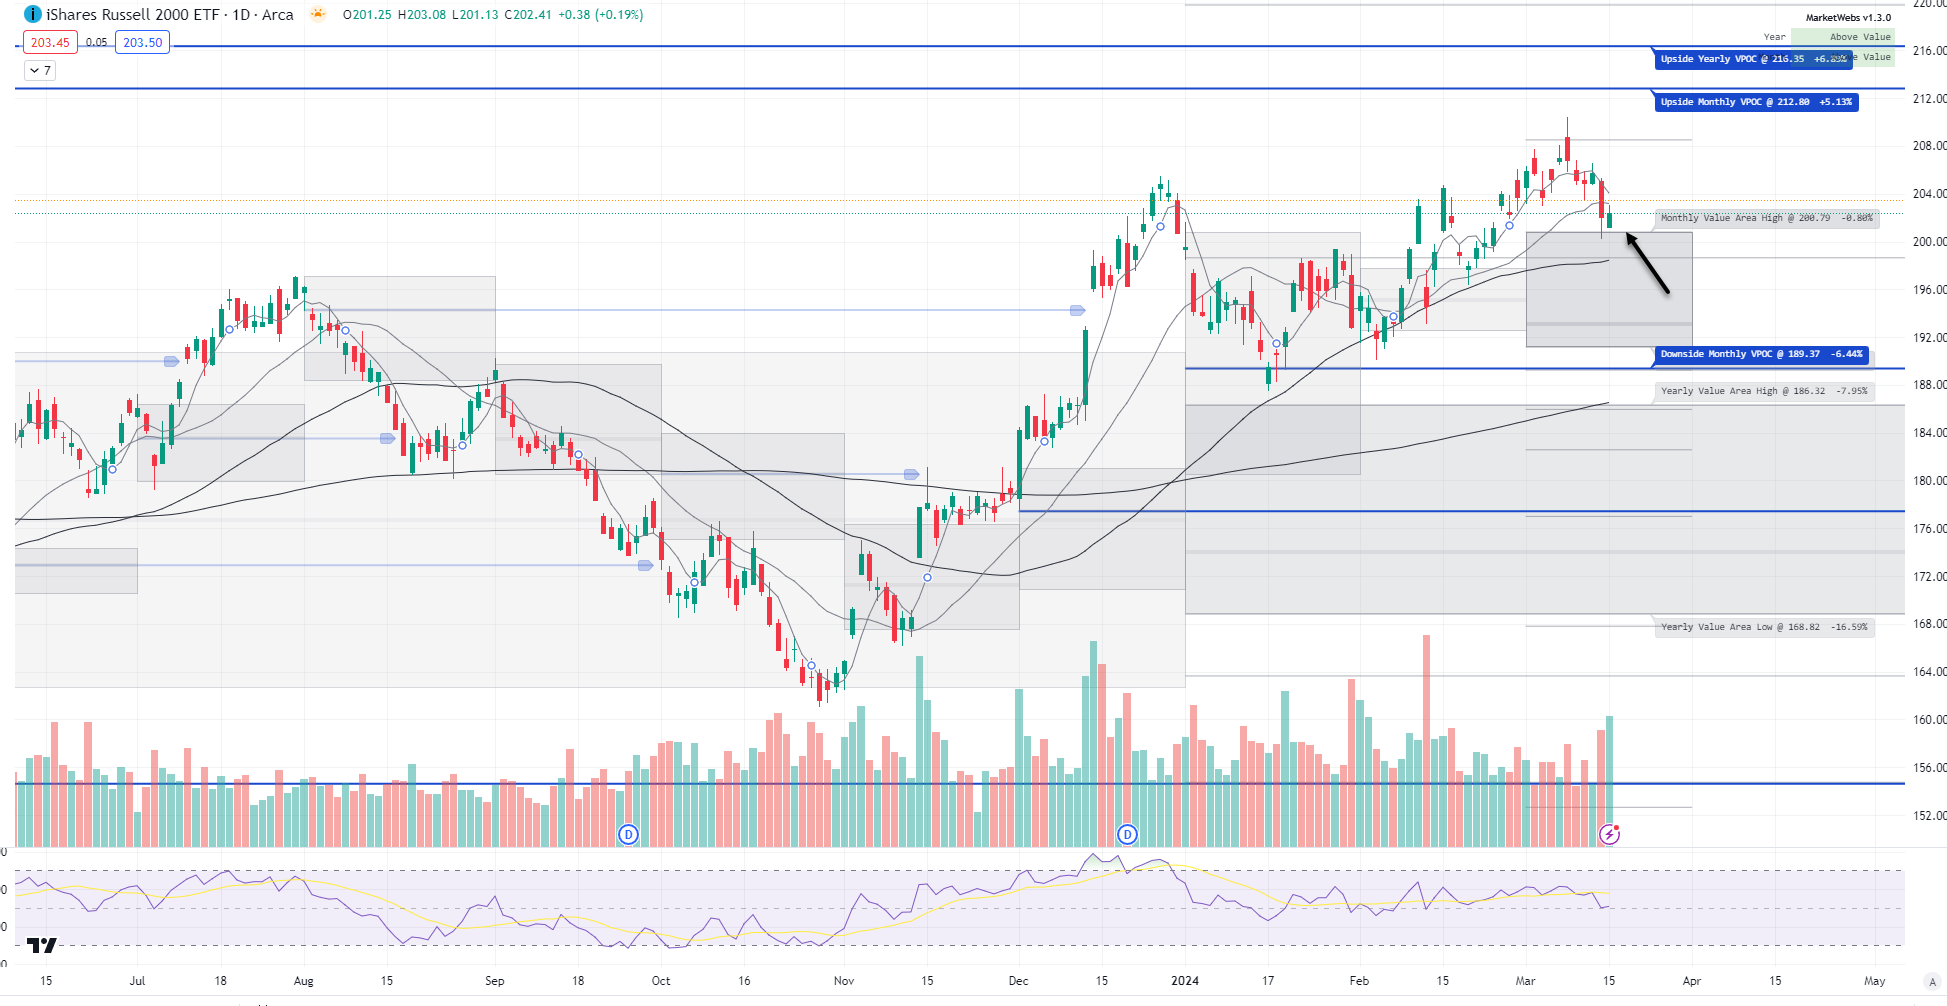
IWM - Russell Small Cap ETF- Price ind. +0.5% and bounced on Friday at the top of the Mar Value Area, support to watch $200.79
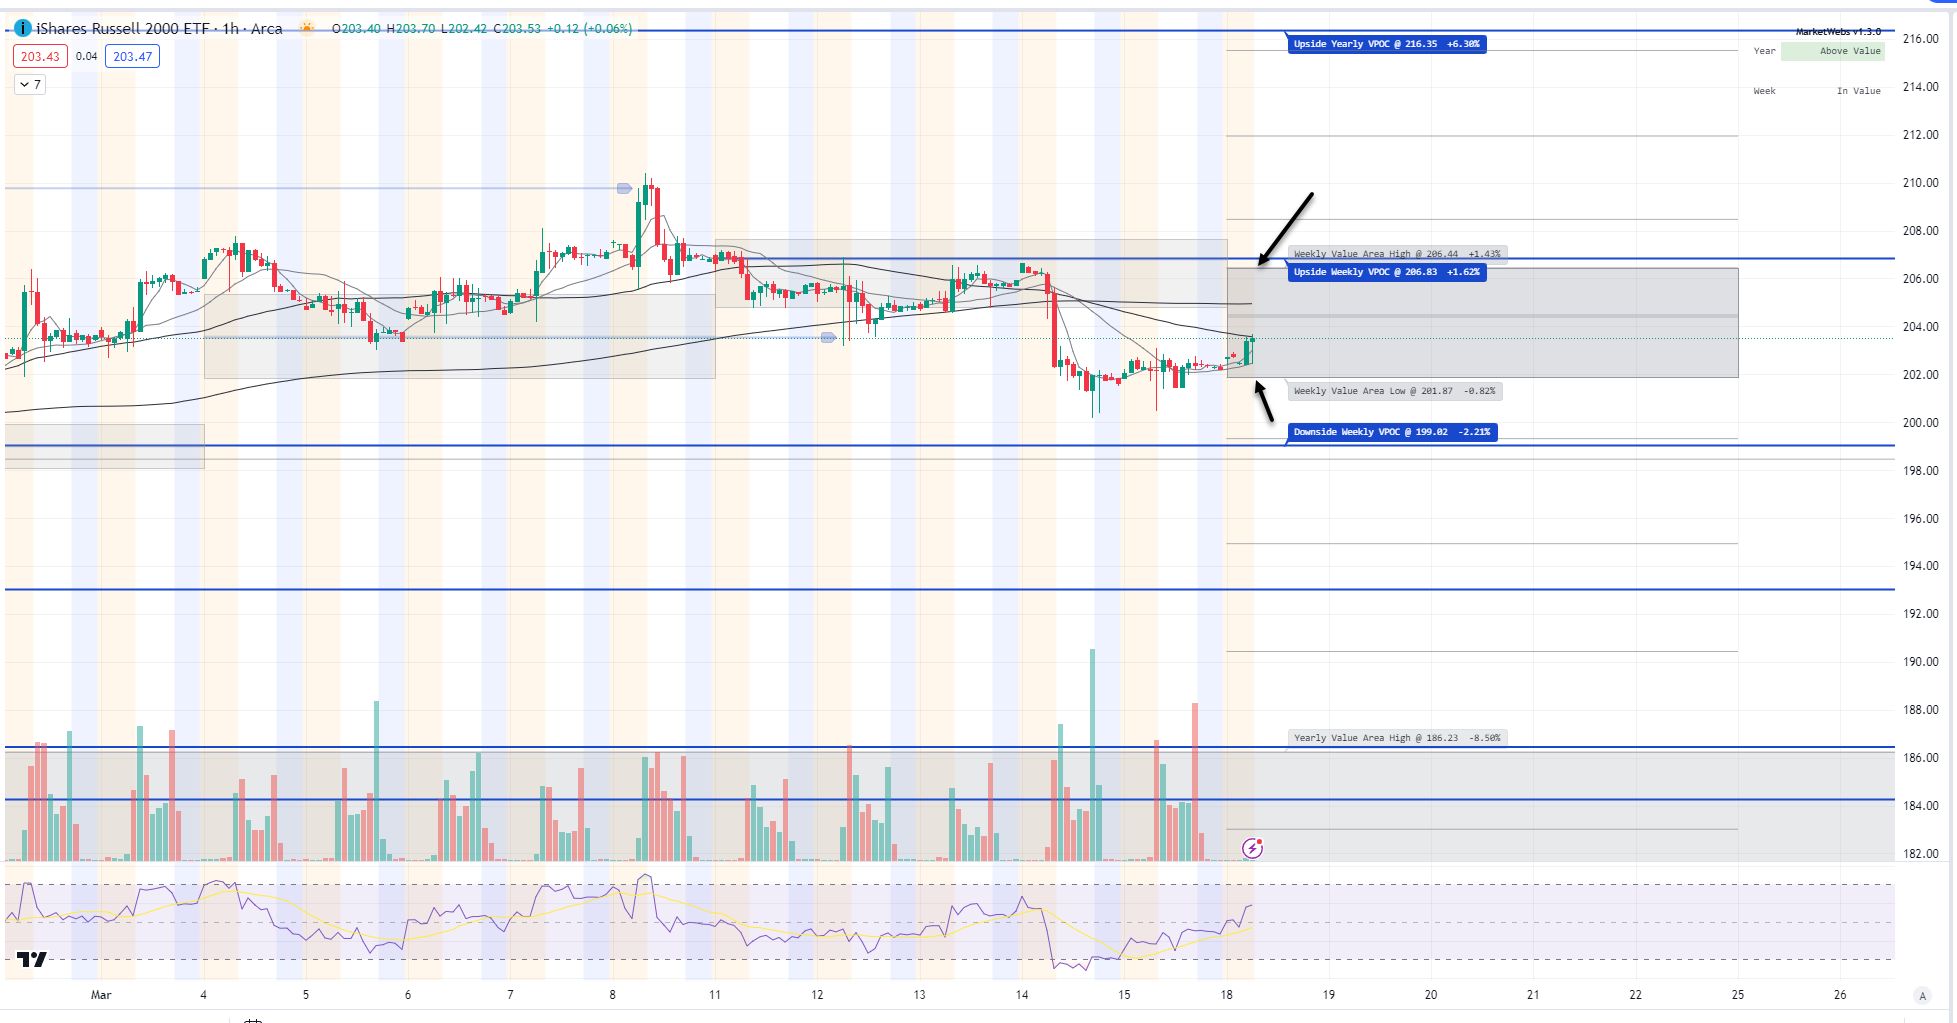
1hr chart: Price starts the week inside its new Value Area, levels to watch below
Here is today’s TTG Proprietary Stock Screen “Out of the Box” using Volume At Price
names trending above their Value Areas (on 3 multiple timeframes & not super extended)
Keep reading with a 7-day free trial
Subscribe to The Tribeca Trade Group to keep reading this post and get 7 days of free access to the full post archives.