

TTG Index Charts & Out of the Box Stock Screen 3/5/24 $CARR
TTG Index Charts & Out of the Box Stock Screen 3/5/24 $CARR
Out of the Box MarketWebs Screen
US Dollar flat / 30yr Bonds +0.47% / Crude -1.1% & Nat Gas -1.0% / Gold +0.4% / Copper -0.3% / BTC flat
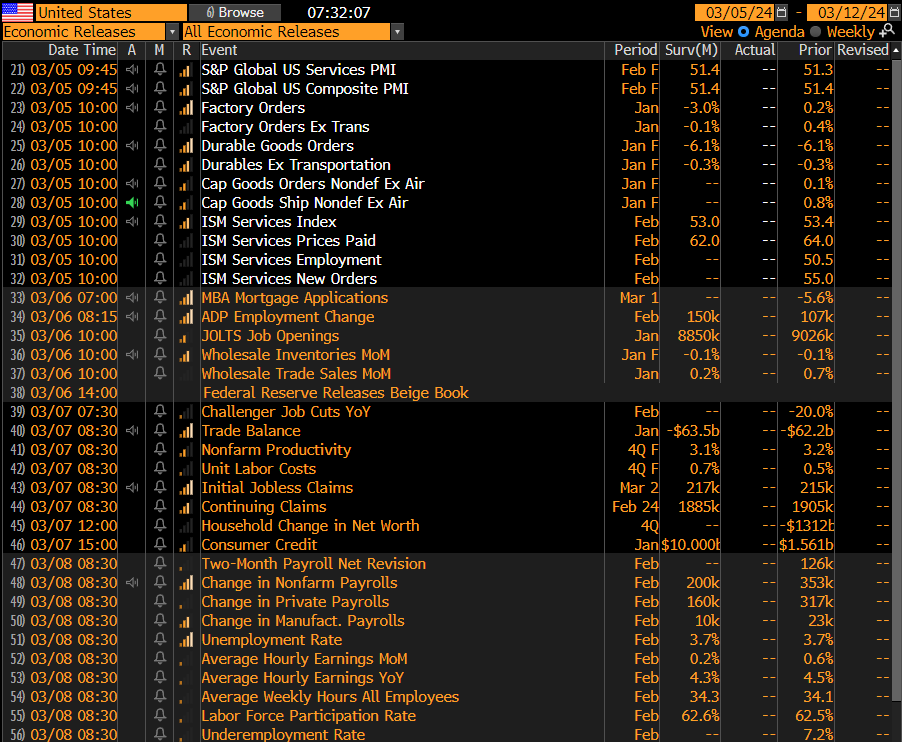
US Upcoming Economics
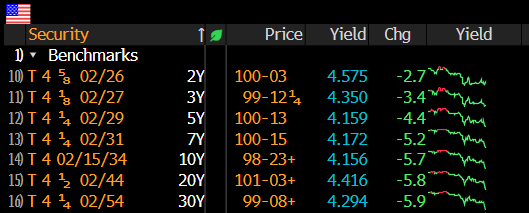
US Bond Yields
Index Updates
At TTG, I use Volume At Price in my chart analysis and I use the MarketWebs Indicator to provide Value Areas & VPOCs which indicate significant support & resistance levels. Learn More Here about Volume At Price and the MarketWebs.
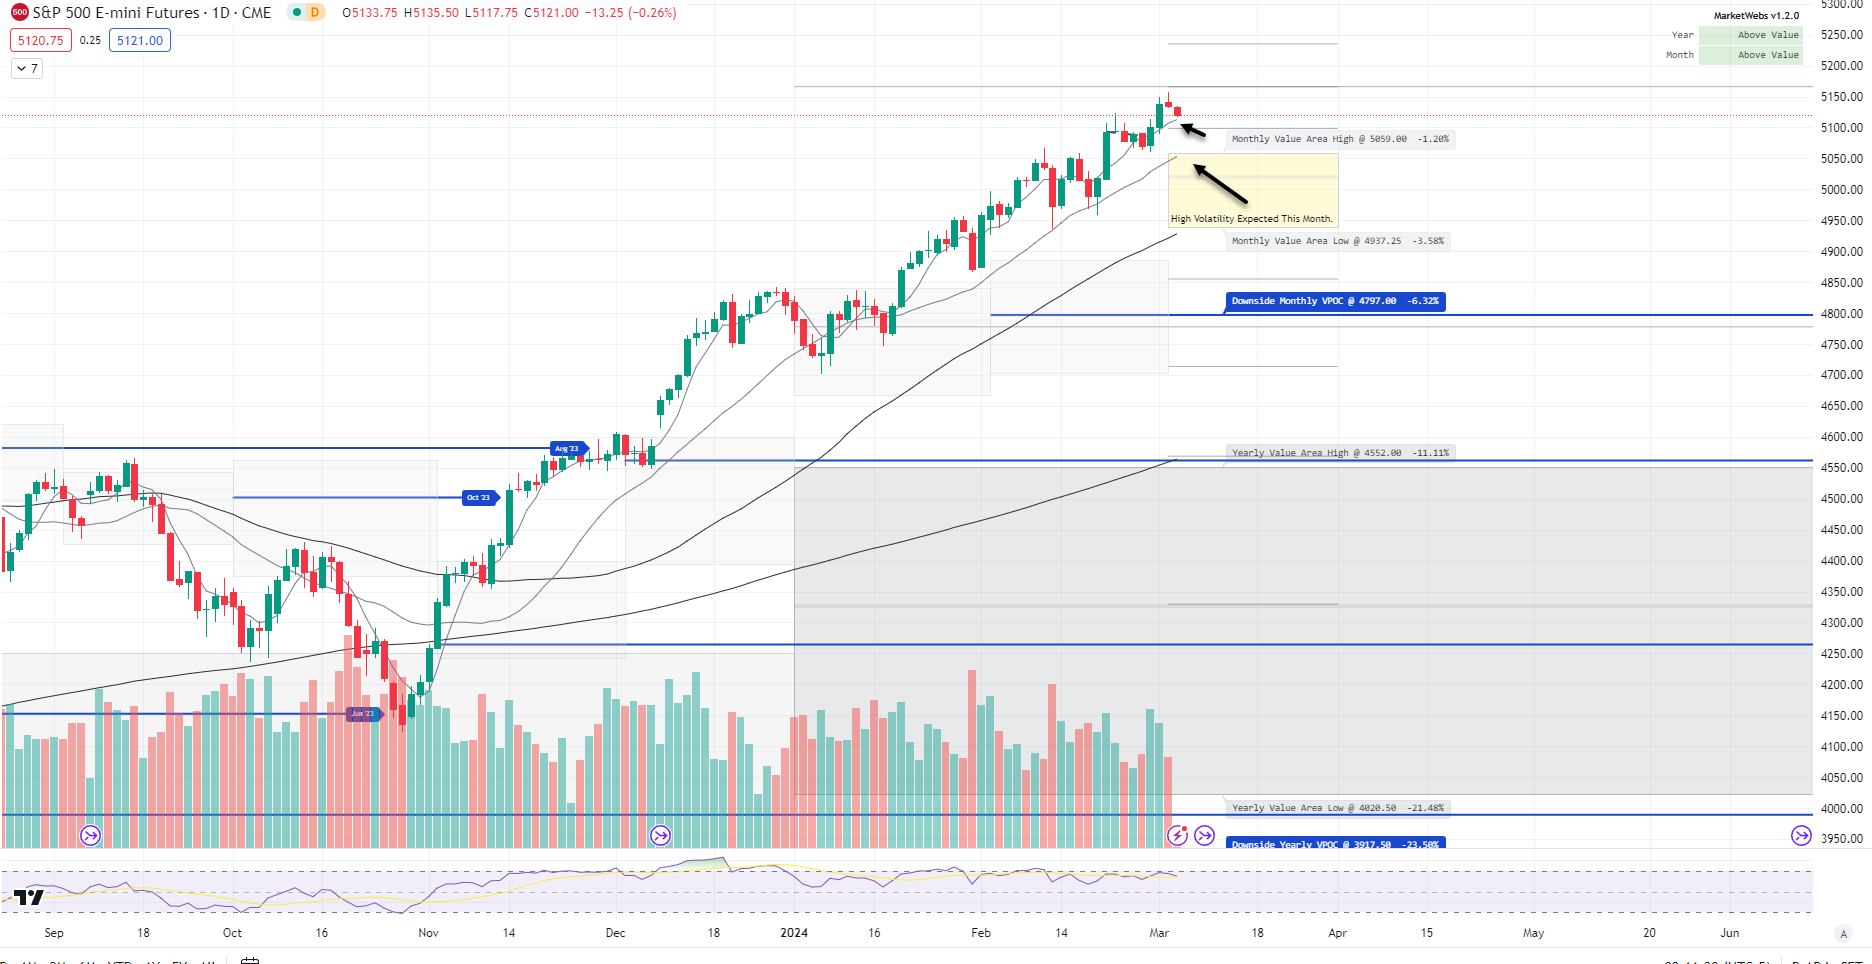
ES_F - SPX Futures - Price ind. -0.3% and coming down to its 5d MA (Moving Average). Note, if the 5d MA does not hold, the next area down I am watching is both its 20d MA and top of March Value Area, 5059
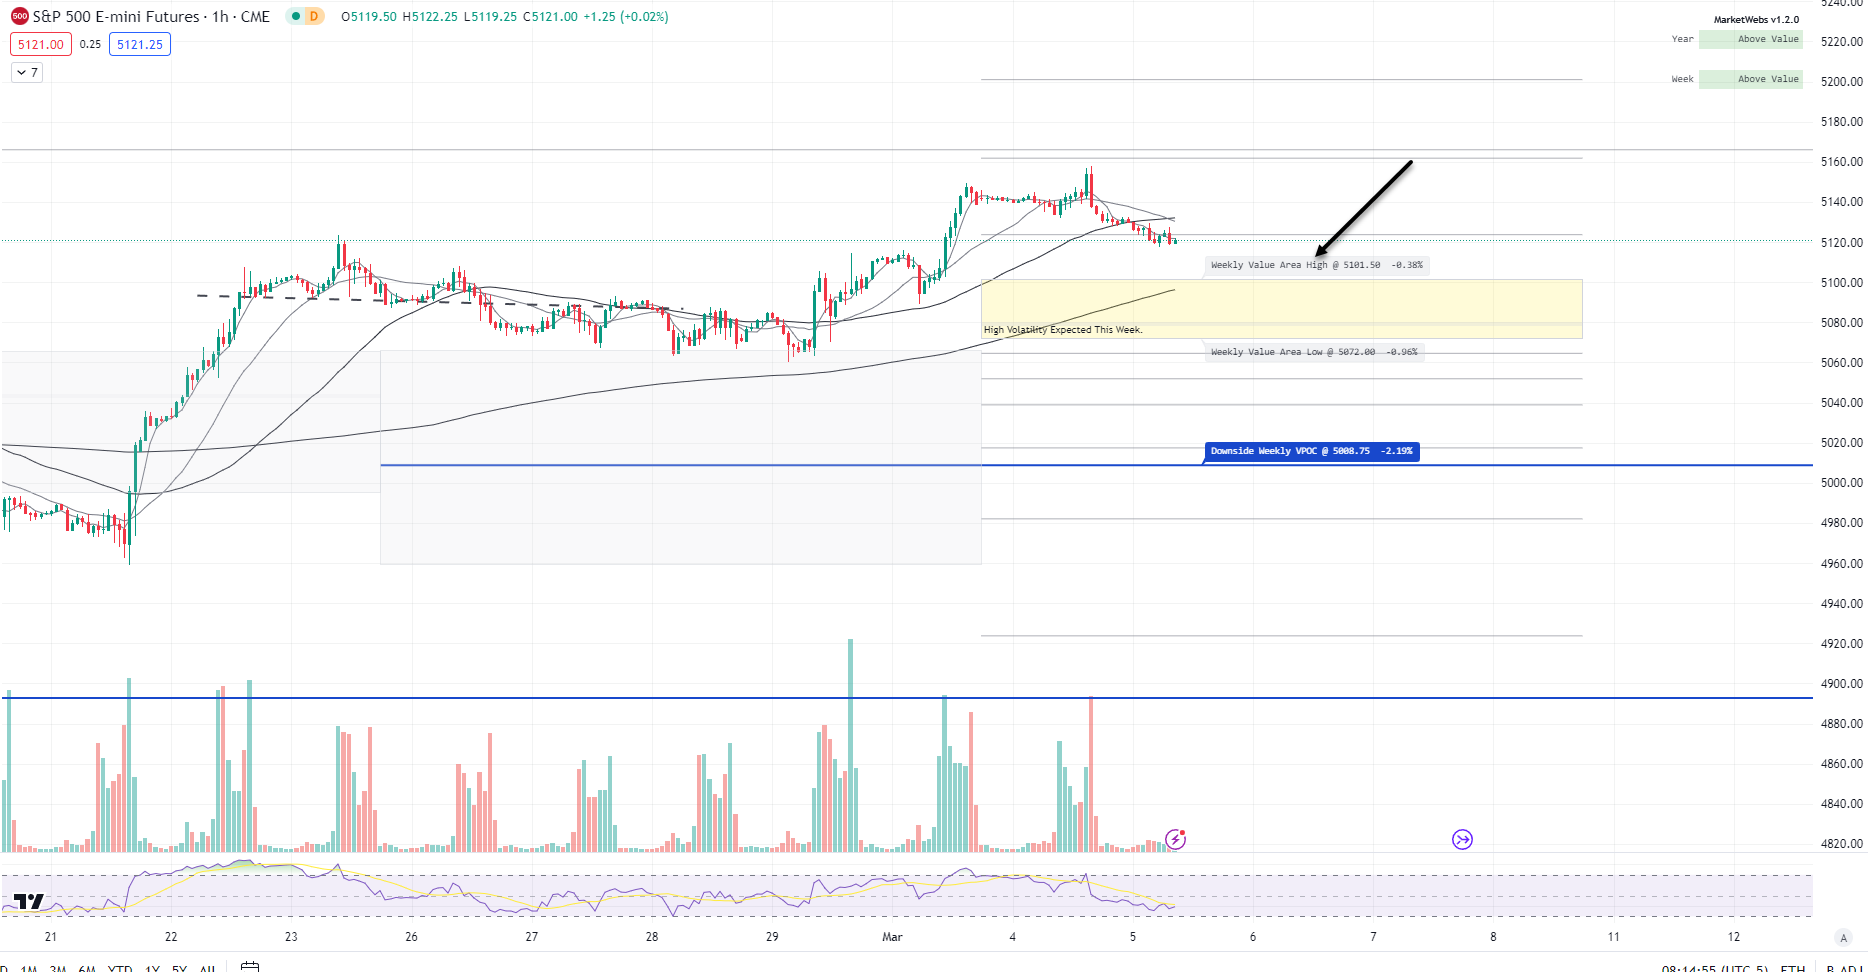
1hr chart: Price is currently above its Value Area for the week, 1st level of support to watch is 5101
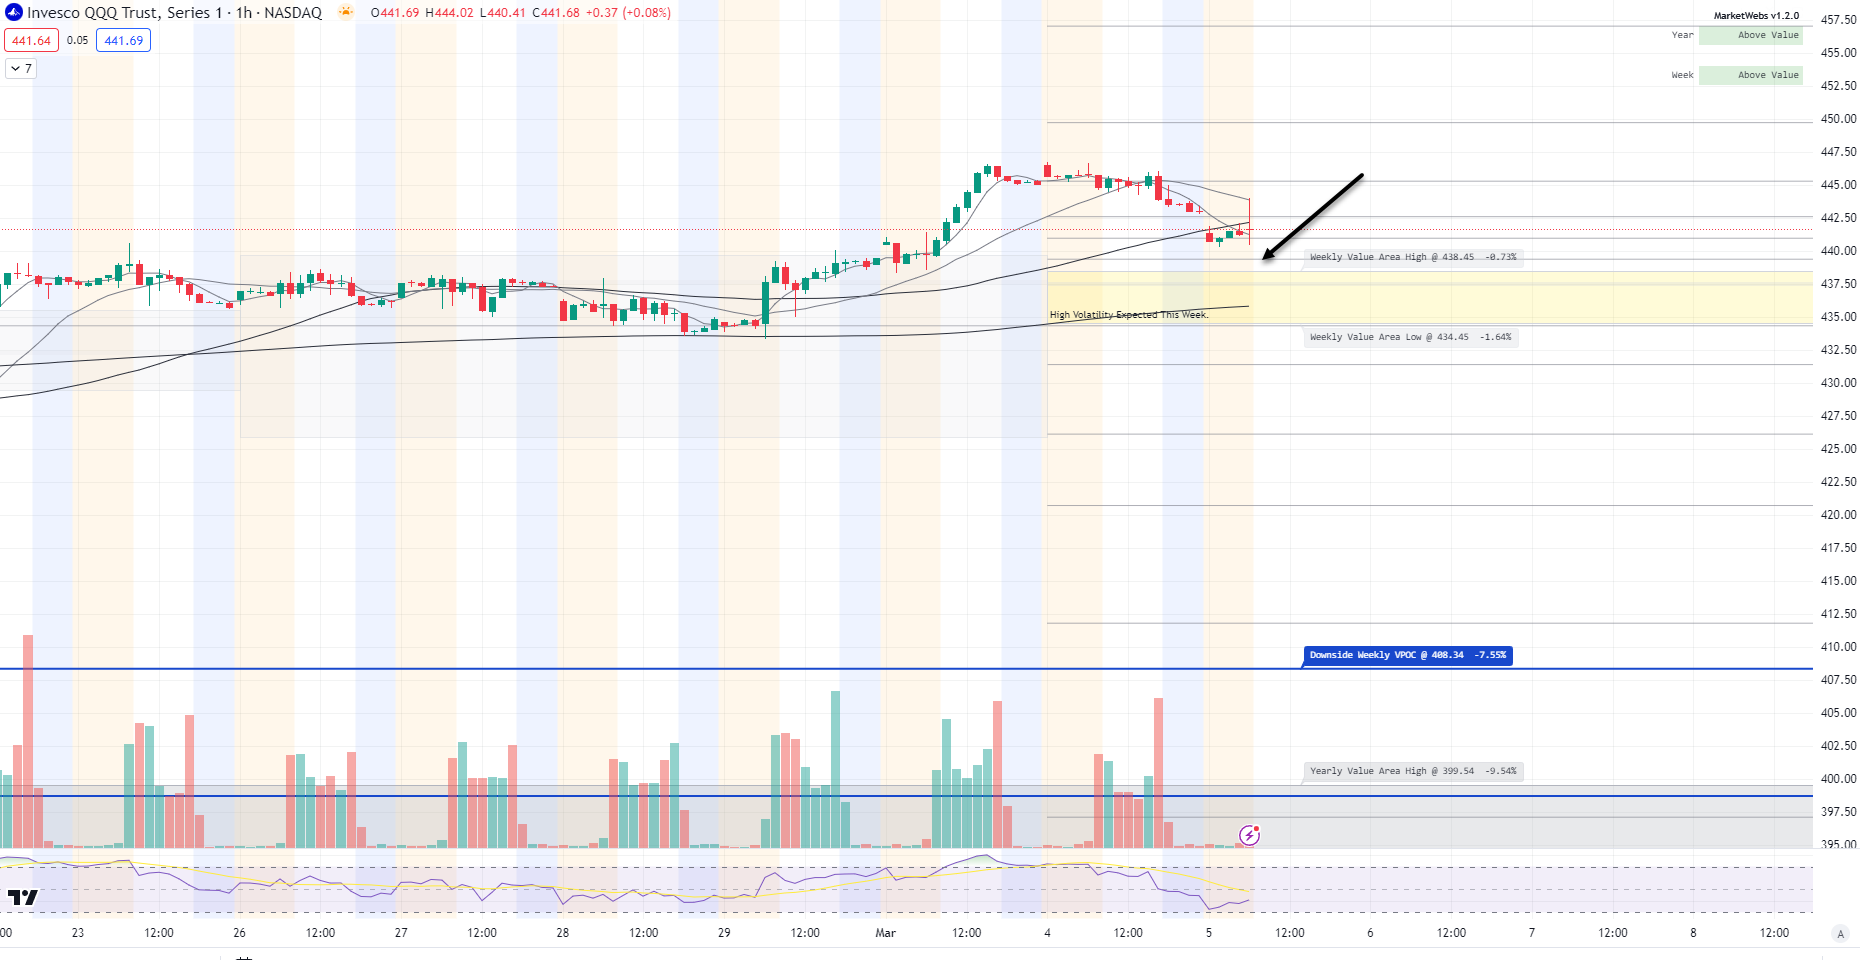
QQQ - NDX 100 ETF - Daily chart: Price ind. -0.5% this morning with AAPL and TSLA weighing on the NDX Index. Support to watch is $439 top of March Value Area

1hr chart: Price is currently above its Value Area for the week, support to watch is $438.45 on the one hour timeframe
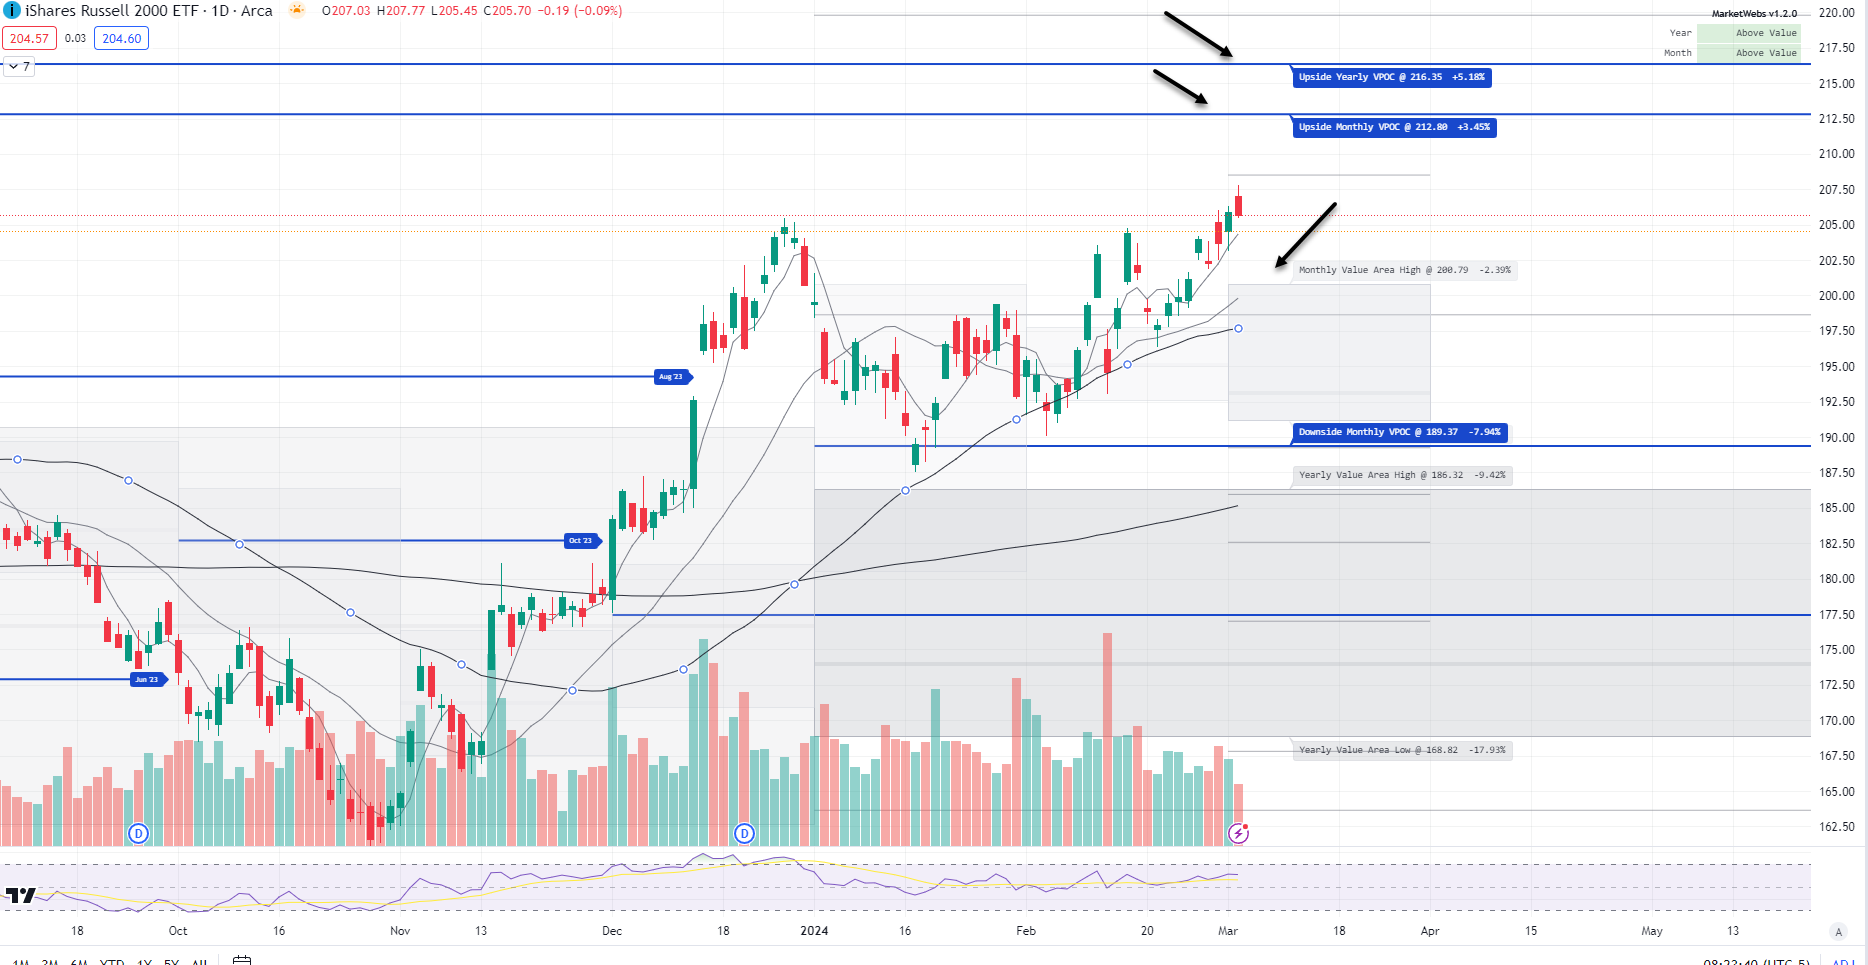
IWM - Russell Small Cap ETF- Price ind. -0.6% this morning and support is $200.79 top of its March Value Area
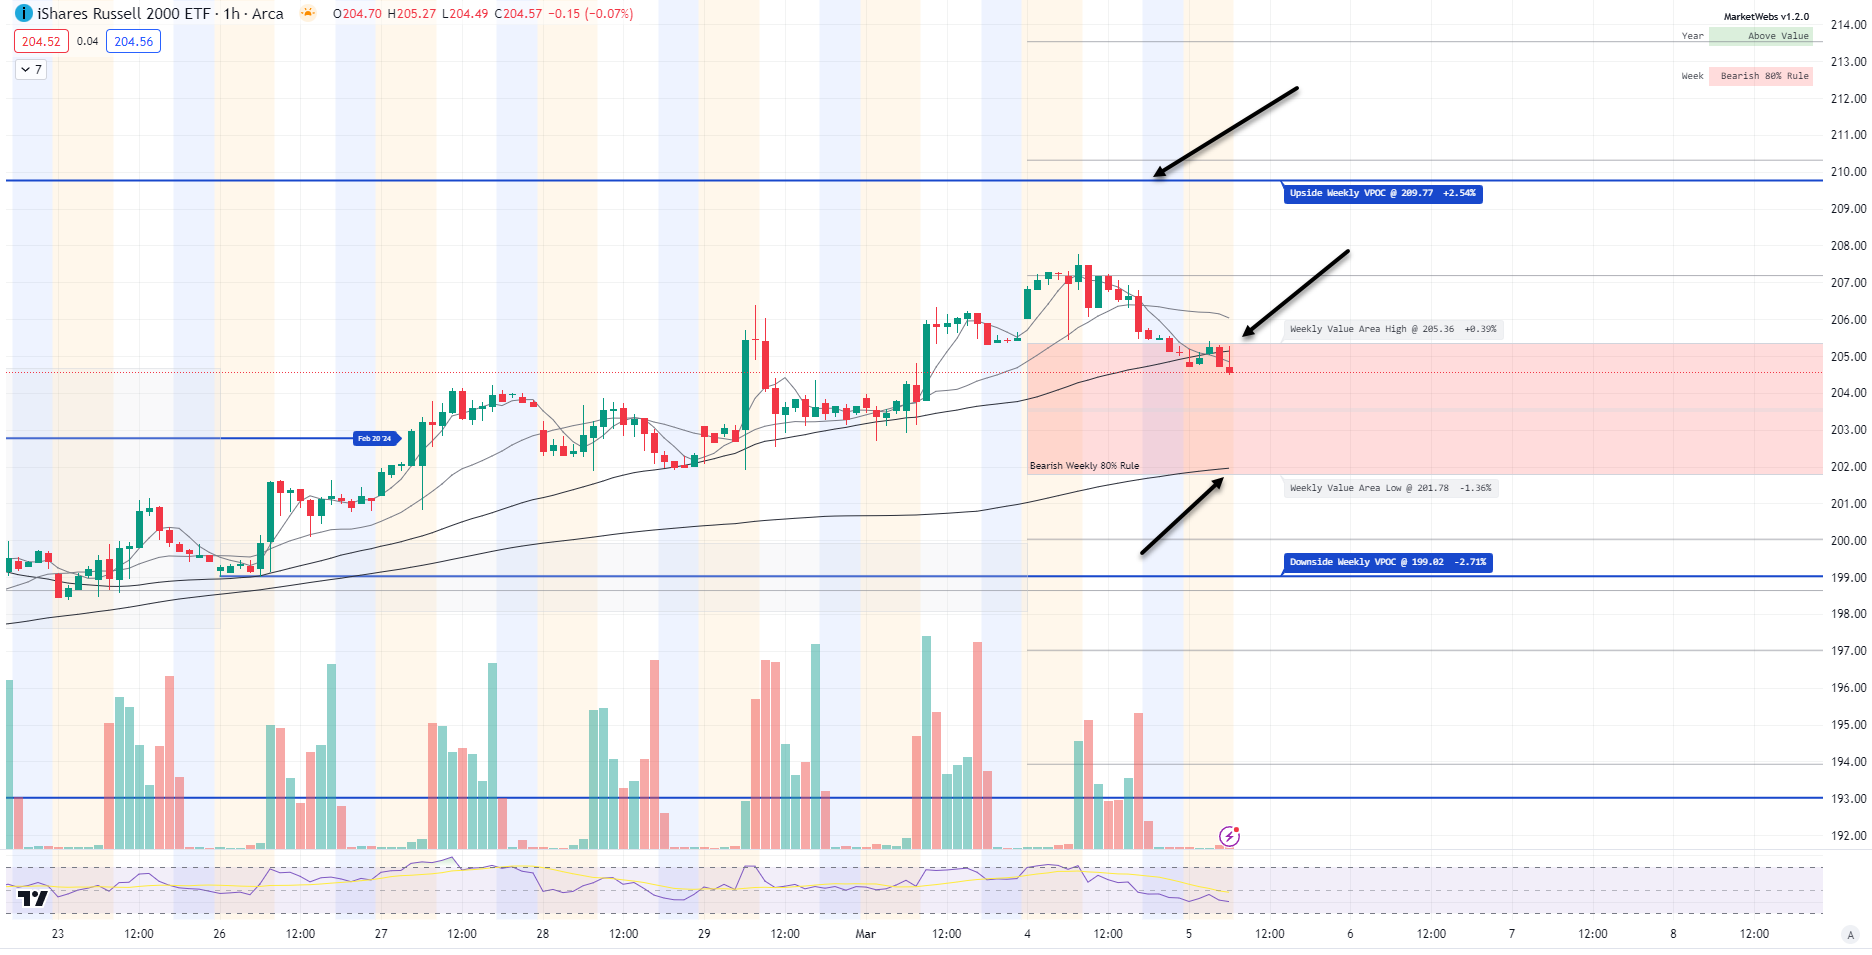
1hr chart: Price has drifted into its Value Area for the week, triggering the bearish 80% rule with support down at $201.78. The bearish 80% rule would be cancelled if price retakes its top of Value Area, watch $205.36 which is now resistance.
Here is today’s TTG Proprietary Stock Screen “Out of the Box” using Volume At Price
names trending above their Value Areas (on 3 multiple timeframes & not super extended)
Keep reading with a 7-day free trial
Subscribe to The Tribeca Trade Group to keep reading this post and get 7 days of free access to the full post archives.