

TTG Index Charts & Out of the Box Stock Screen 4/3/24
TTG Index Charts & Out of the Box Stock Screen 4/3/24
Out of the Box MarketWebs Screen
US Dollar -0.1% / 30yr Bonds -0.1% / Crude +0.9% & Nat Gas +1.0% / Gold +0.5% / Copper +1.0% / BTC +0.2%
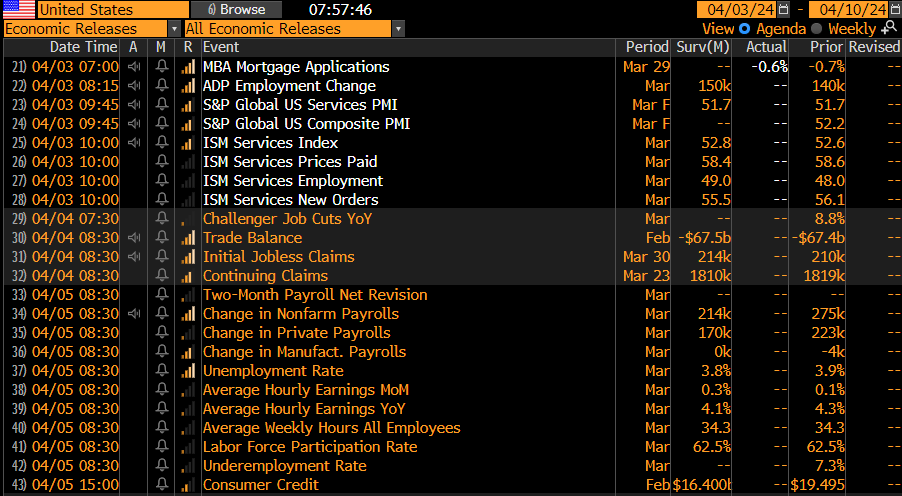
US Upcoming Economics
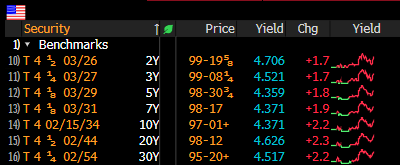
US Bond Yields
Index Updates
At TTG, I use Volume At Price in my chart analysis and I use the MarketWebs Indicator to provide Value Areas & VPOCs which indicate significant support & resistance levels. Learn More Here about Volume At Price and the MarketWebs.
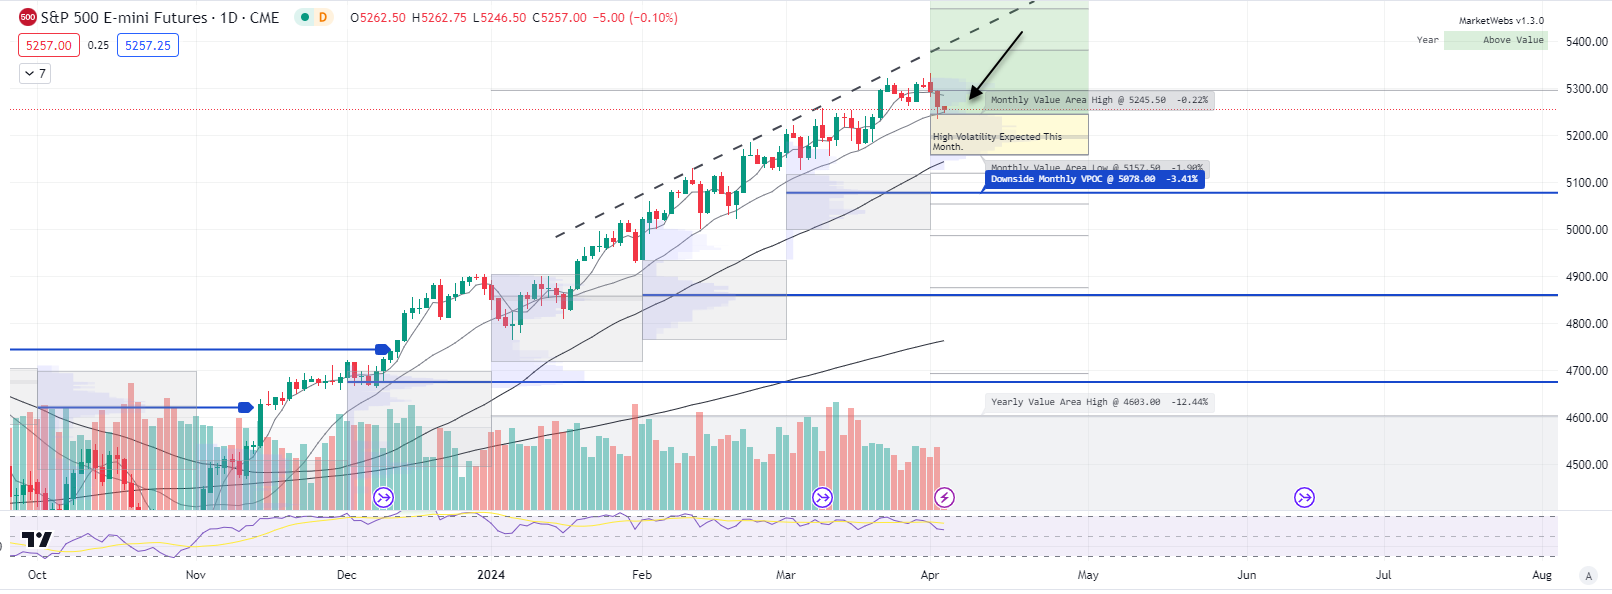
ES_F - SPX Futures - Daily chart: Prices ~ flat this morning and have an important level to watch as price testing that all important 20d MA which has held price in an uptrend channel for the better part of 3 months. The top of the April Value Area will also be important to watch , level to watch 5245.5
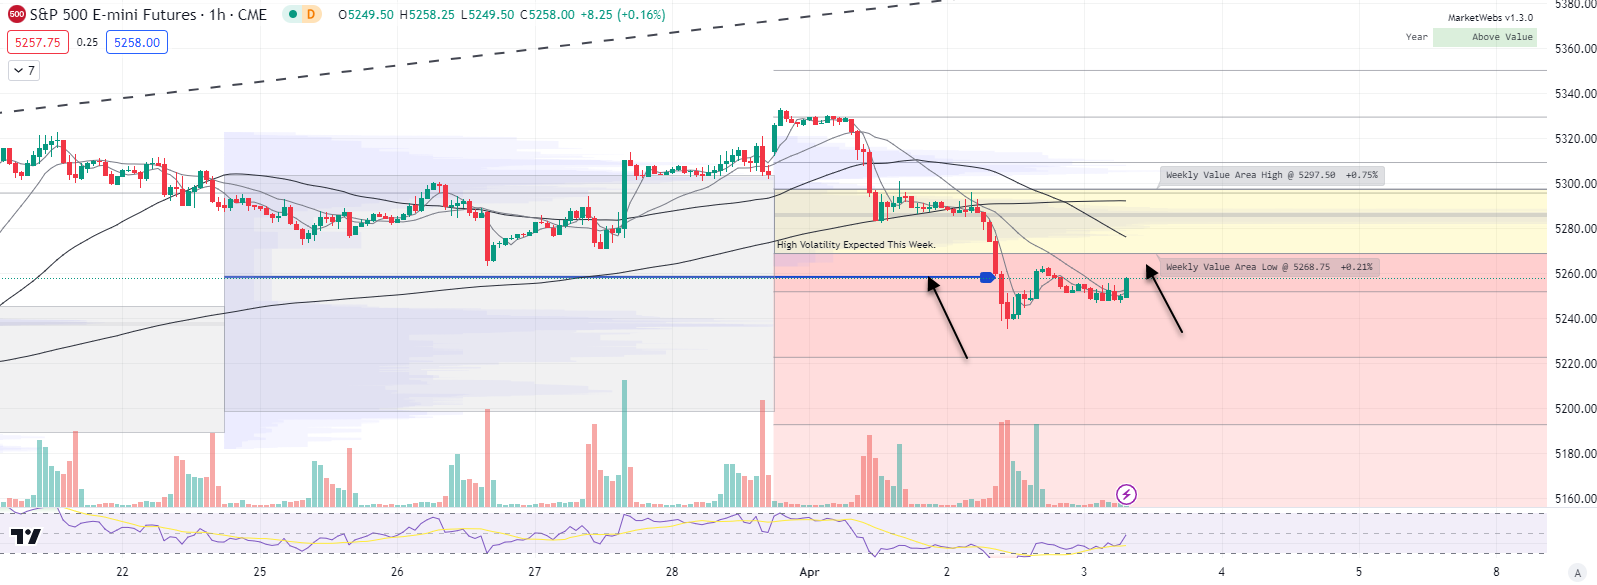
1hr chart: Price took out a downside VPOC (blue line) yesterday , but not much of a reversal off that and remains below its Value Area, watch 5268.75 bottom of Value Area
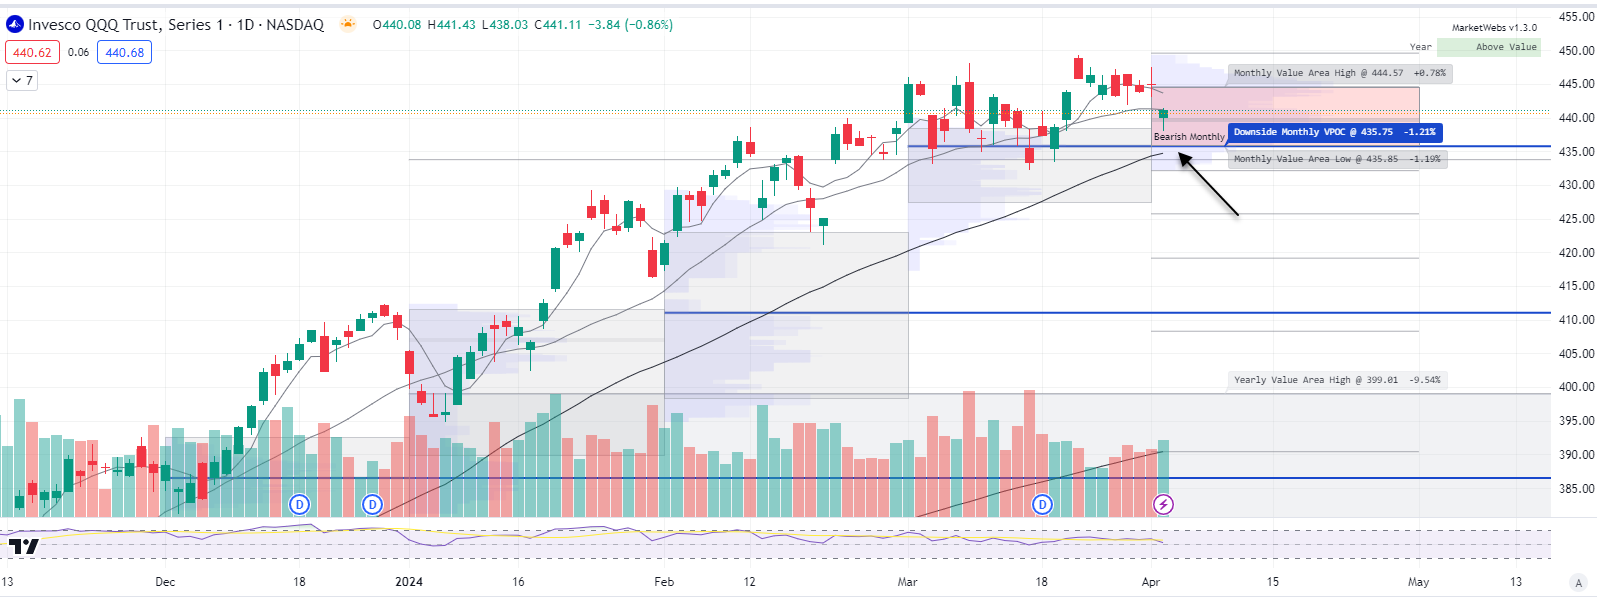
QQQ - NDX 100 ETF - Daily chart: Price ind. -0.1% and a different picture than he S&P as price is already broken into its April Value Area & the bearish 80% rule is in effect looking for a move down to $435.85 bottom of Value Area, resistance is at $444.57
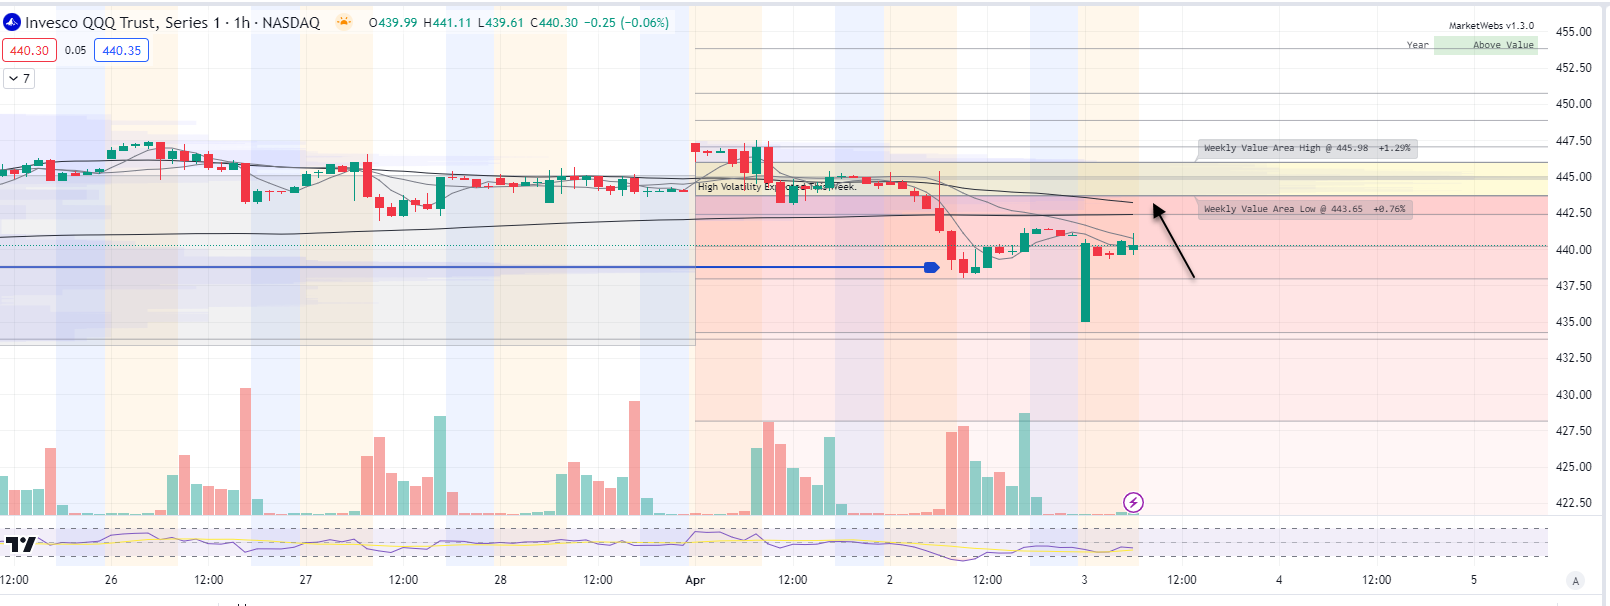
1hr chart: Downside VPOC (blue line) taken out yesterday & similar to the S&P not much of a rebound as we often see on a VPOC take out which imo is not the best sign that volatility is over with... resistance to watch is $443.65
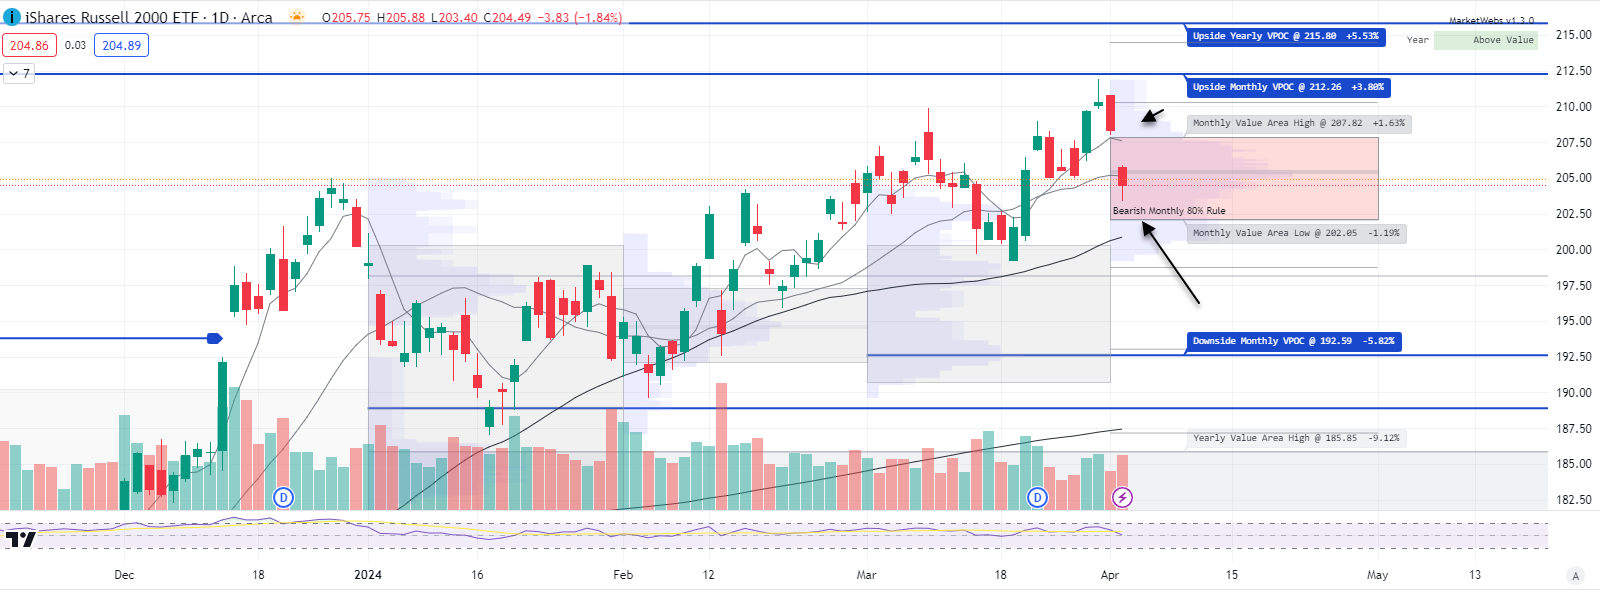
IWM - Russell Small Cap ETF- Price outperforming a touch this morning ind. +0.2%. The bearish 80% rule is in effect here looking for a move down to $202.05. Resistance is $207.82
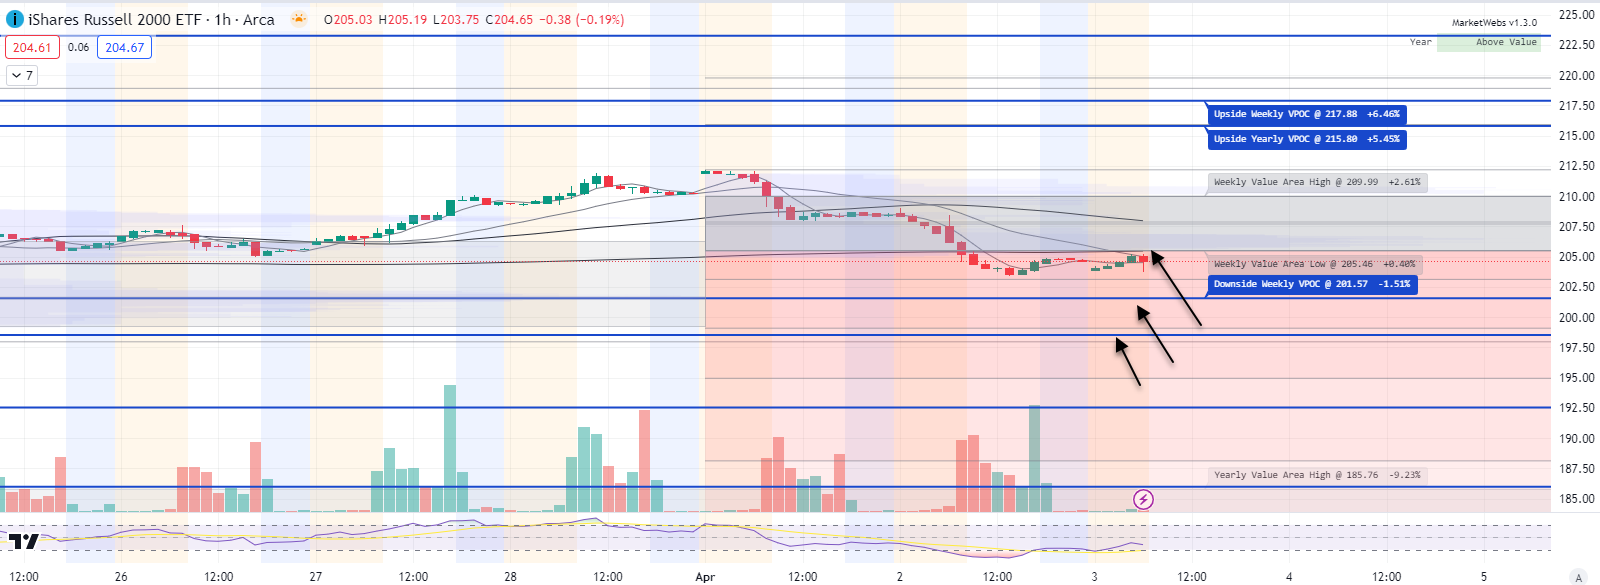
1hr chart: Price is below its Value Area for the week , resistance to watch is $205.46 and there are a series of VPOC lower
Here is today’s TTG Proprietary Stock Screen “Out of the Box” using Volume At Price
names trending above their Value Areas (on 3 multiple timeframes & not super extended)
Keep reading with a 7-day free trial
Subscribe to The Tribeca Trade Group to keep reading this post and get 7 days of free access to the full post archives.