

TTG Index Charts & Out of the Box Stock Screen 3/7/24 $TOST
TTG Index Charts & Out of the Box Stock Screen 3/7/24 $TOST
Out of the Box MarketWebs Screen
US Dollar -0.2% / 30yr Bonds +0.2% / Crude -0.3% & Nat Gas +0.7% / Gold +0.3% / Copper +1.2% / BTC -0.5%
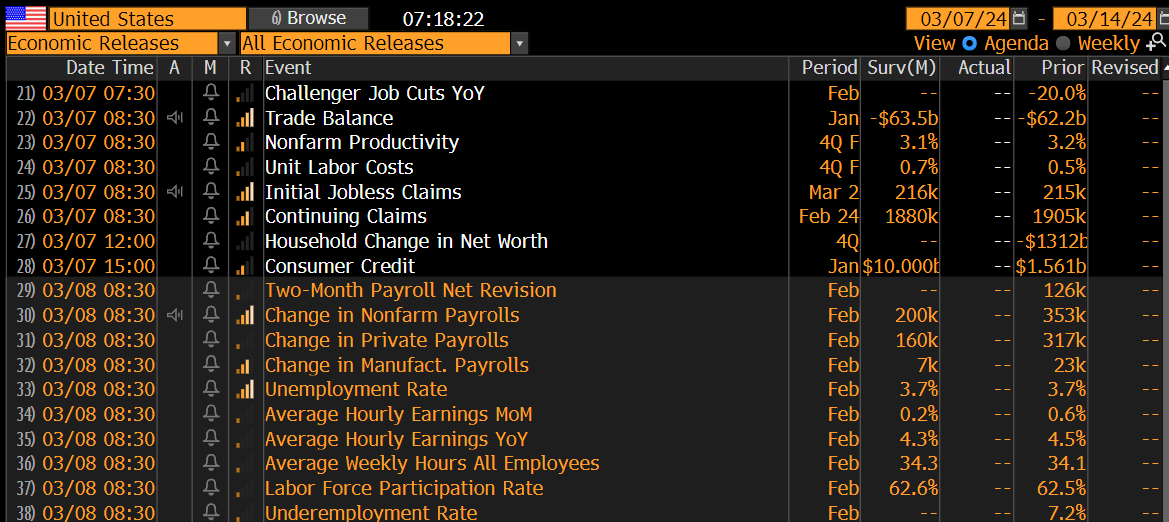
US Upcoming Economics
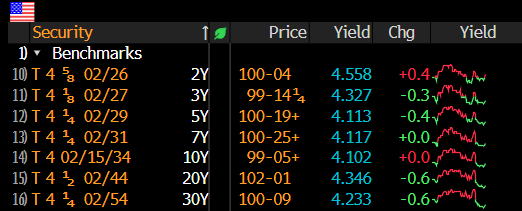
US Bond Yields
Index Updates
At TTG, I use Volume At Price in my chart analysis and I use the MarketWebs Indicator to provide Value Areas & VPOCs which indicate significant support & resistance levels. Learn More Here about Volume At Price and the MarketWebs.
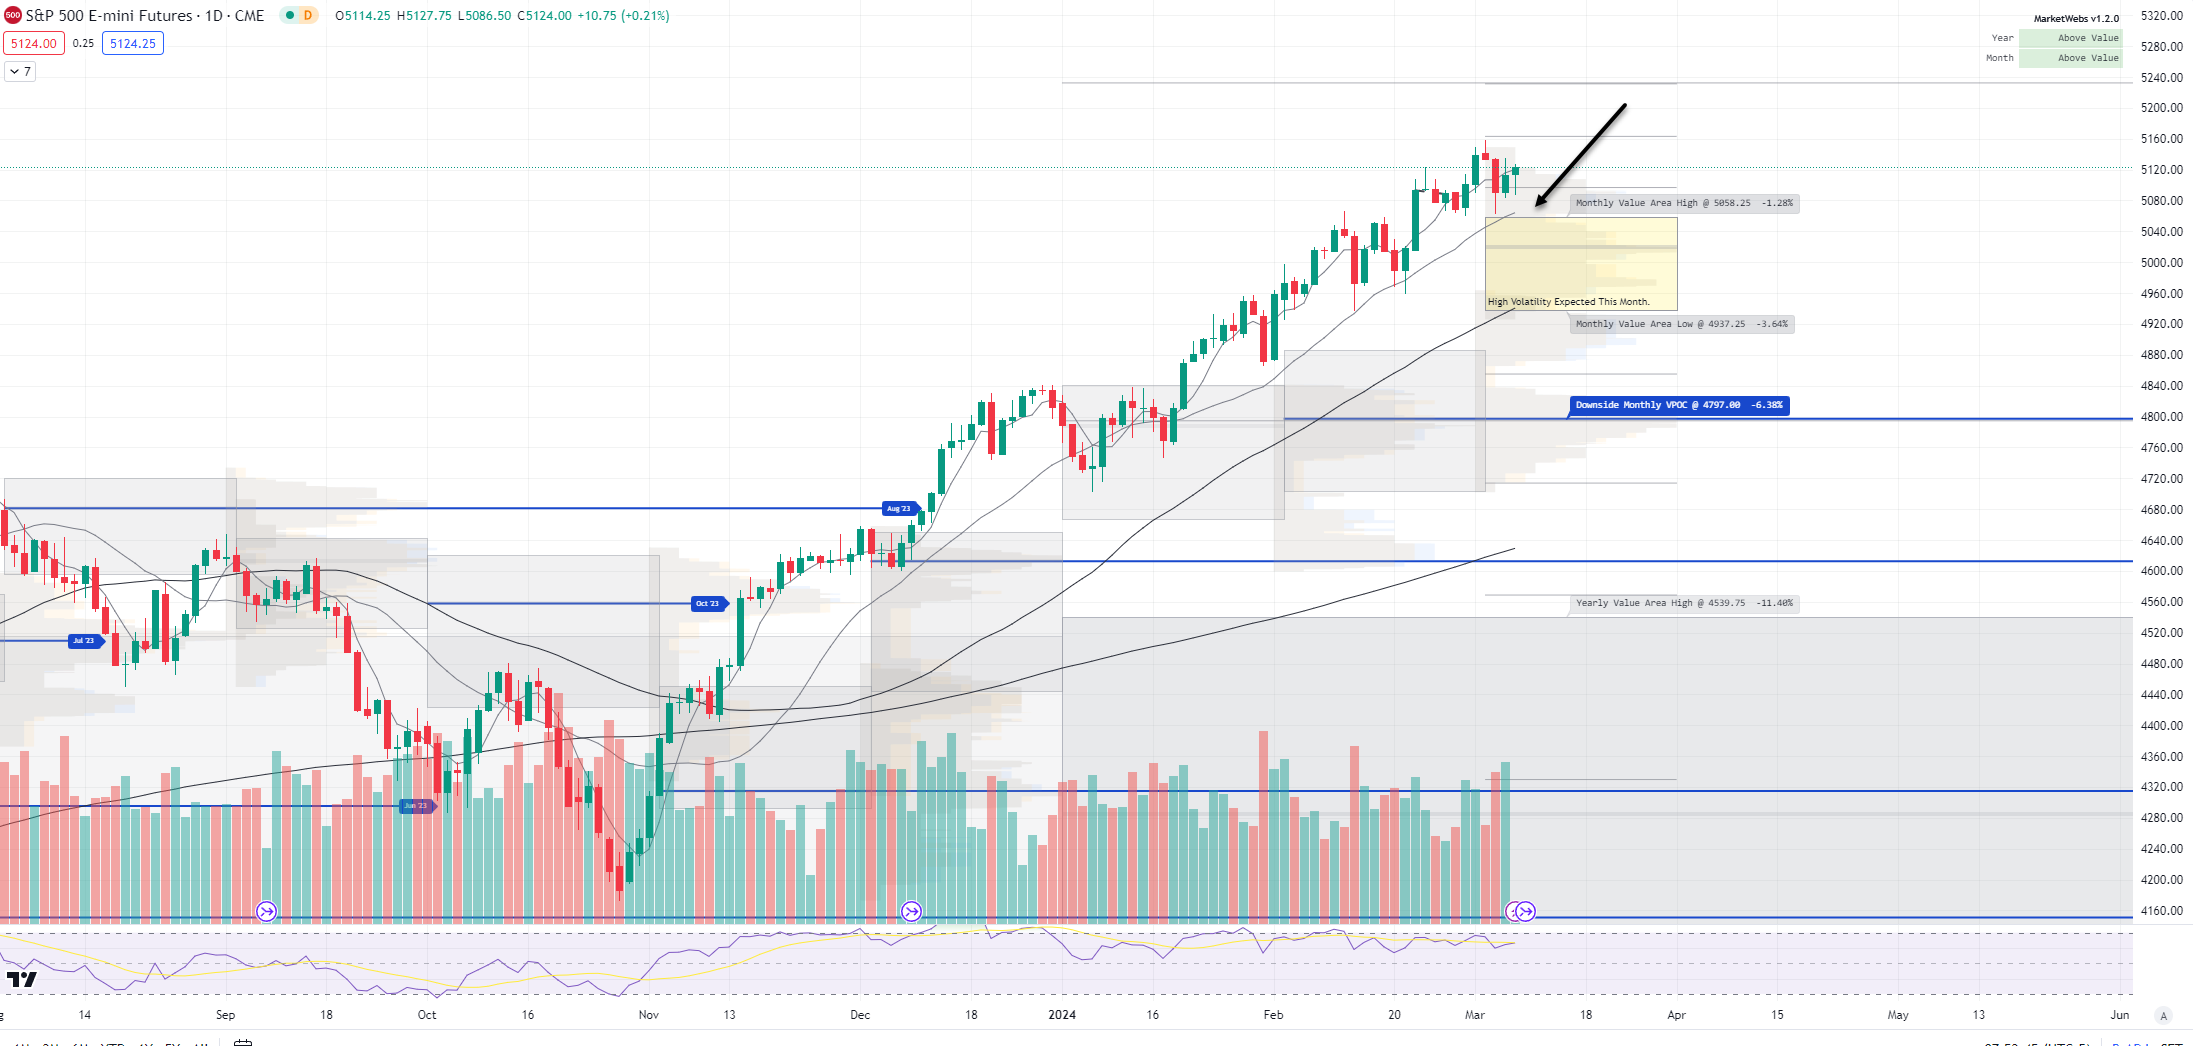
ES_F - SPX Futures - Price ind. +0.2% this morning and continues to trend above the March Value Area. Today, Powell speaks at 10am for the 2nd day of Congressional testimony
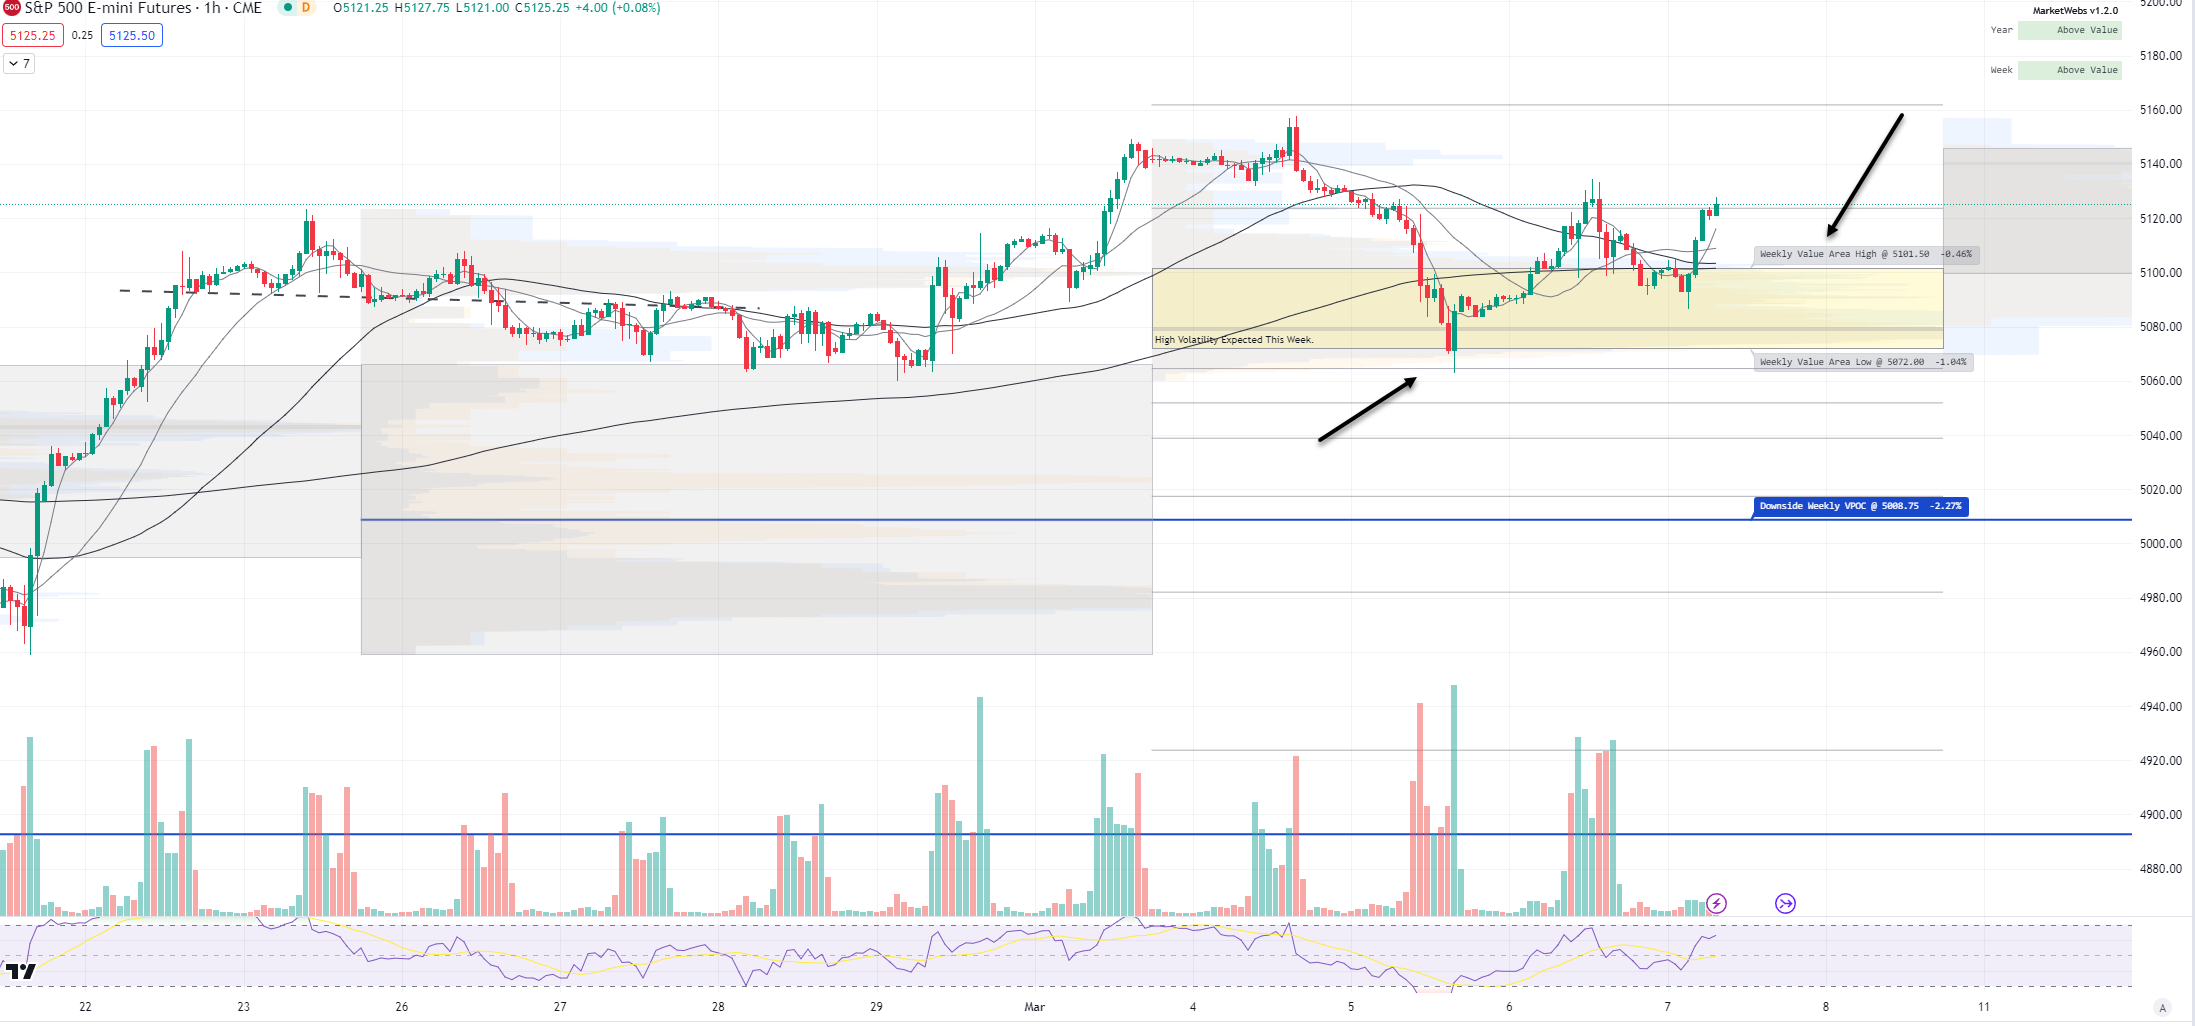
1hr chart: Price currently above its Value Area for the week - short-term support to watch remains 5101
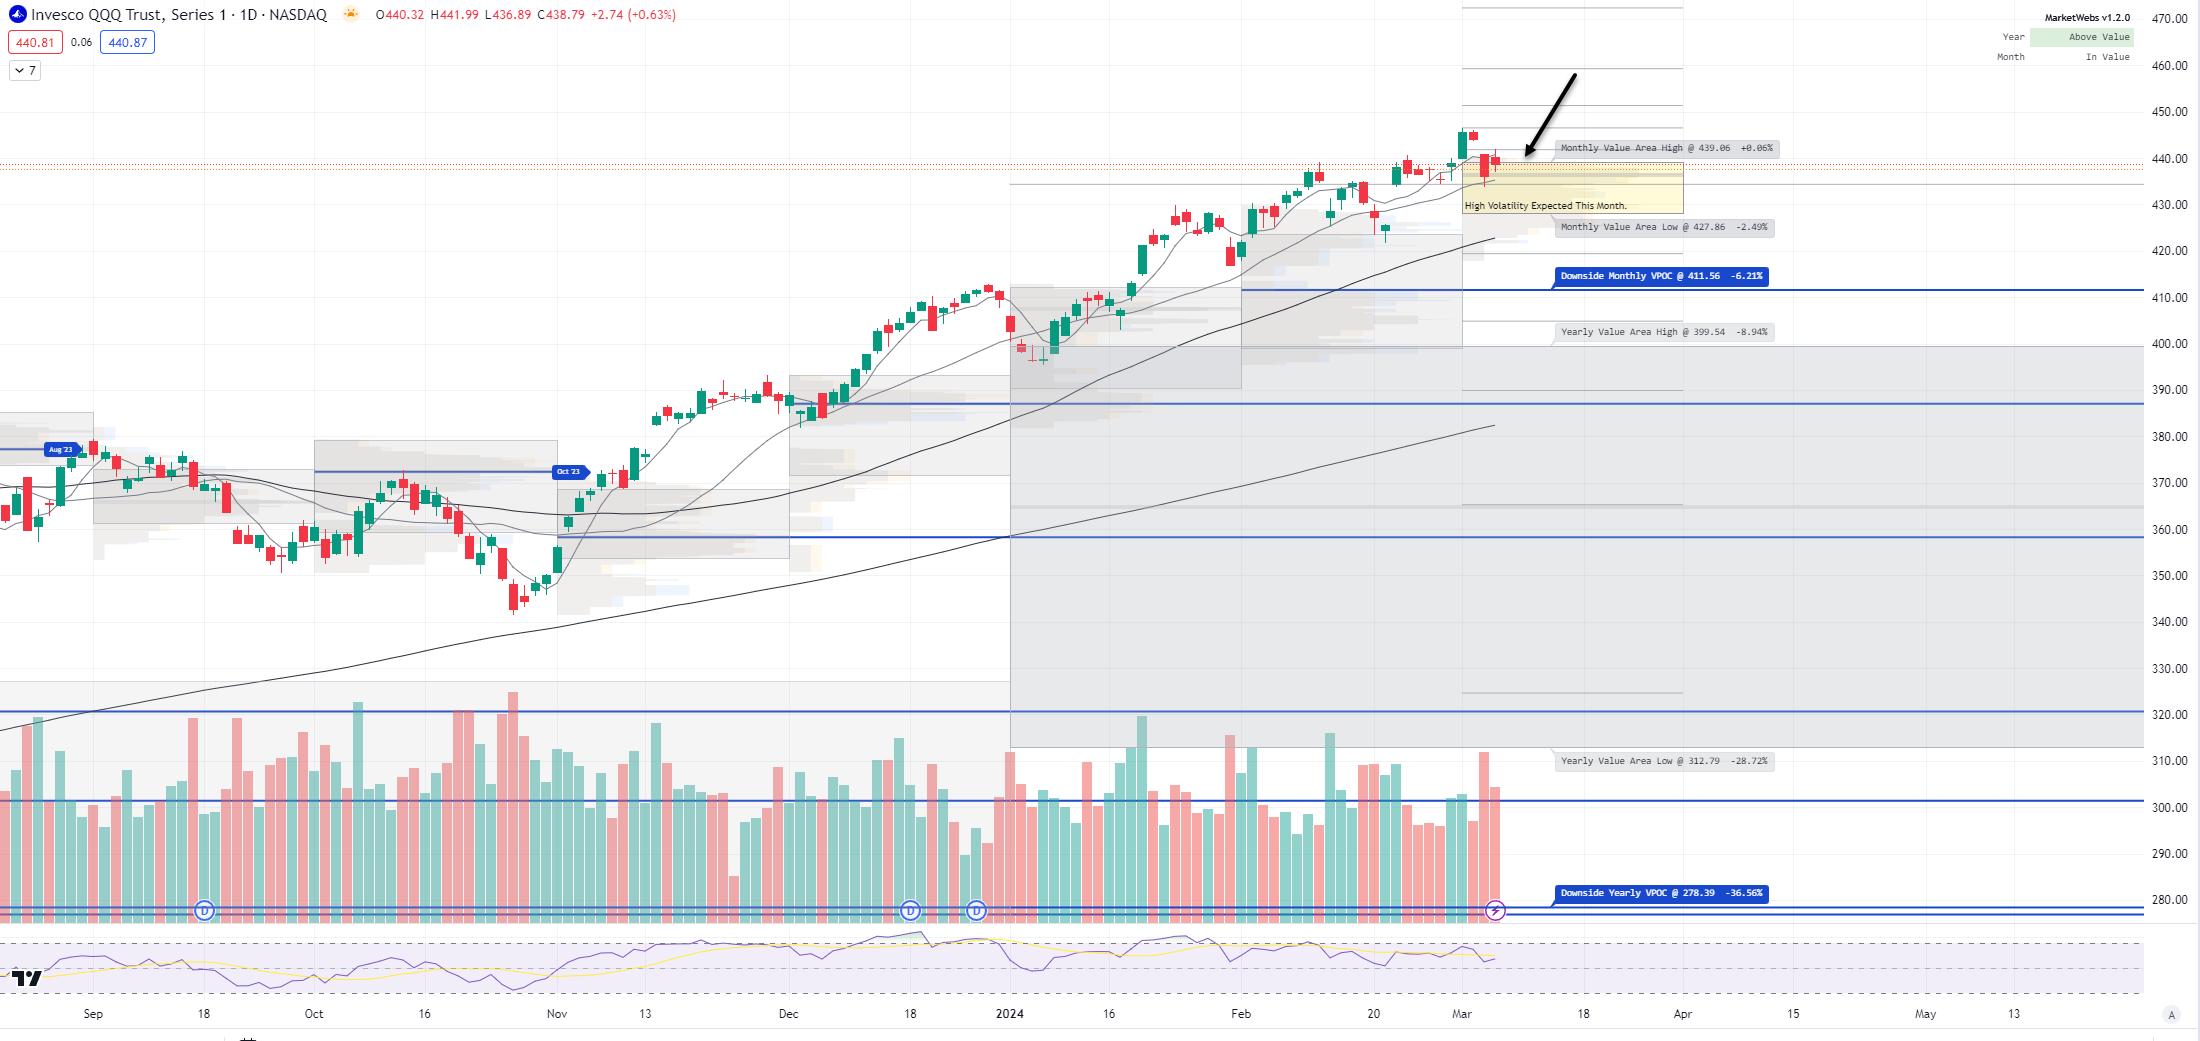
QQQ - NDX 100 ETF - Daily chart: Price ind. +0.4% this morning and a decent range overnight with speculation surging that the Bank of Japan will move in March to raise interest rates. Price is trying to get back above its March Value Area, the level to watch is $439.06
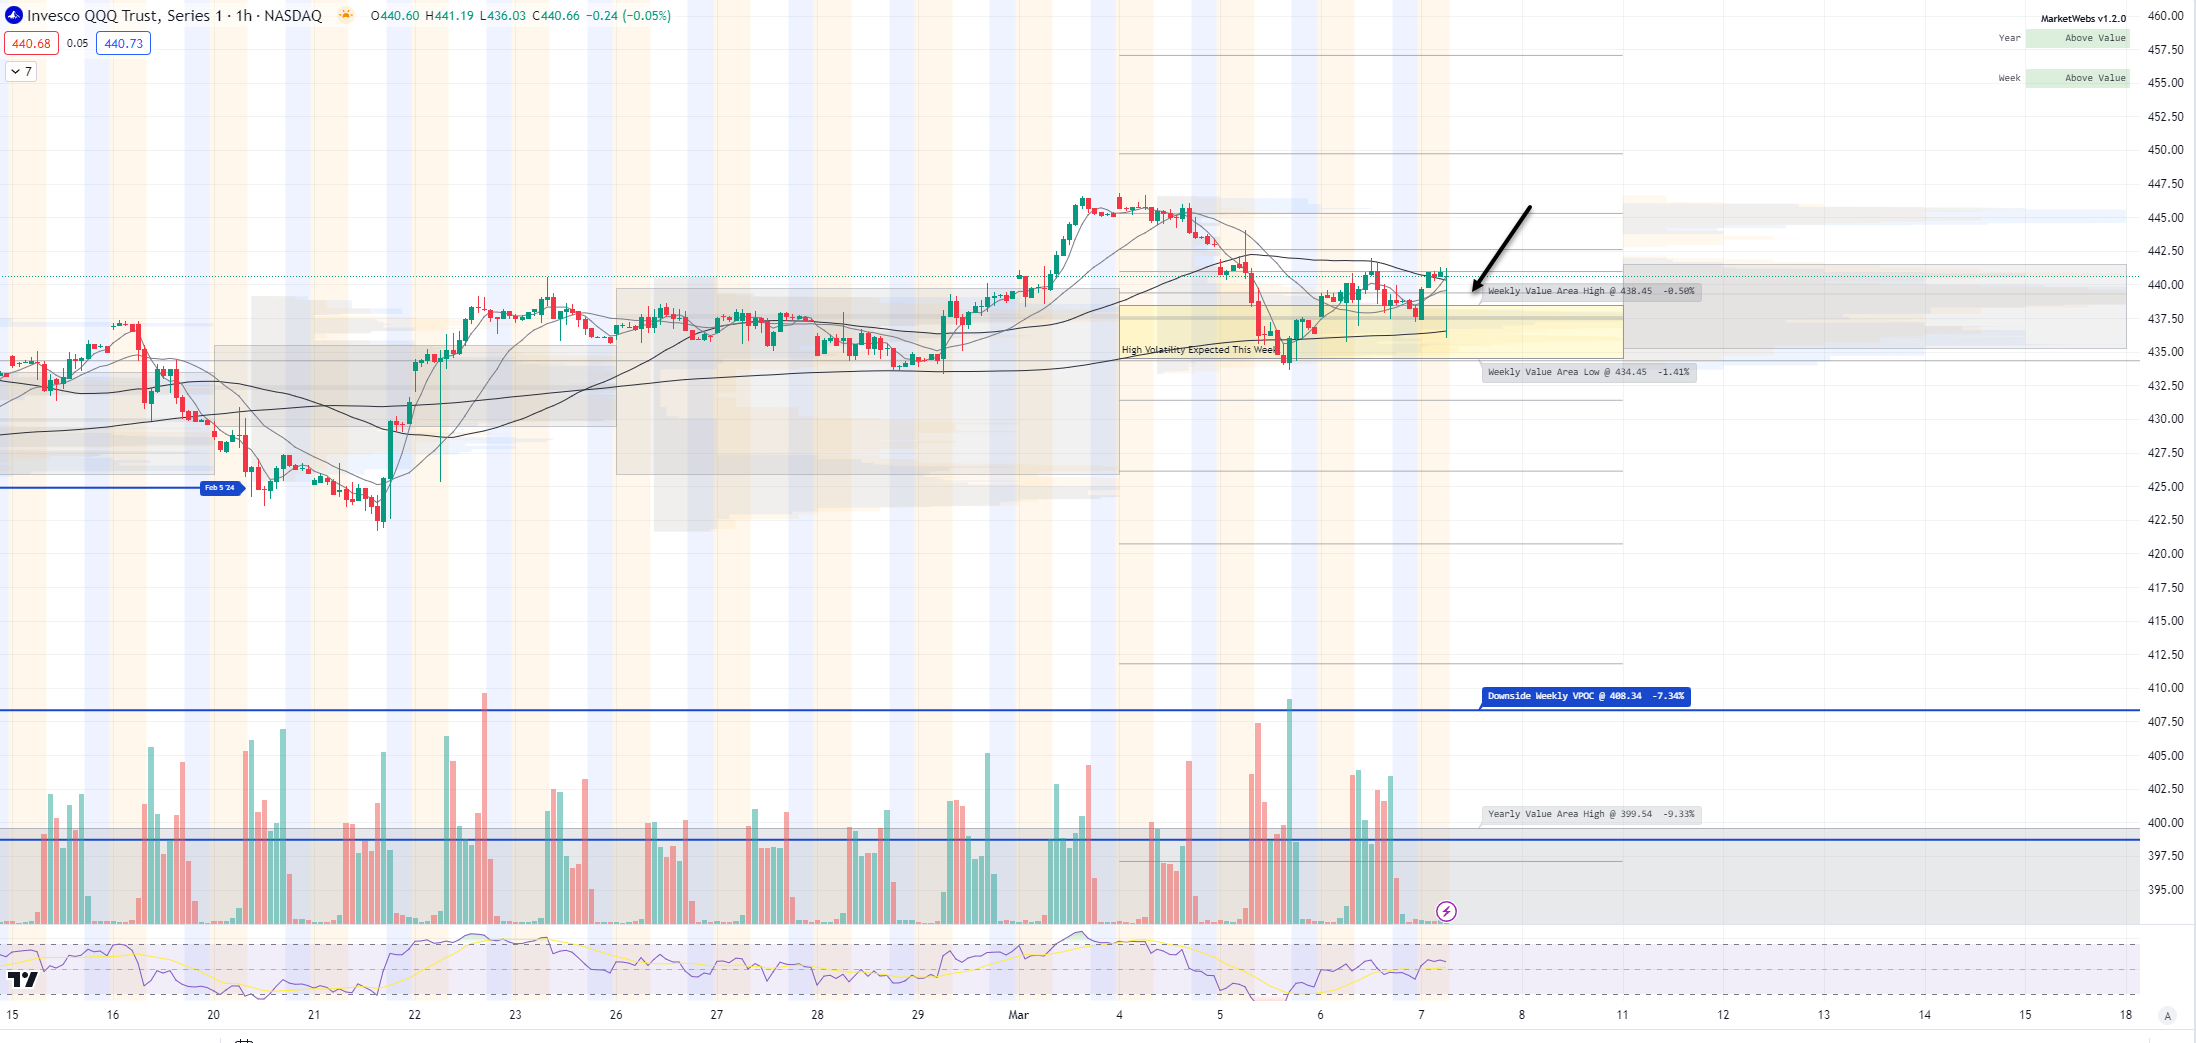
1hr chart: Price is back above its Value Area for the week, short term support level to watch is $438.45
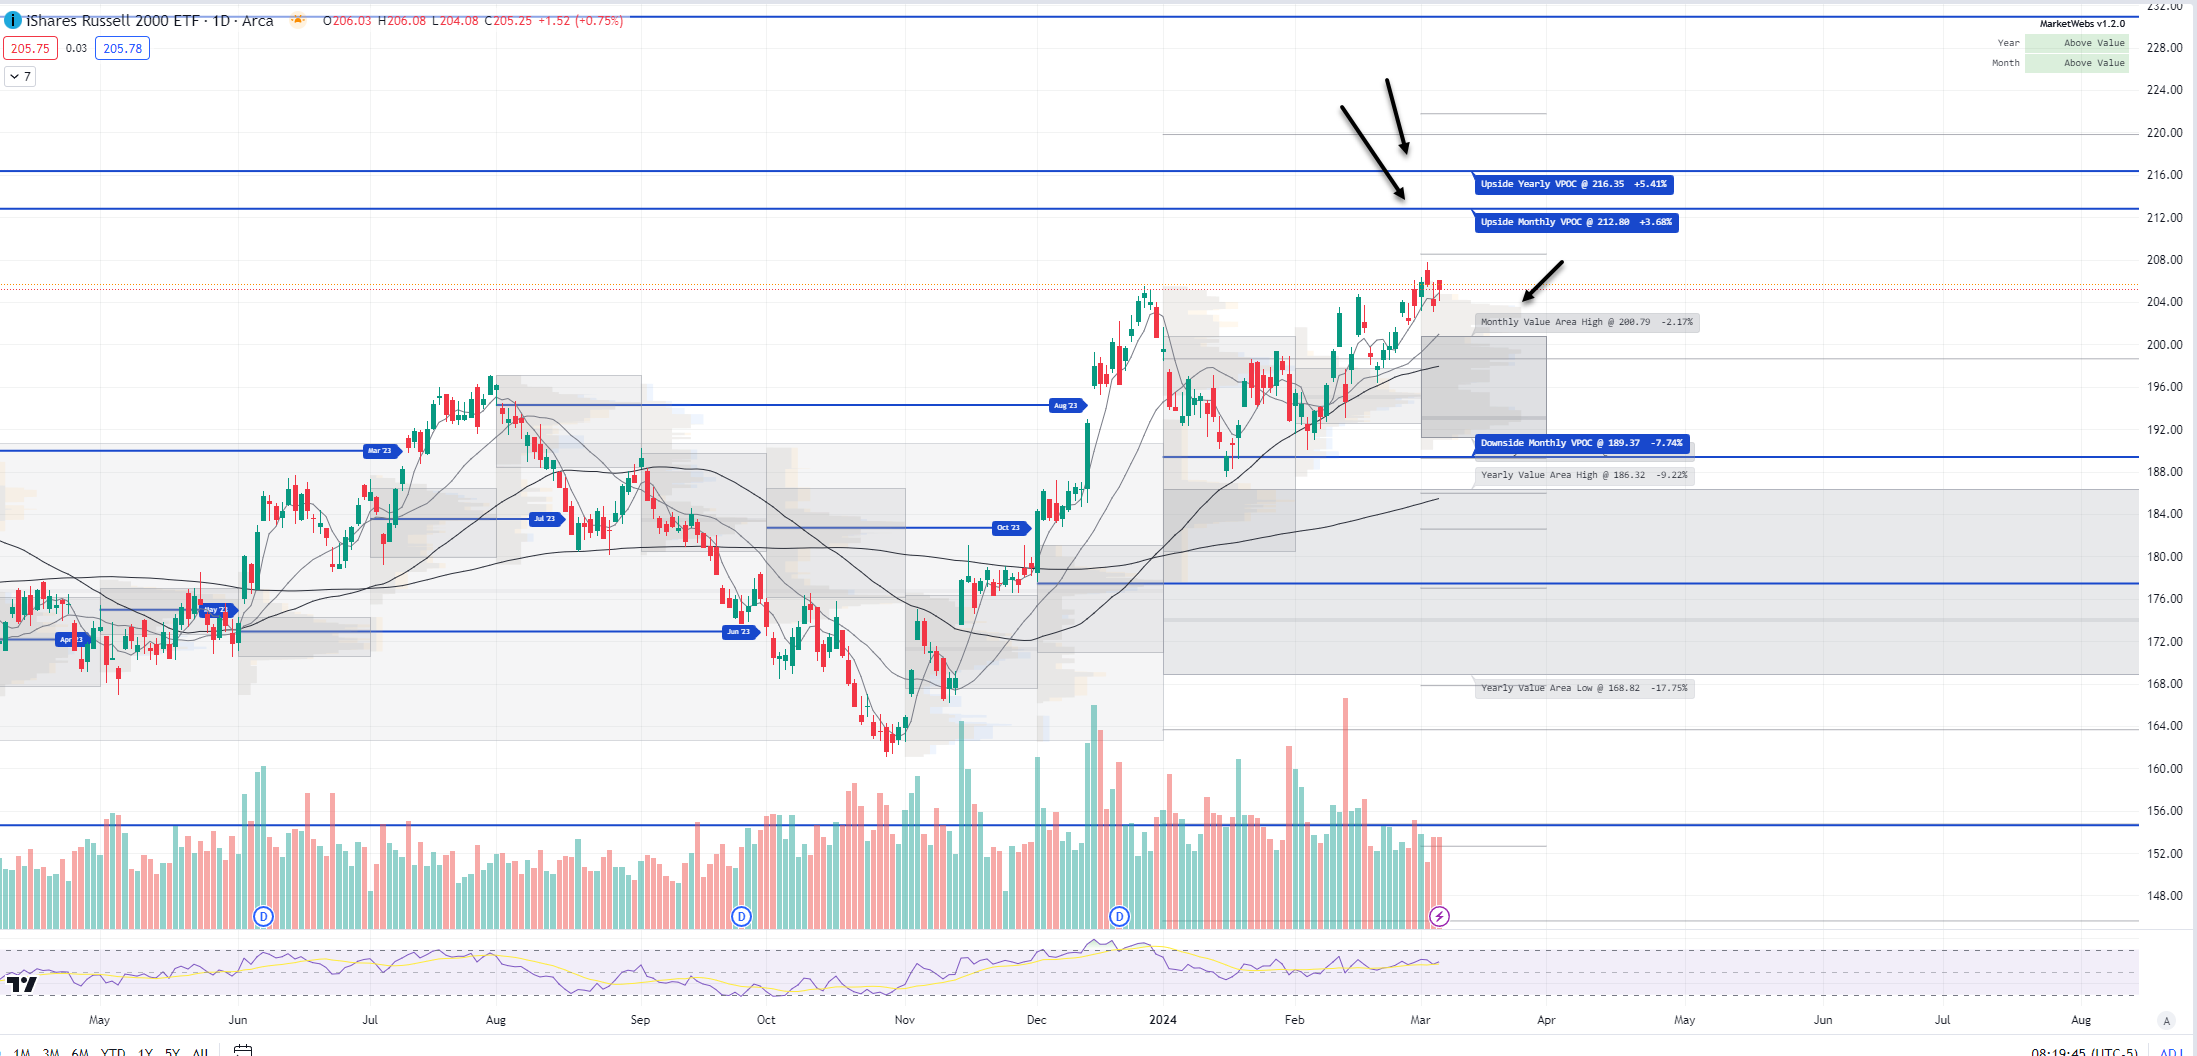
IWM - Russell Small Cap ETF- Price ind. +0.6% this morning & price remains decently above its Mar Value Area, and below the next VPOC up at $212.8
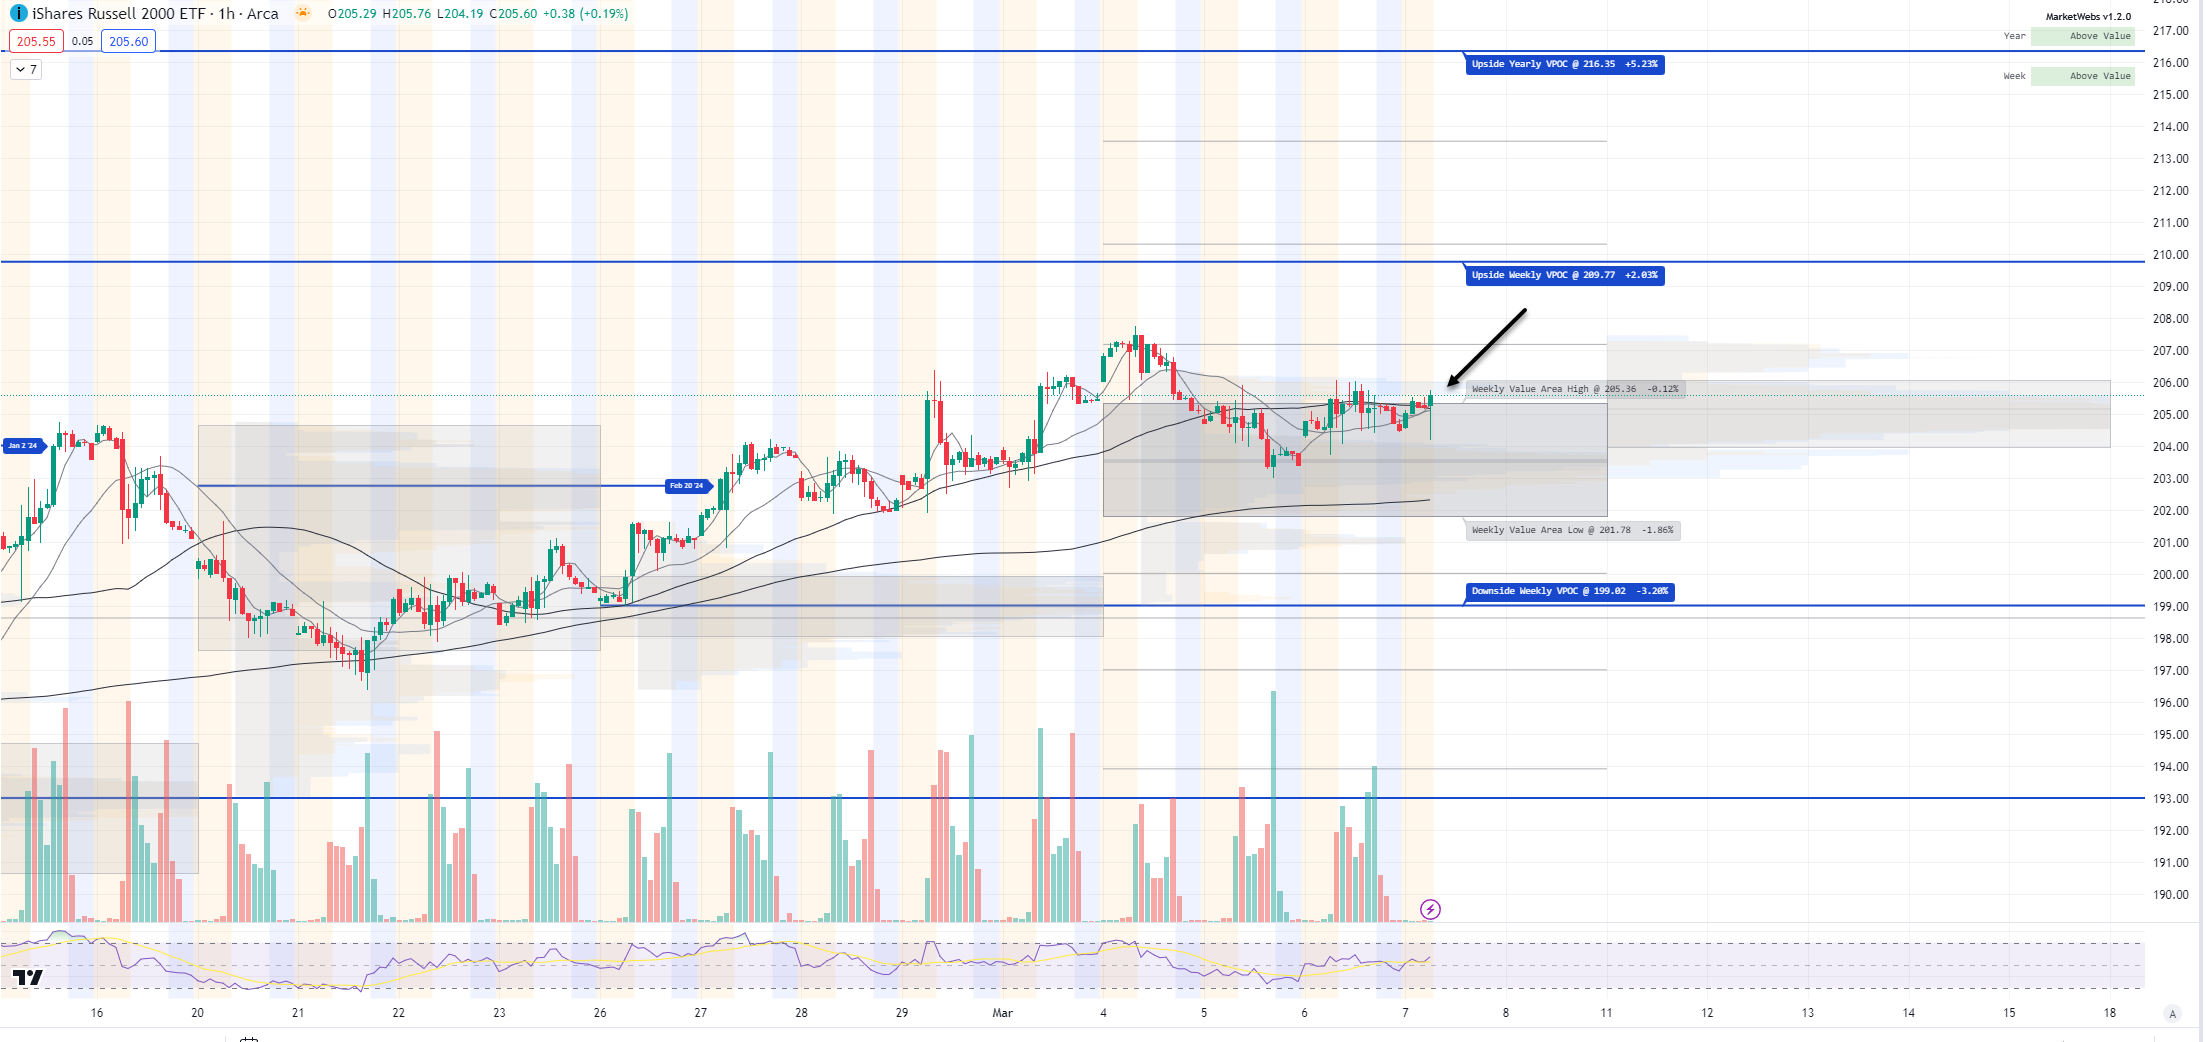
1hr chart: Price just above its Value Area for the week and level to watch here is $205.36
Here is today’s TTG Proprietary Stock Screen “Out of the Box” using Volume At Price
names trending above their Value Areas (on 3 multiple timeframes & not super extended)
Keep reading with a 7-day free trial
Subscribe to The Tribeca Trade Group to keep reading this post and get 7 days of free access to the full post archives.