

TTG Index Charts & Out of the Box Stock Screen 2/22/24 $TSM
TTG Index Charts & Out of the Box Stock Screen 2/22/24 $TSM
Out of the Box MarketWebs Screen
US Dollar -0.2% / 30yr Bonds -0.1% / Crude -0.2% & Nat Gas -4% / Gold +0.2% / Copper +0.2% / BTC +1.0%
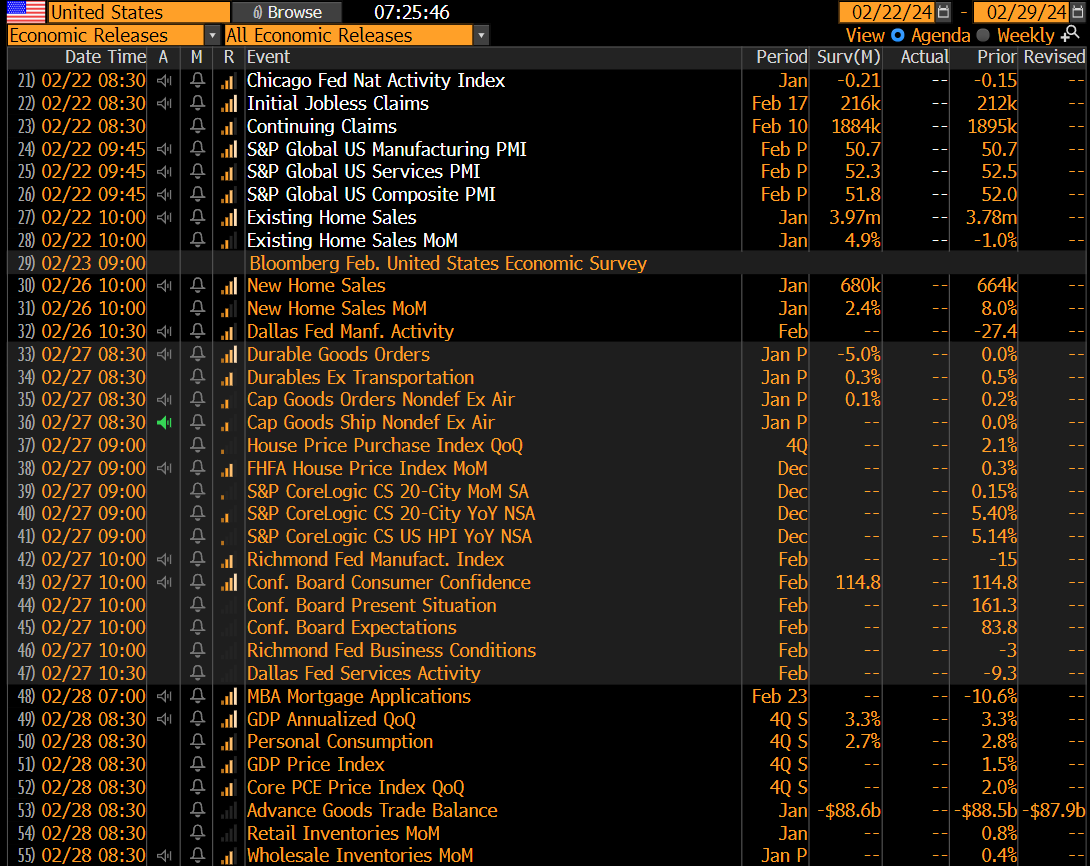
US Upcoming Economics
US Bond Yields

Index Updates
At TTG, I use Volume At Price in my chart analysis and I use the MarketWebs Indicator to provide Value Areas & VPOCs which indicate significant support & resistance levels. Learn More Here about Volume At Price and the MarketWebs.
ES_F - SPX Futures - Price ind. +1.2% with yes, you guessed it - NVDA earnings giving the market a lift. Price held and bounced at its 20d MA and is challenging new highs
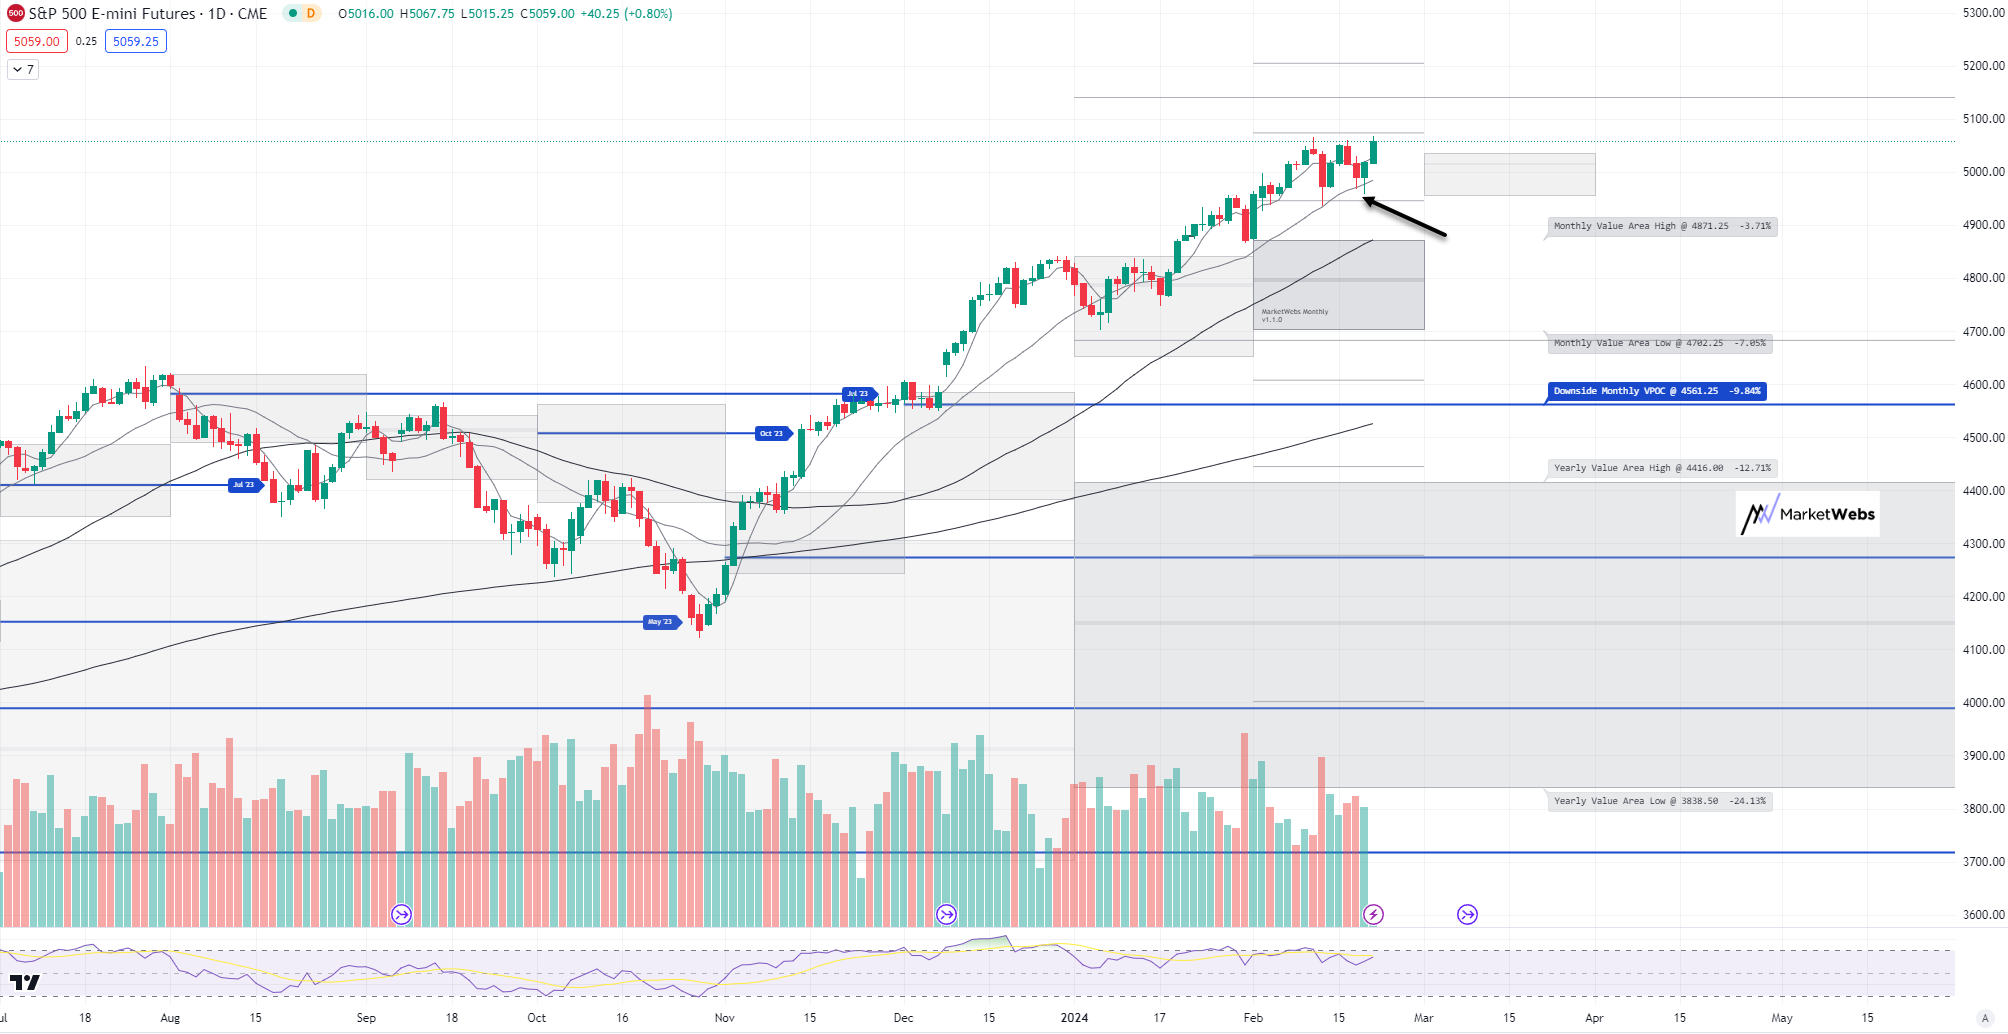
1hr chart: Price right up to the 1hr top of Value Area for the week, watch $5065.75

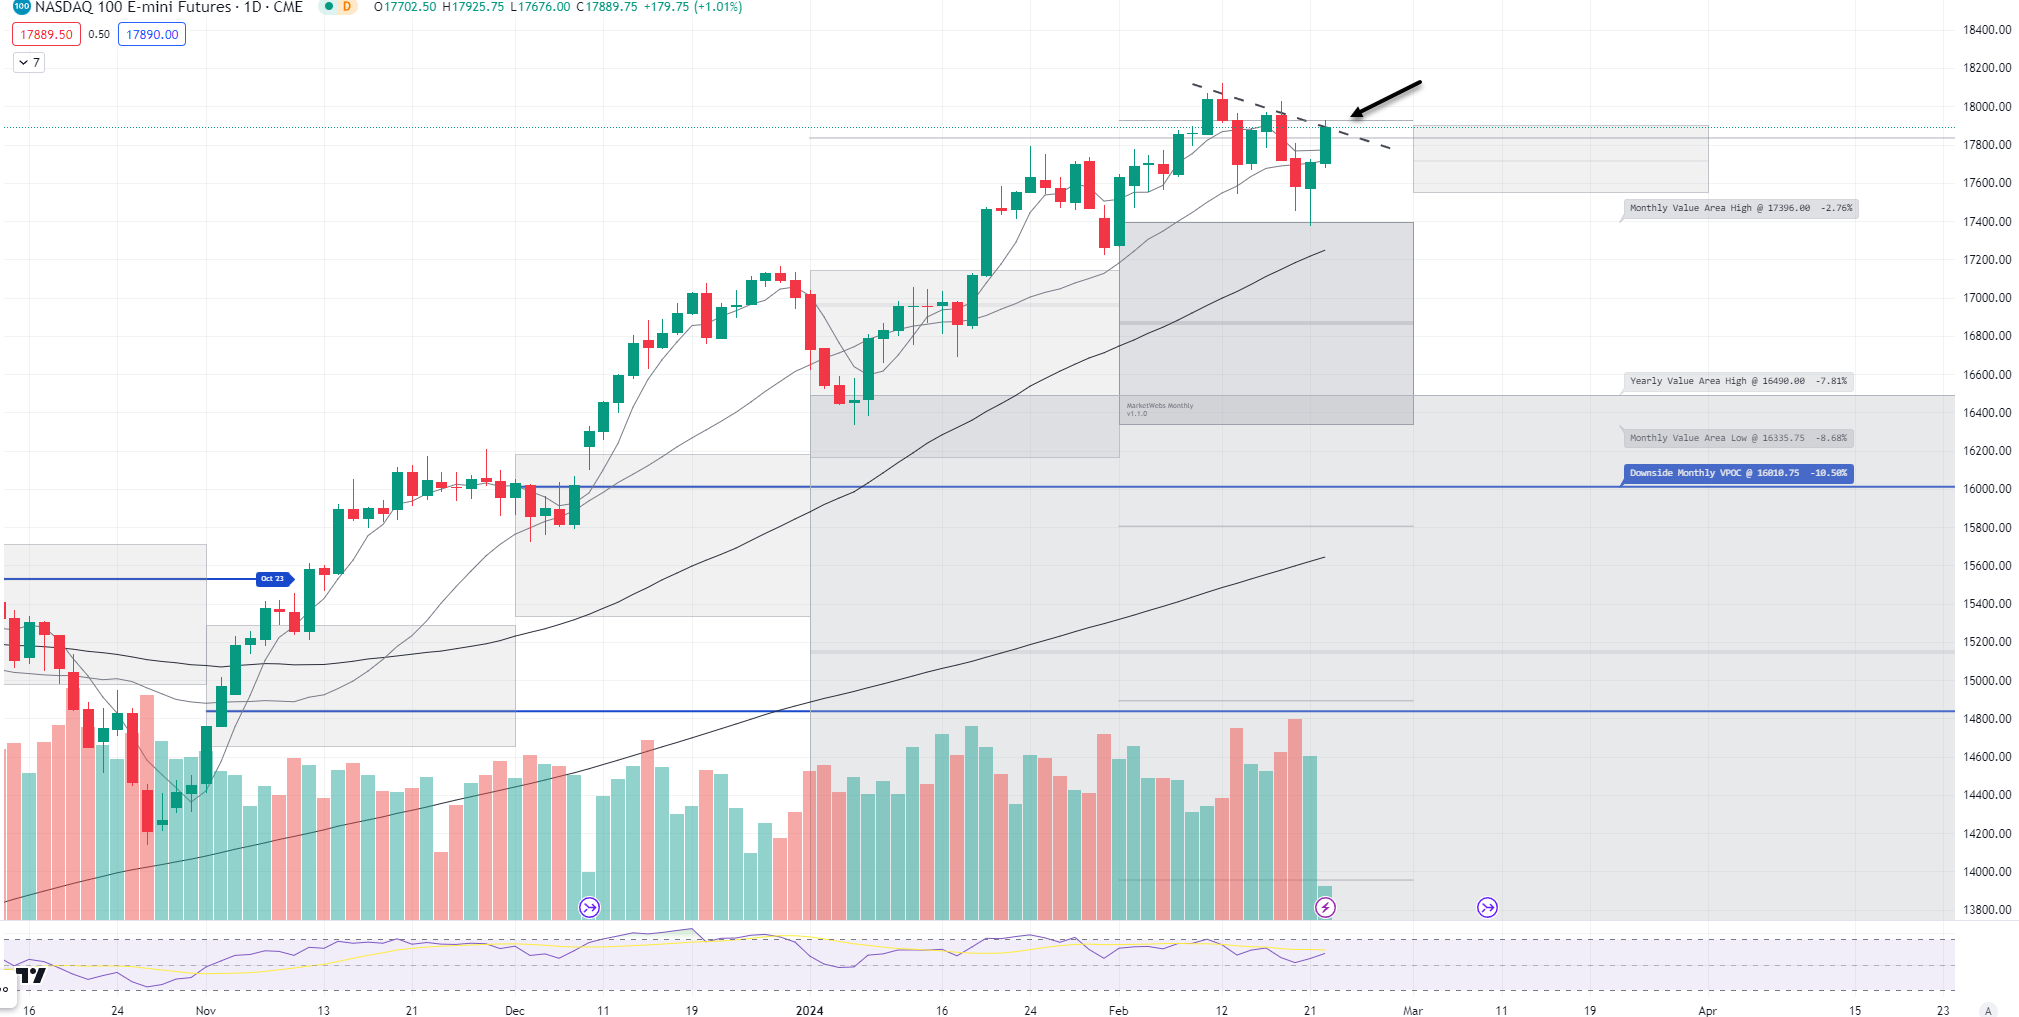
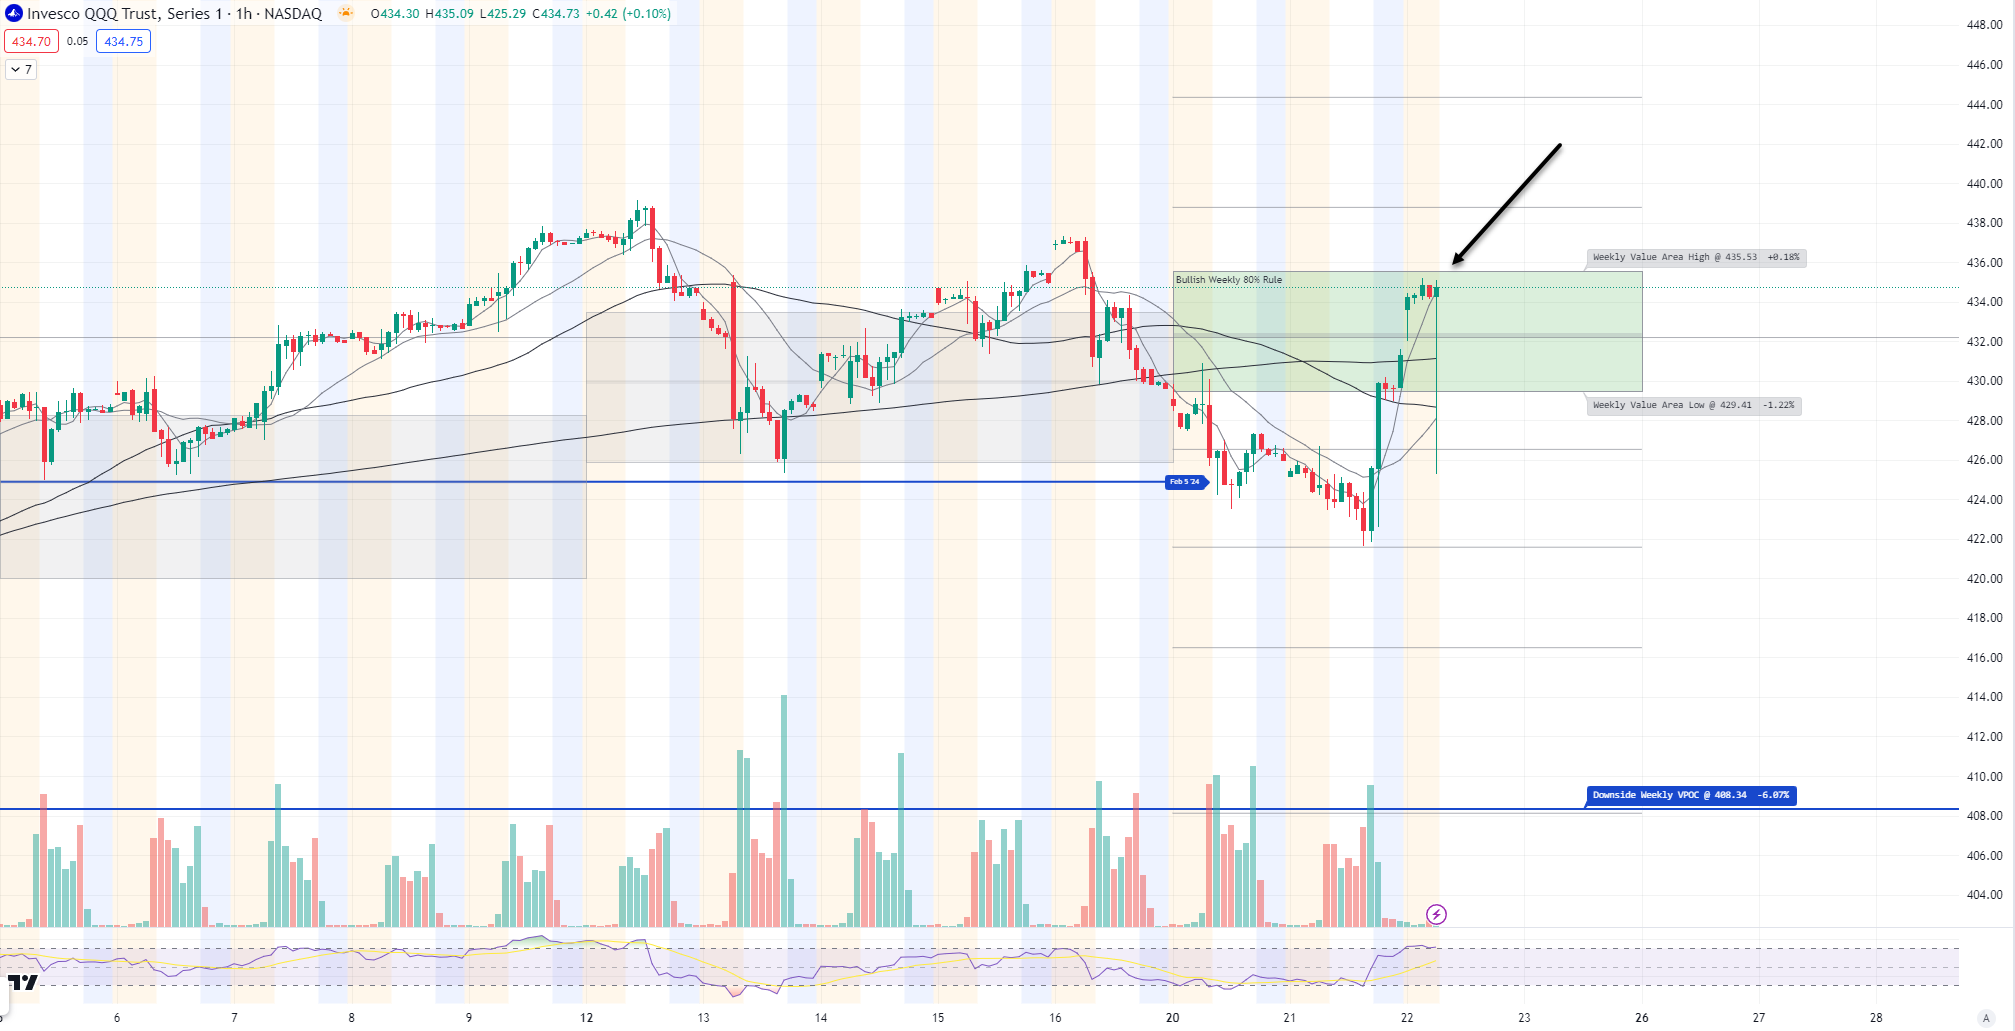
QQQ - NDX 100 ETF - Daily chart: Huge move premarket with QQQ ind. +2.0%. Real nice test and bounce yesterday at the top of the Feb Value Area as price held where it needed to (I have also included a chart of $NQ so you can see updated premkt pricing).
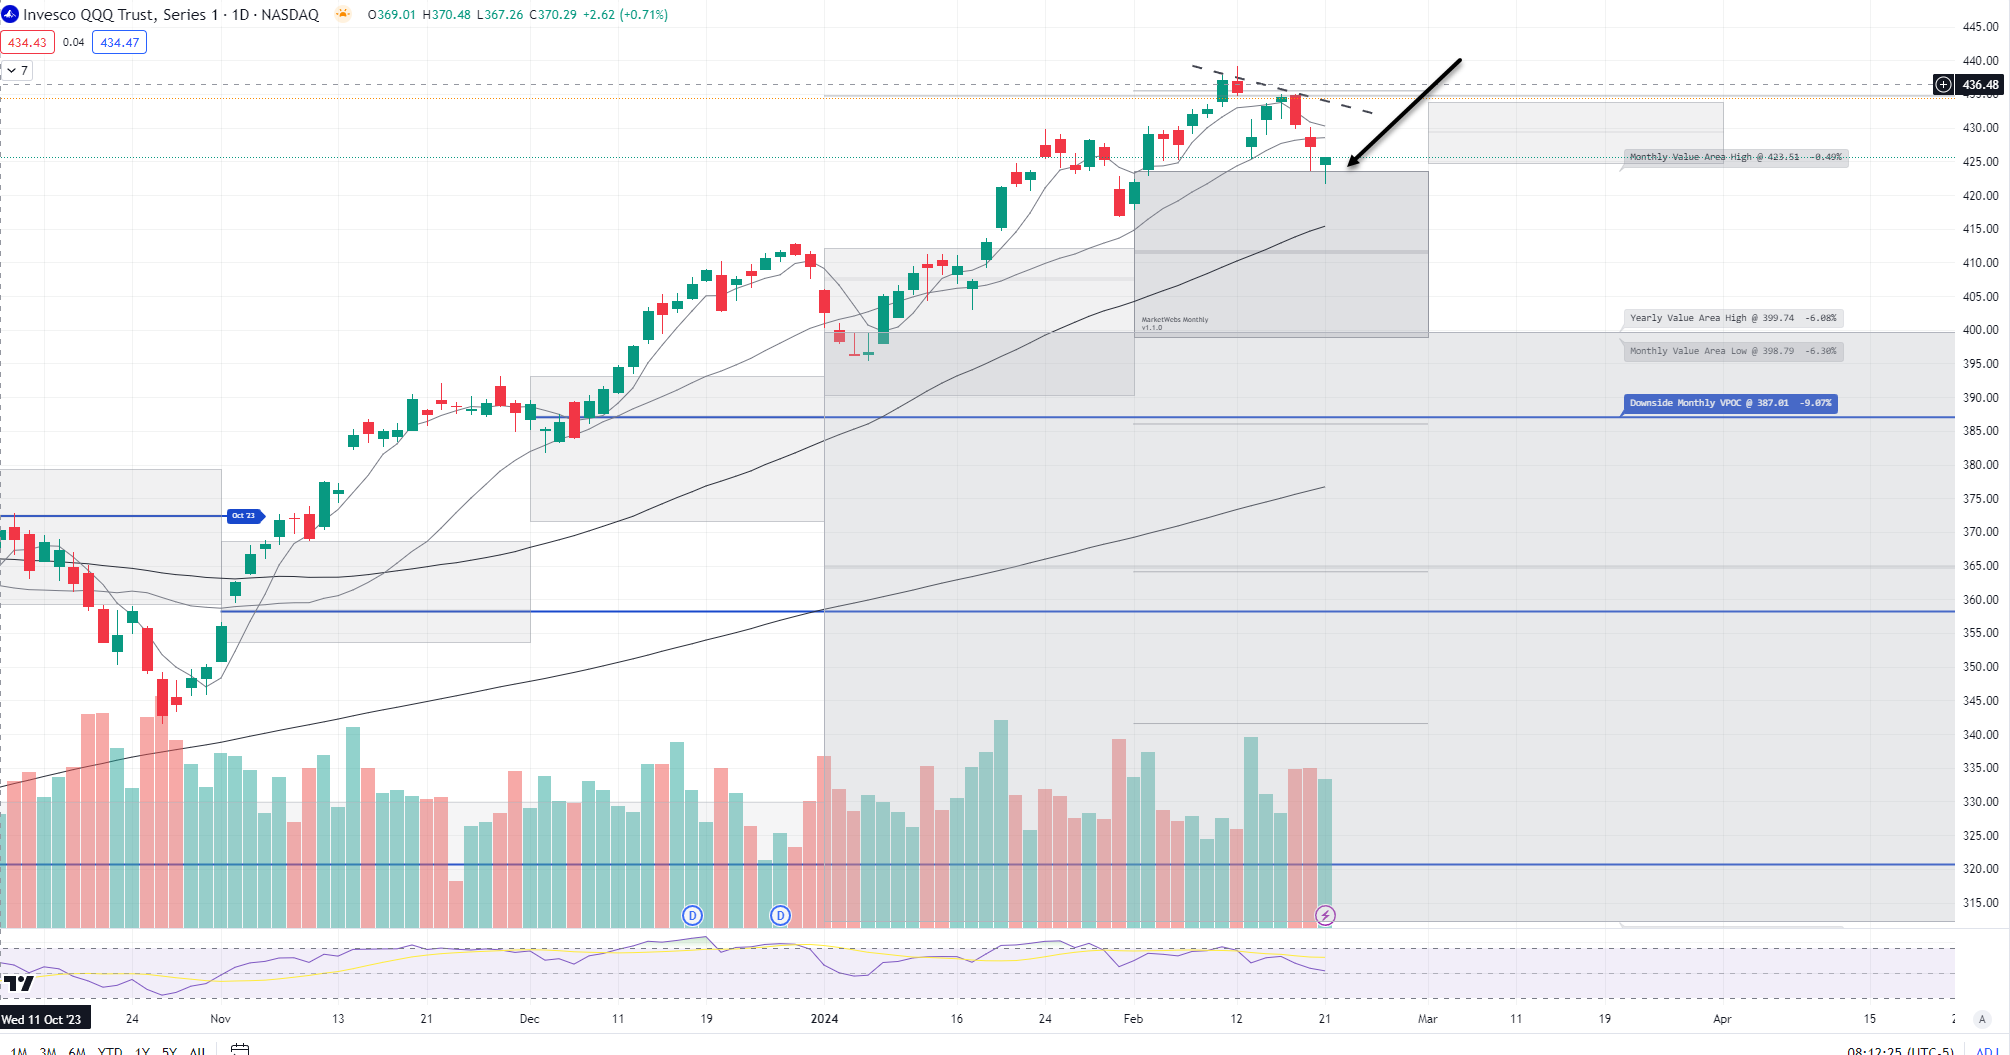
1hr chart: Similar to the S&P price has rallied very close its top of Value Area for week, watch $435.53 resistance
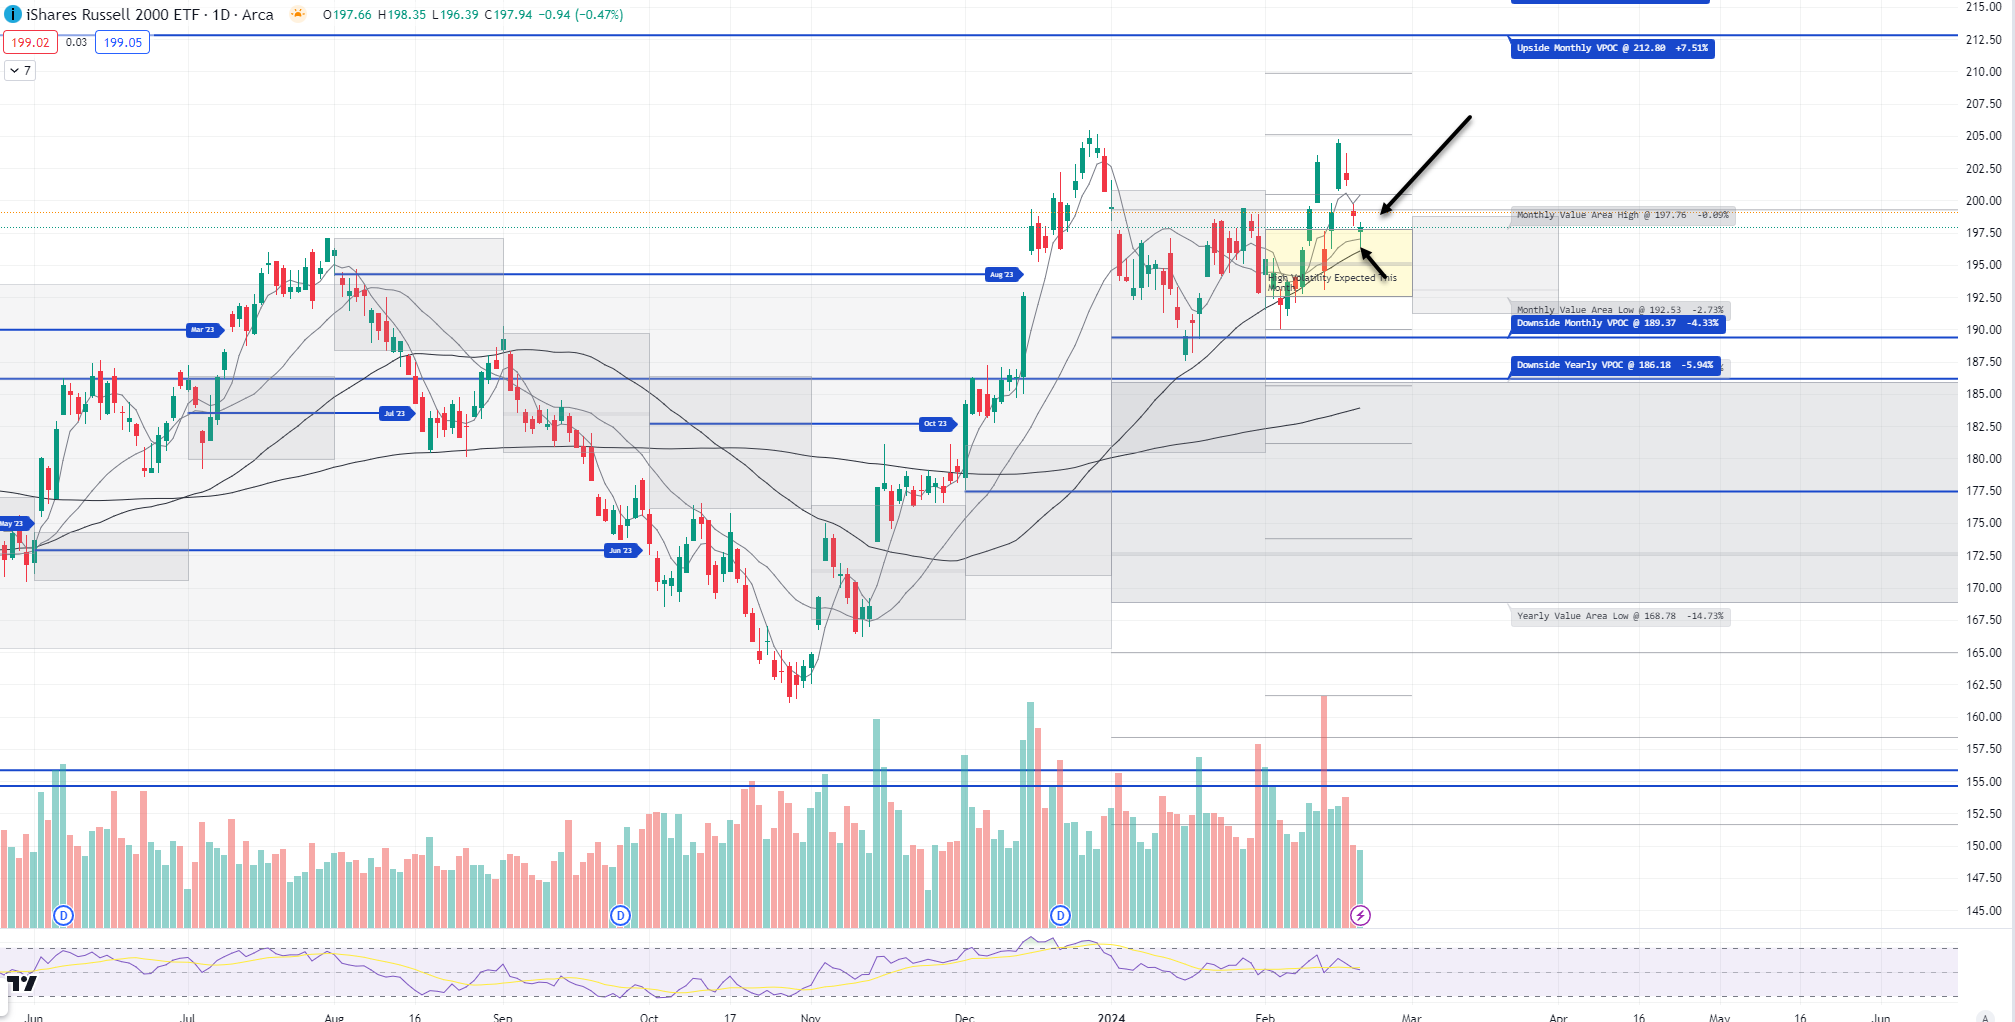
IWM - Russell Small Cap ETF- Price ind. +0.5% and for now holding that 50d MA which has been notable over the last +1mo that every time price has tested that 50d MA it has held. In addition, I am watching to see if price can stay above its Feb Value Area, $197.76
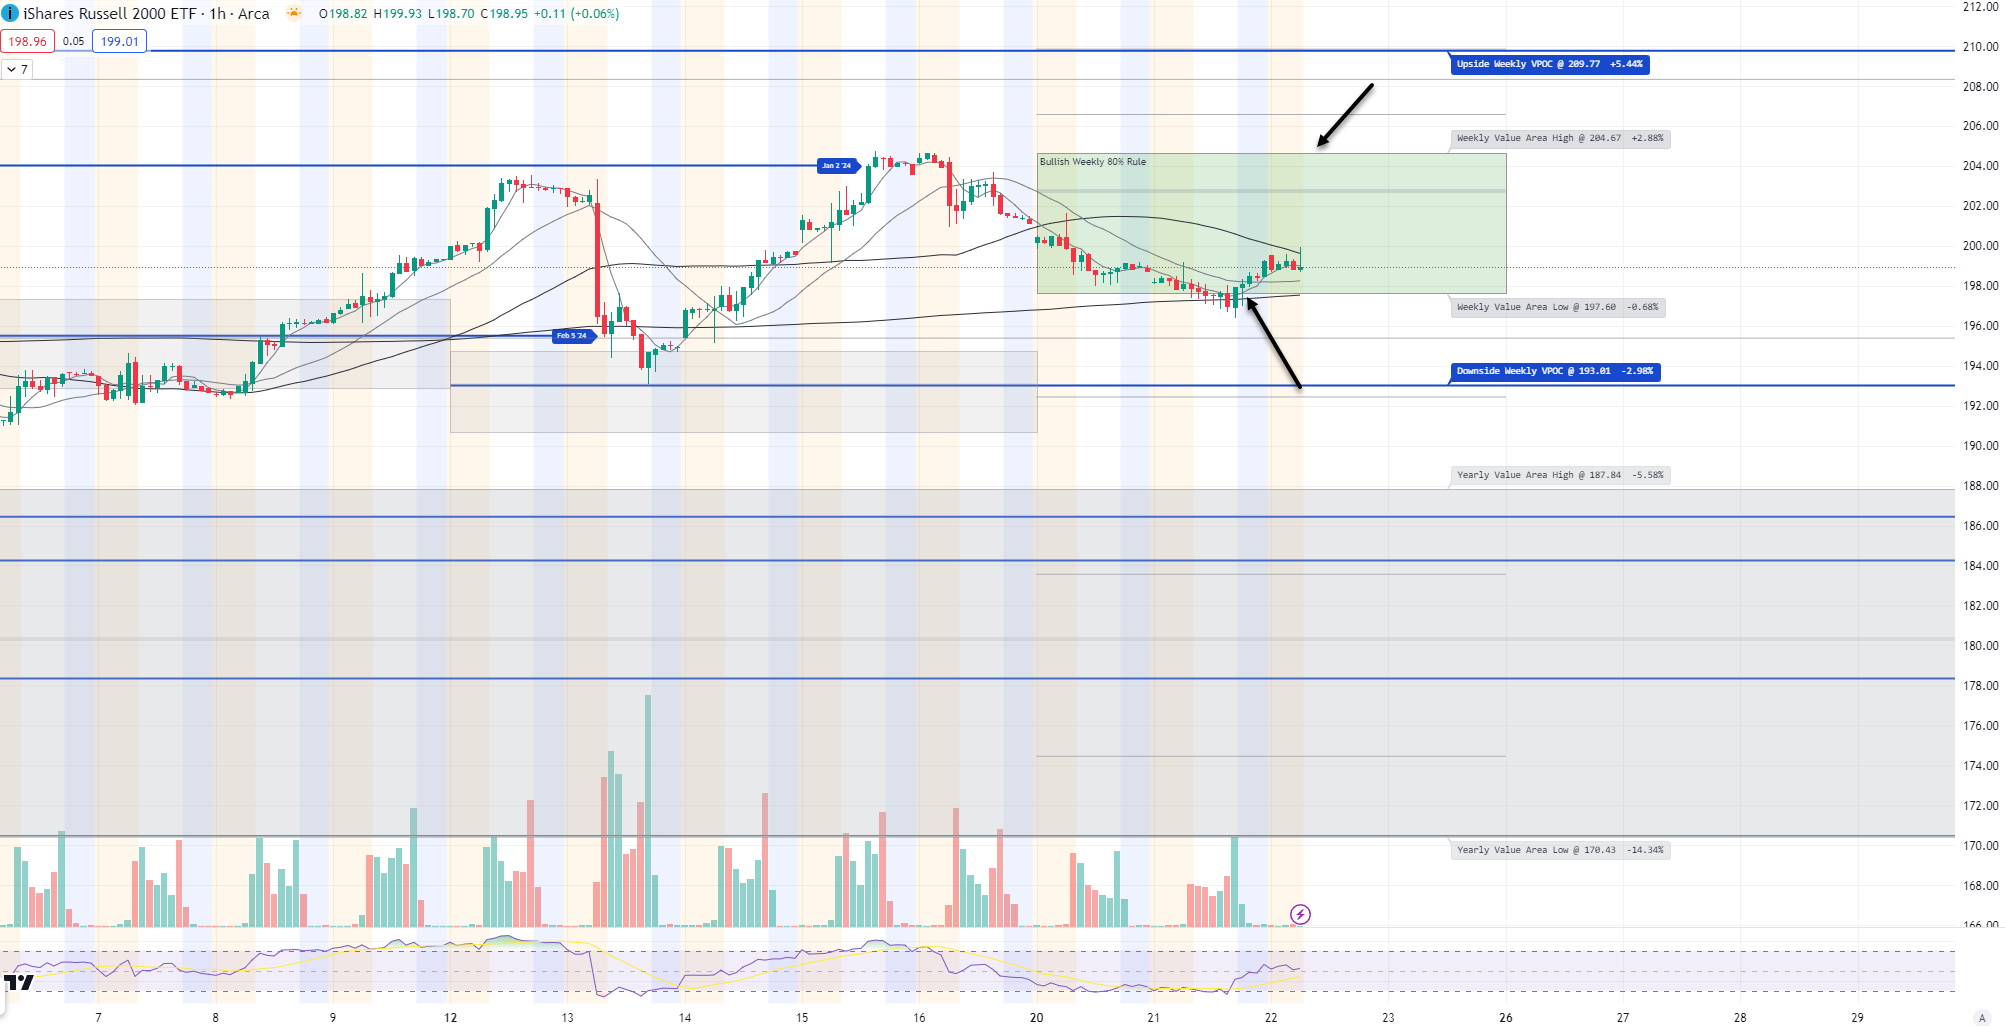
1hr chart: Price held and remains inside its Value Area for week, levels to watch below
Here is today’s TTG Proprietary Stock Screen “Out of the Box” using Volume At Price
names trending above their Value Areas (on 3 multiple timeframes & not super extended)
Keep reading with a 7-day free trial
Subscribe to The Tribeca Trade Group to keep reading this post and get 7 days of free access to the full post archives.