
TTG Index Charts & Out of the Box Stock Screen 5/10/24
Out of the Box MarketWebs Screen
US Dollar +0.1% / 30yr Bonds -0.2% / Crude +0.7% & Nat Gas -0.6% / Gold +1.8% / Copper +2.0% / BTC +1.3%
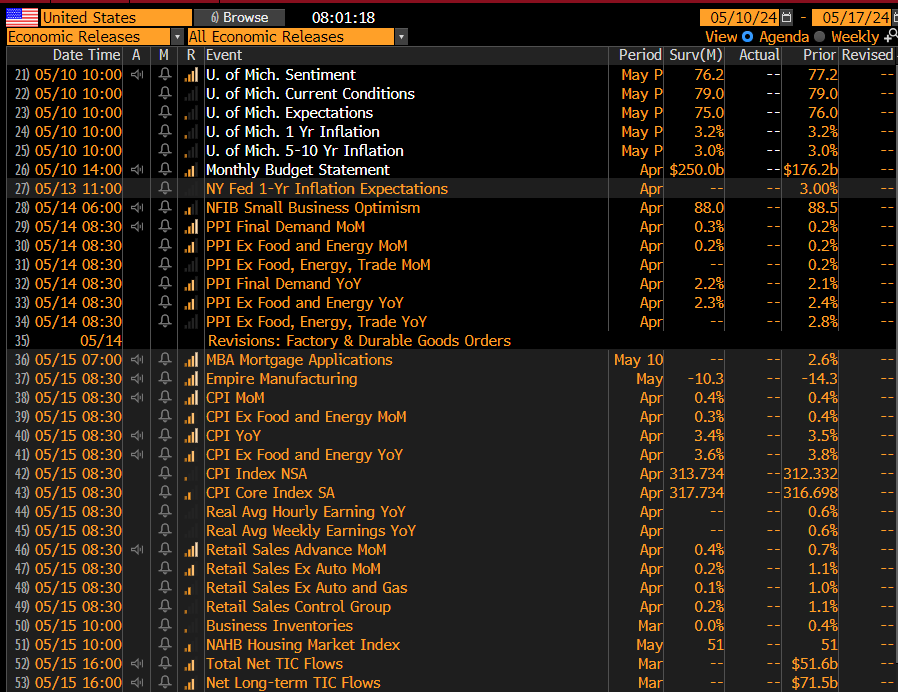
US Upcoming Economics
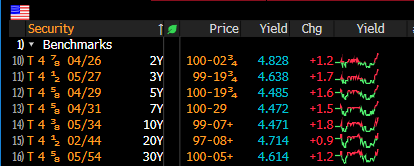
US Bond Yields
Index Updates
At TTG, I use Volume At Price in my chart analysis and I use the MarketWebs Indicator to provide Value Areas & VPOCs which indicate significant support & resistance levels. Learn More Here about Volume At Price and the MarketWebs.

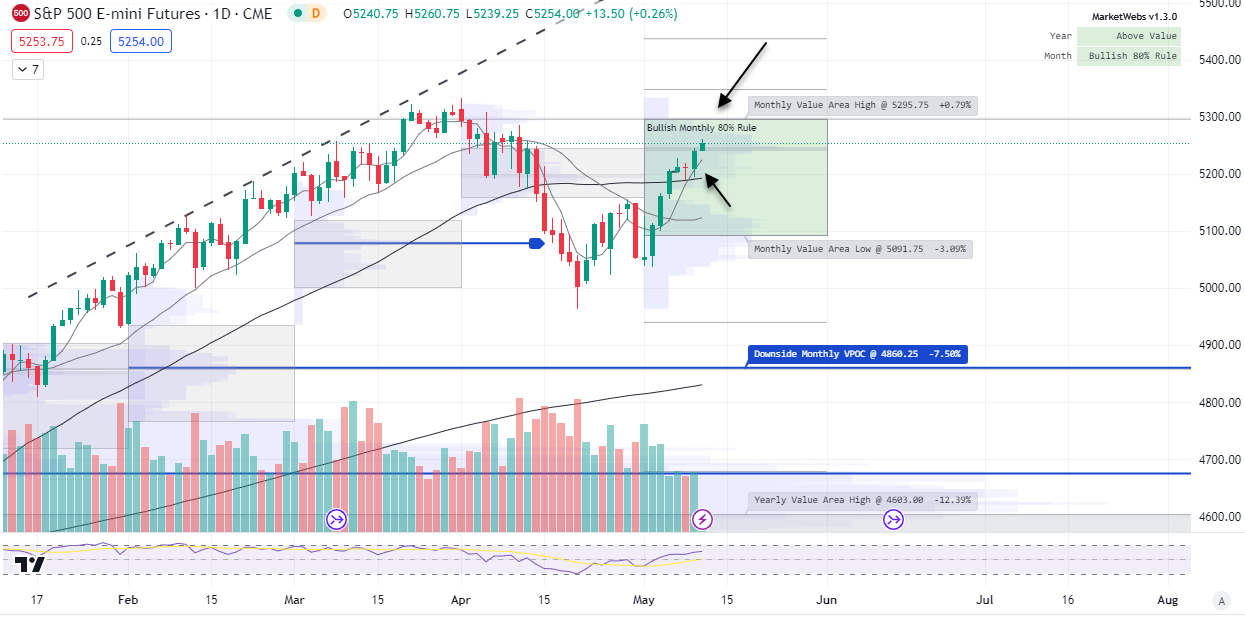
ES_F - SPX Futures - Daily chart: Upside continuation this morning with price ind. +0.3% and the #bullish 80% rule continues to play out, the top of May Value Area resistance is 5295.75
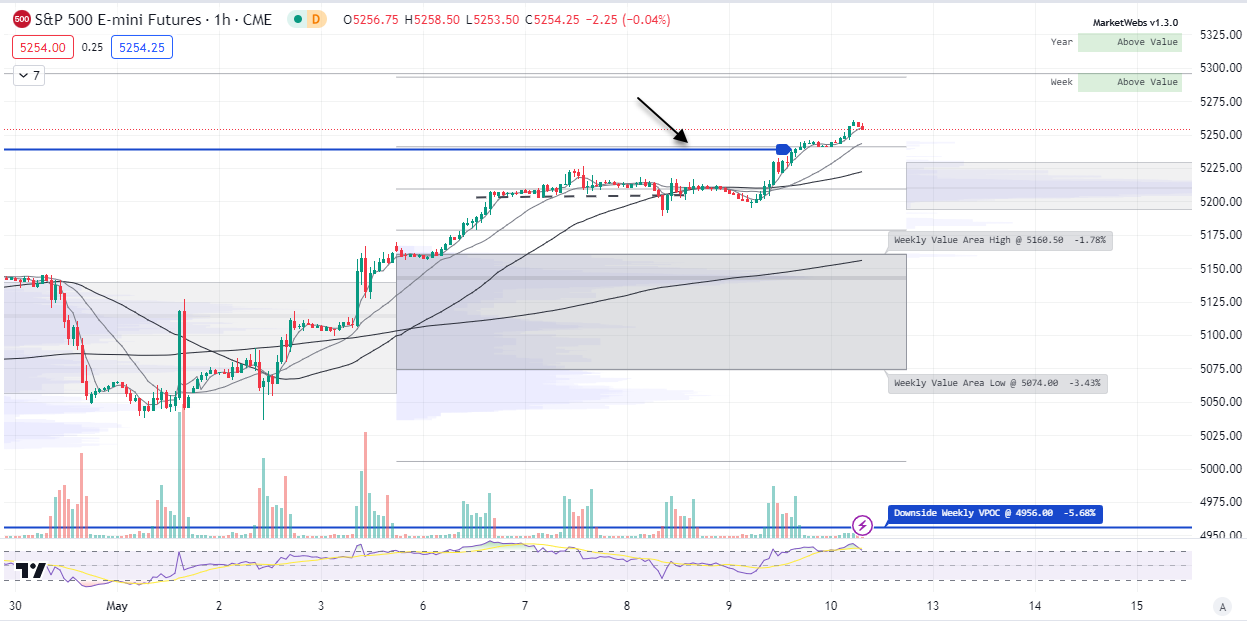
1hr chart: Price took out that VPOC and so far has is still rallying above (normally, see some digestion on a VPOC take out)
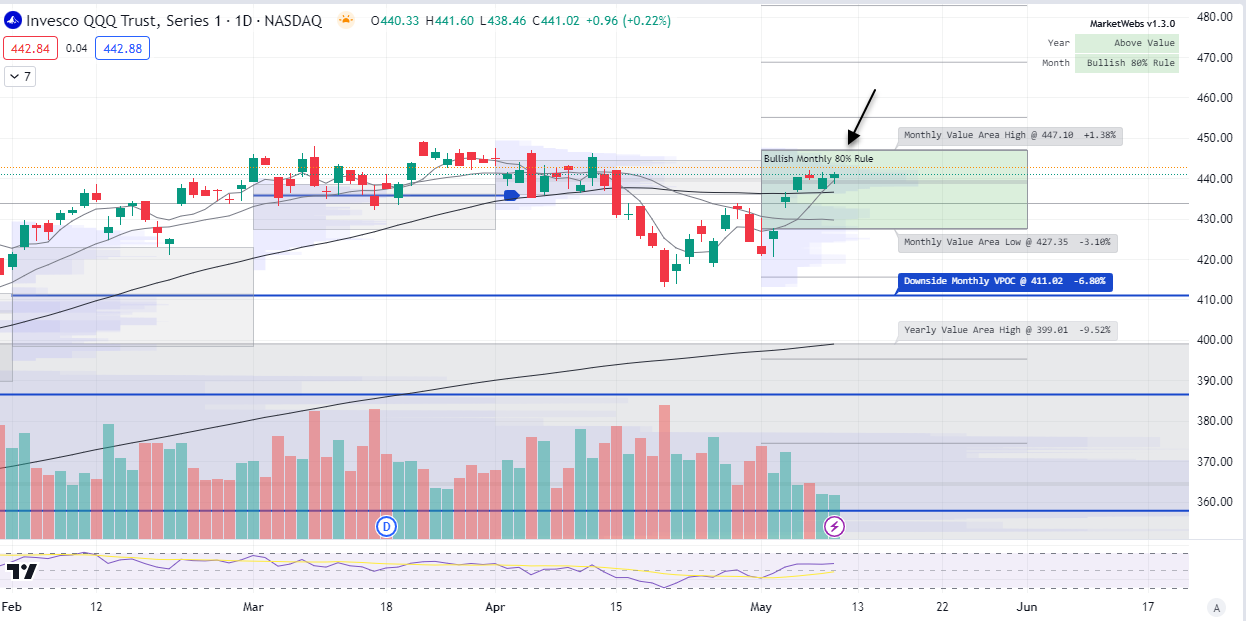
QQQ - NDX 100 ETF - Daily chart: Price ind. +0.4% similar to the S&P is bullish 80% rule remains in effect and price staying above all short term MAs (Moving Averages). Resistance is $447.1 May top of Value Area
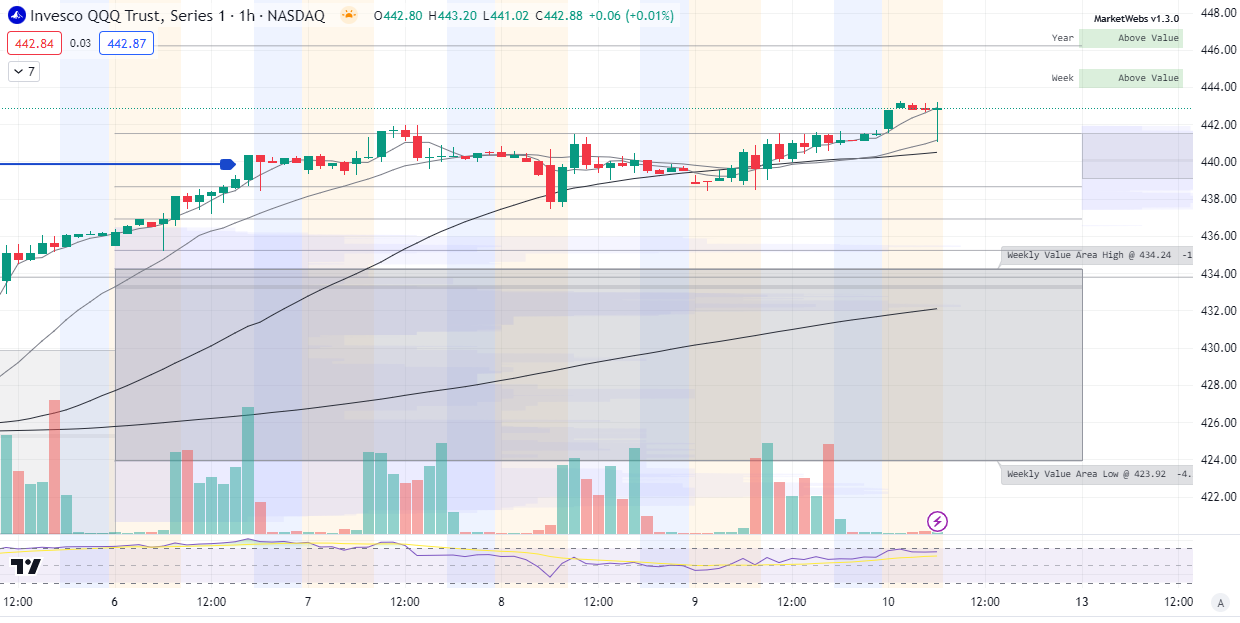
1hr chart: Price continuation above is Value Area for week
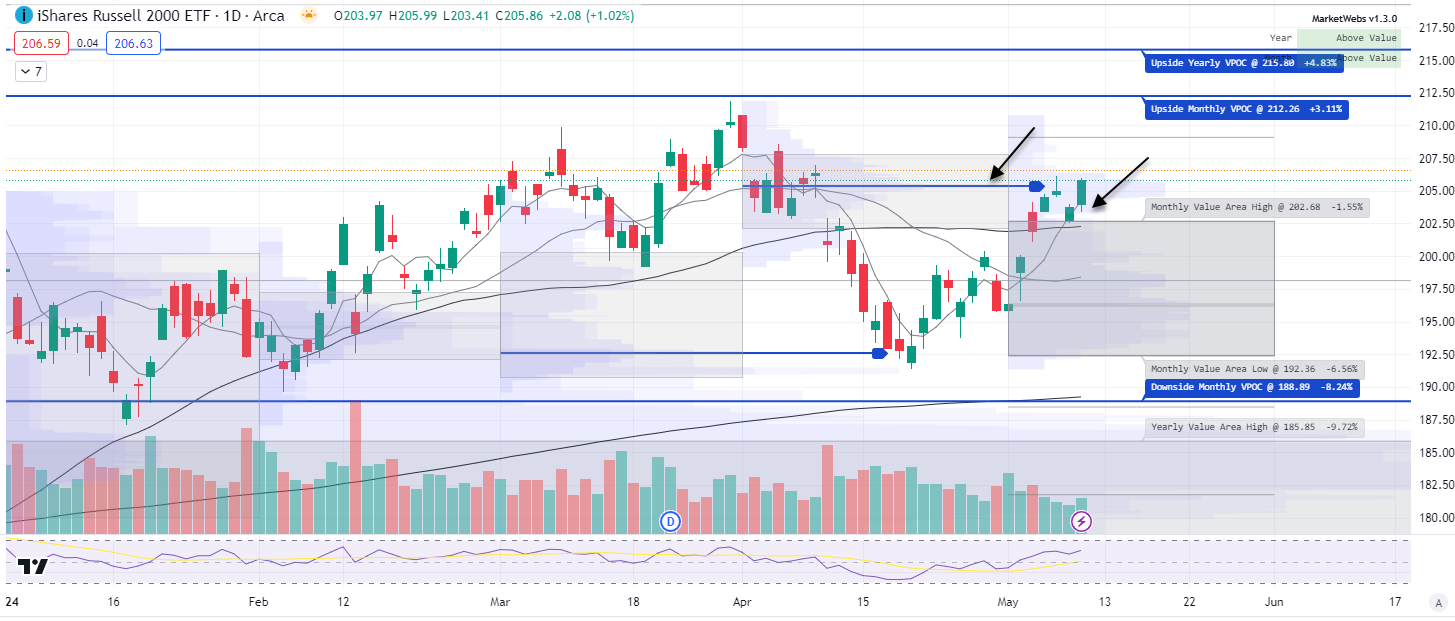
IWM - Russell Small Cap ETF- Daily Chart: Price also ind. +0.4% and is now back to the VPOC take out and remains above its May Value Area, let's see if price can begin to extend above that VPOC take out (blue line) and trend +
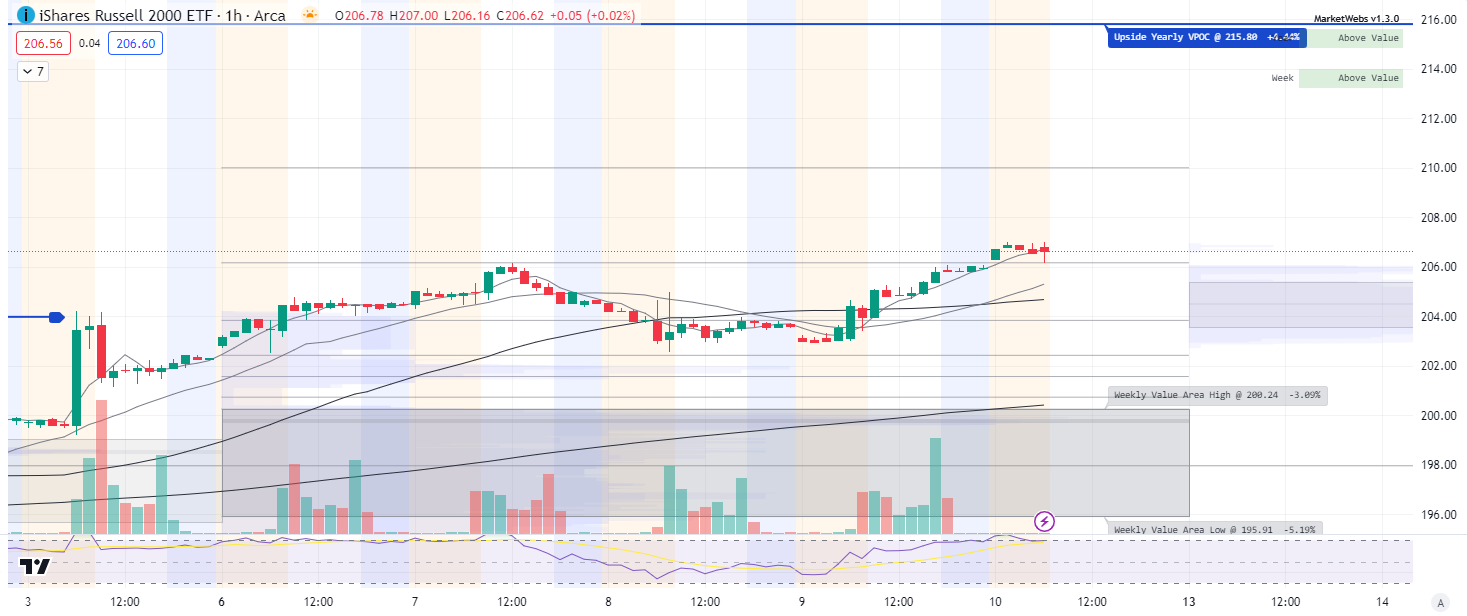
IWM 1hr chart: Price continuation above this week's Value Area
Here is today’s TTG Proprietary Stock Screen “Out of the Box” using Volume At Price
names trending above their Value Areas (on 3 multiple timeframes & not super extended)
Keep reading with a 7-day free trial
Subscribe to The Tribeca Trade Group to keep reading this post and get 7 days of free access to the full post archives.