

TTG Index Charts & Out of the Box Stock Screen 01/29/24 $MPC $SBLK
TTG Index Charts & Out of the Box Stock Screen 01/29/24 $MPC $SBLK
Out of the Box MarketWebs Screen
US Dollar +0.2% / 30yr Bonds +0.6% / Crude -0.3% & Nat Gas -2.3% / Gold +0.6% / Copper +0.1% / BTC -0.1%
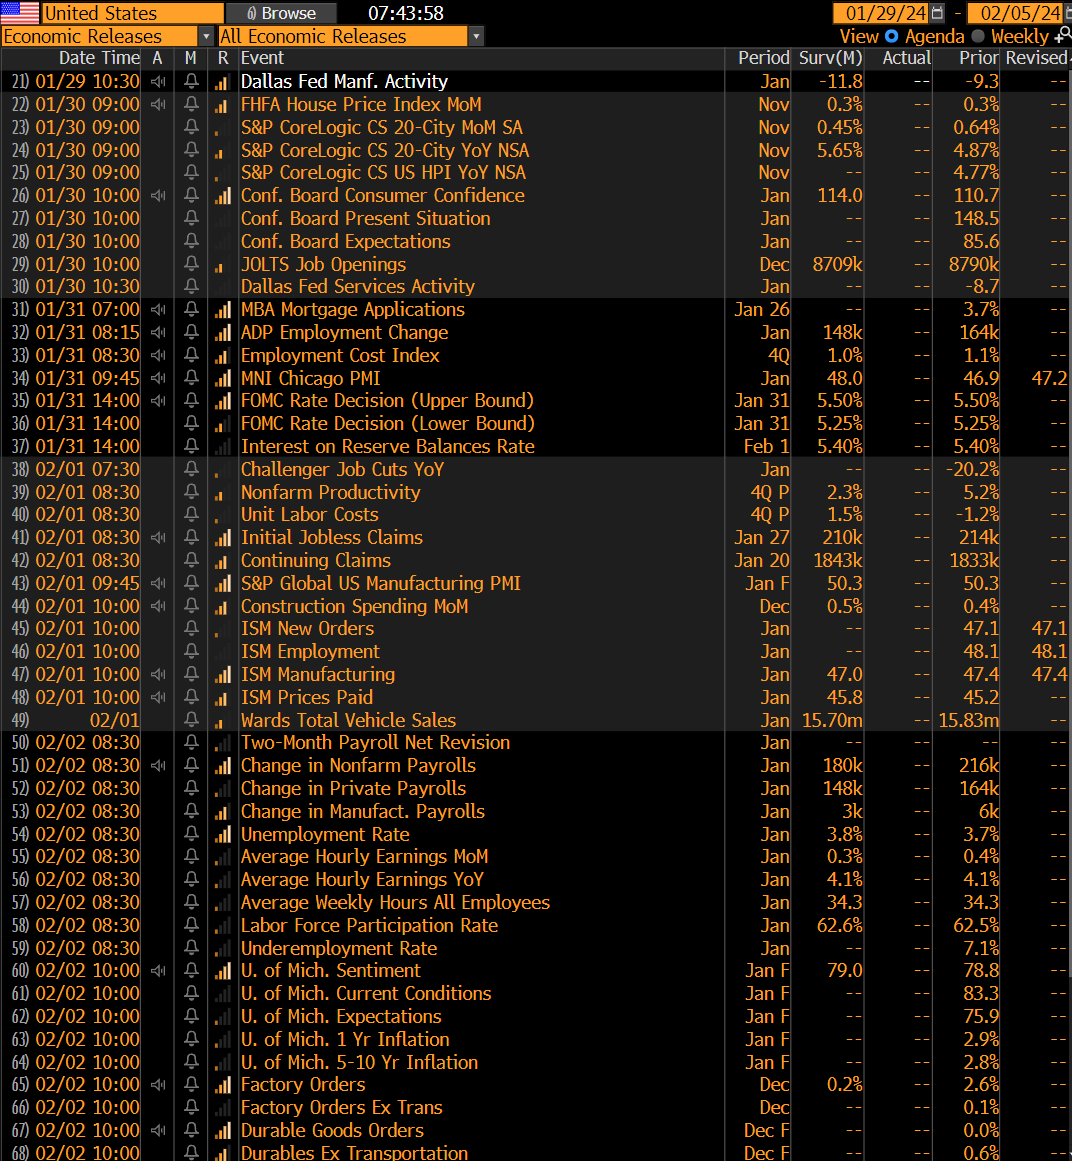
US Upcoming Economics
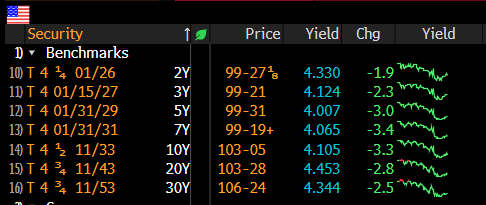
US Bond Yields
Index Updates
At TTG, I use Volume At Price in my chart analysis and I use the MarketWebs Indicator to provide Value Areas & VPOCs which indicate significant support & resistance levels. Learn More Here about Volume At Price and the MarketWebs.
$ES_F- S&P Futures - Price continues to chop & trade in a narrow range ahead of a big week of events (FOMC, Jobs Data, Big Earnings Reports, etc) and remains above its 5d MA (Moving Average)
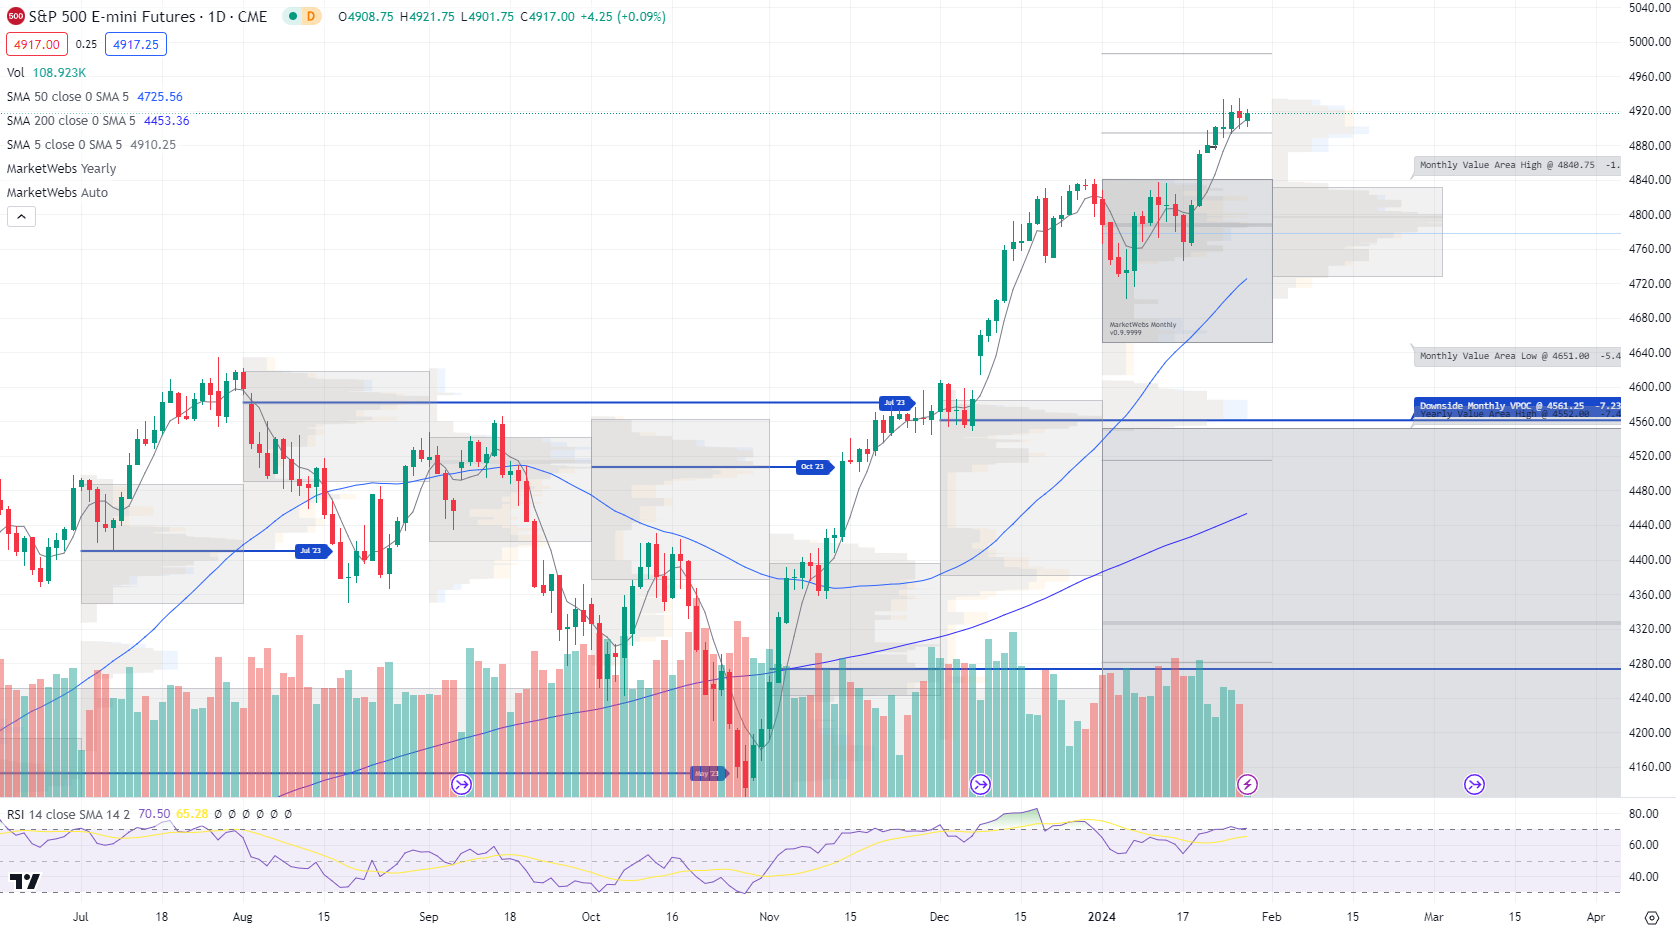
1hr chart: Price starts the week inside its new Value Area for the week, resistance to watch 4919.75 and support down at 4880

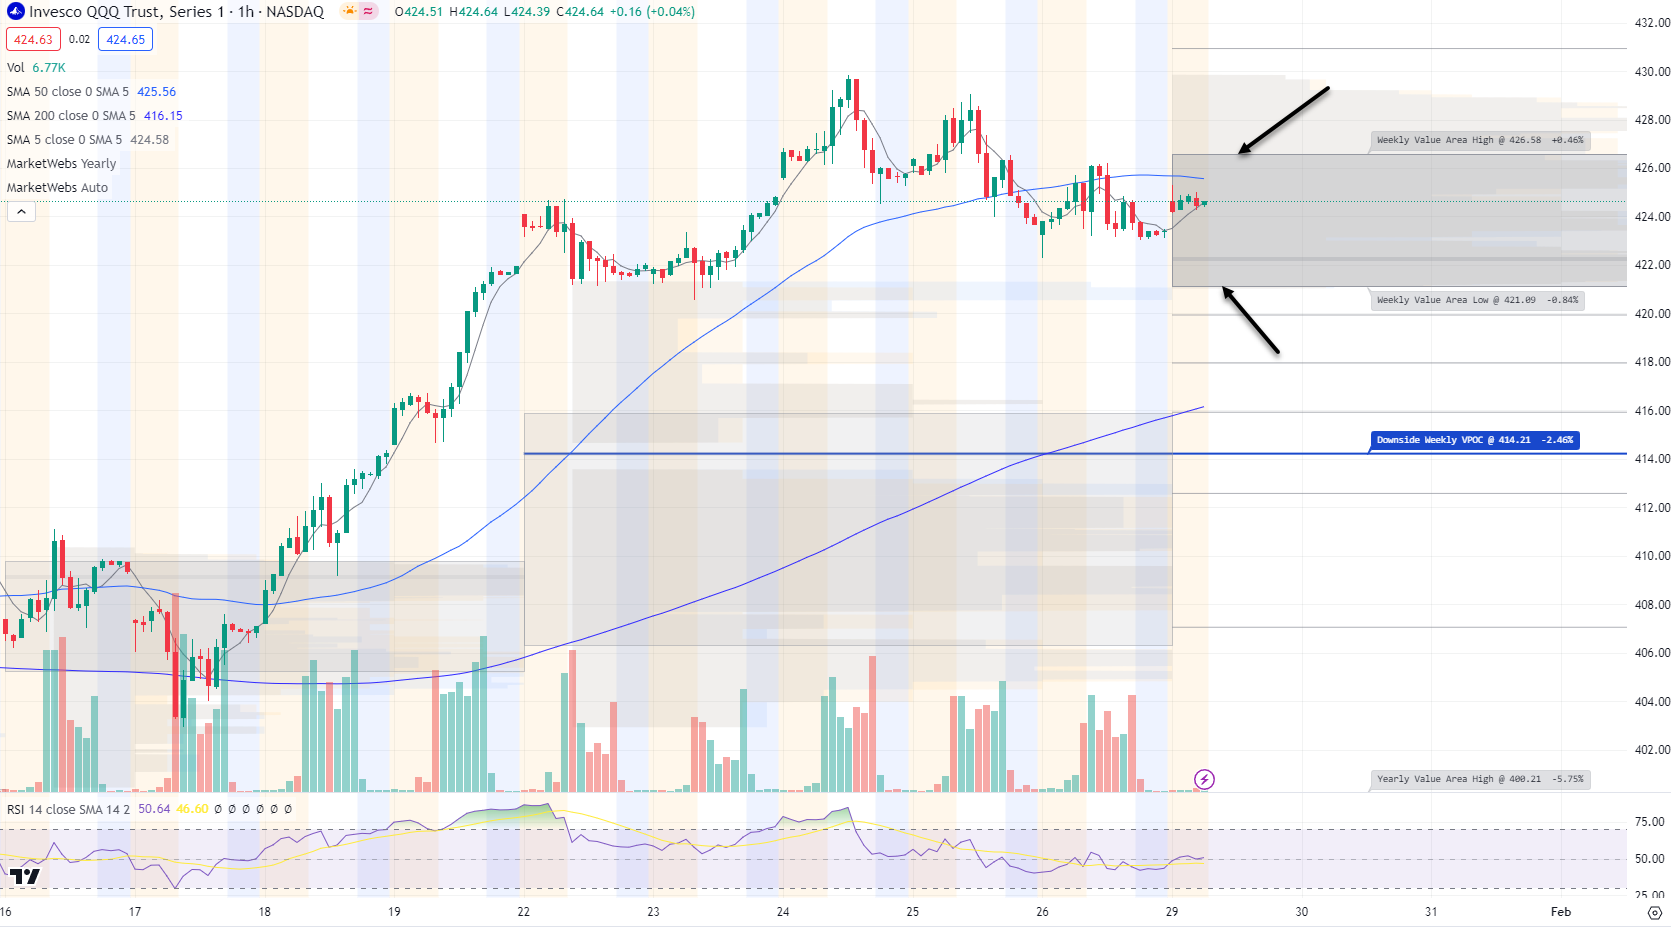
QQQ - NDX 100 ETF - Daily chart: Price ind. +0.2%, and will see if price can stay above its short term 5d MA today. Price remains above its Value Area for the month of Jan.
Reminder that QQQ / NDX has a huge week of earnings with MSFT AMD GOOGL reporting on 1/30; AAPL AMZN GOOGL reporting 2/1
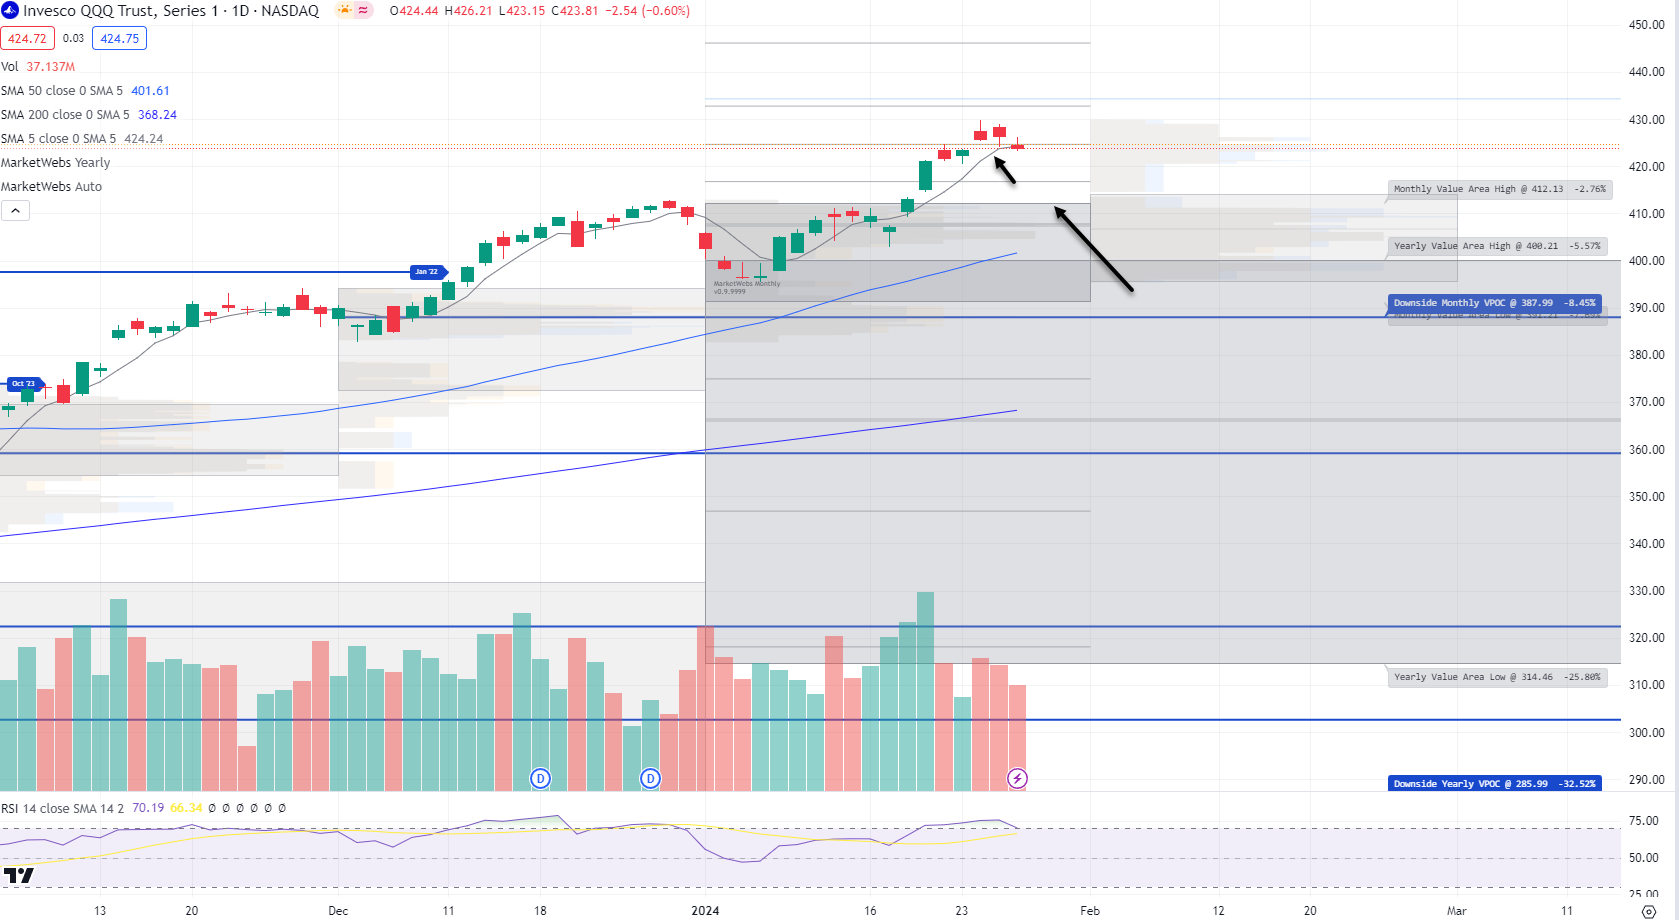
1hr chart: Price opens this week inside its new Value Area for the week, resistance $426.58 & support $421.09
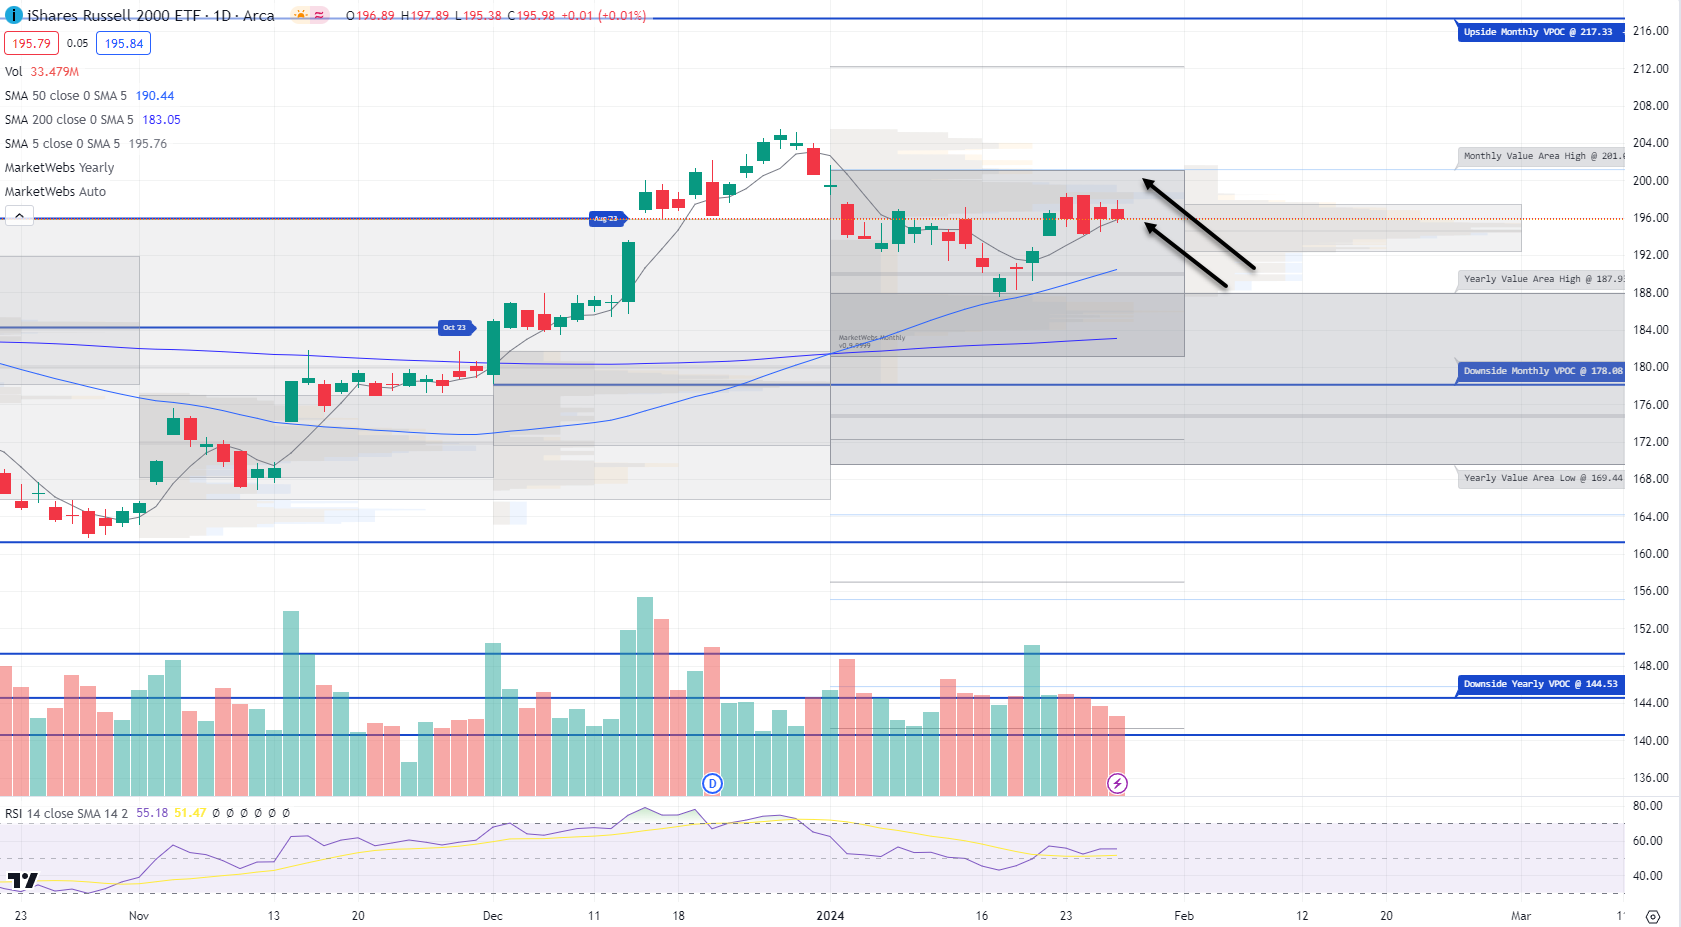
IWM - Russell Small Cap ETF- Price continues to be whippy without moving out of a range - and is trading inside its Jan Value Area & just above its 5d MA. Resistance is $201.08
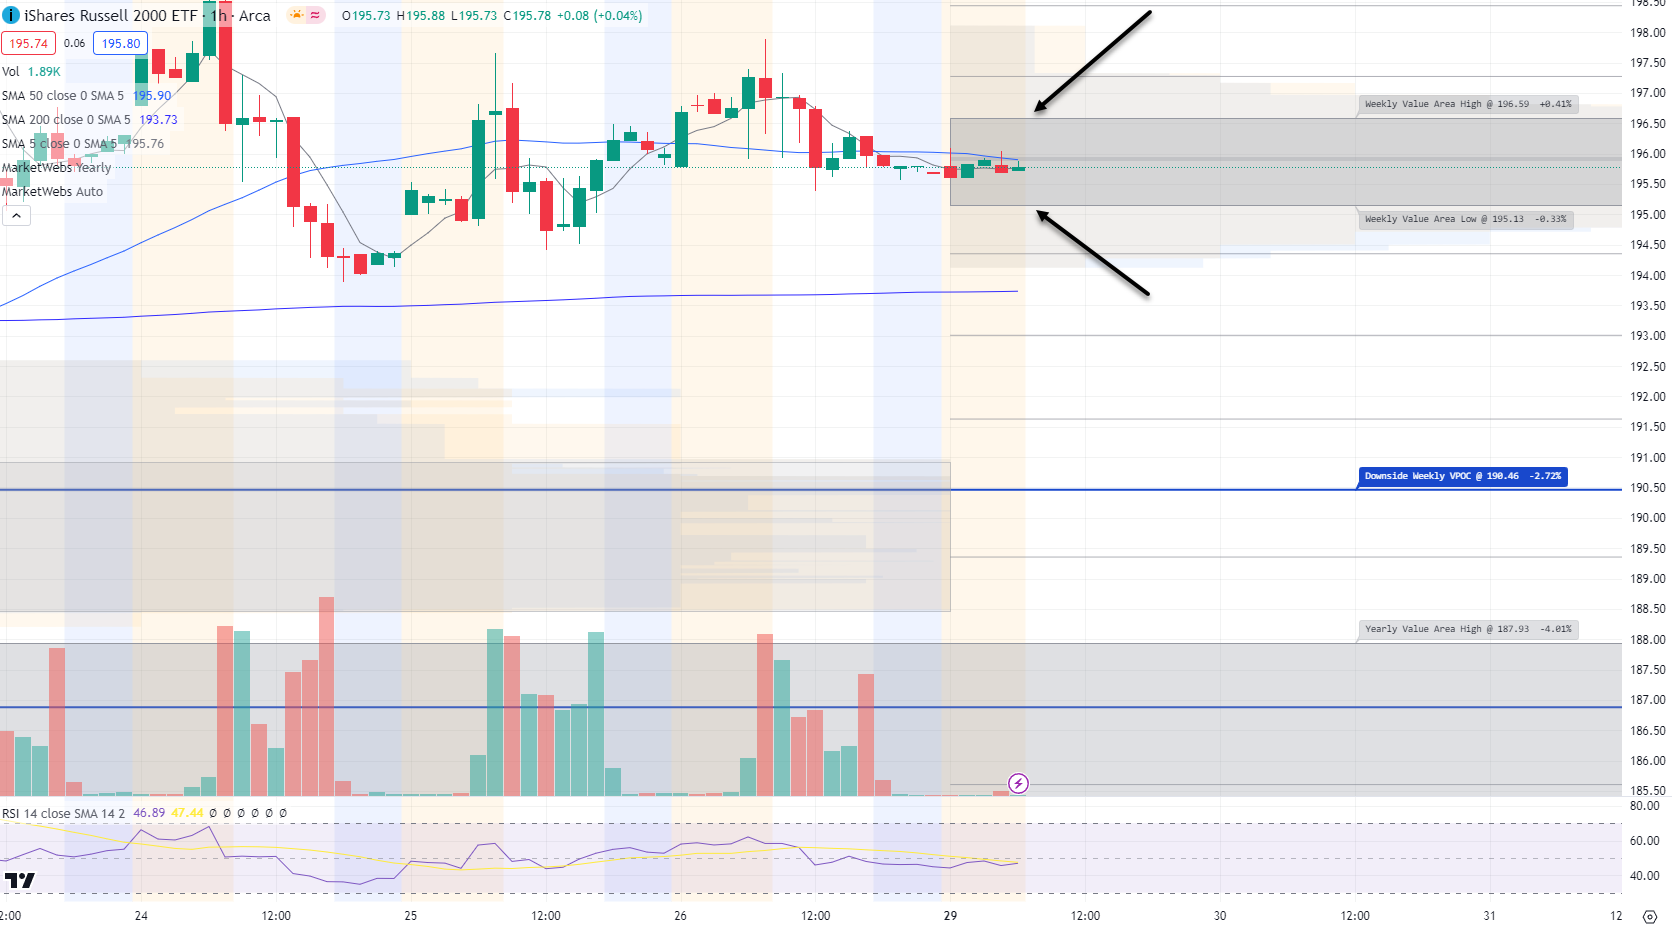
1hr chart: Price starts the week inside its new Value Area, resistance $196.59 / support $195.13
Here is today’s TTG Proprietary Stock Screen “Out of the Box” using Volume At Price
names trending above their Value Areas (on 3 multiple timeframes & not super extended)
Keep reading with a 7-day free trial
Subscribe to The Tribeca Trade Group to keep reading this post and get 7 days of free access to the full post archives.