

TTG Index Charts & Out of the Box Stock Screen 4/2/24 $TTE $TRMD
TTG Index Charts & Out of the Box Stock Screen 4/2/24 $TTE $TRMD
Out of the Box MarketWebs Screen
US Dollar -0.1% / 30yr Bonds -0.6% / Crude +1.5% & Nat Gas -2.0% / Gold +0.8% / Copper +0.9% / BTC -6.0%
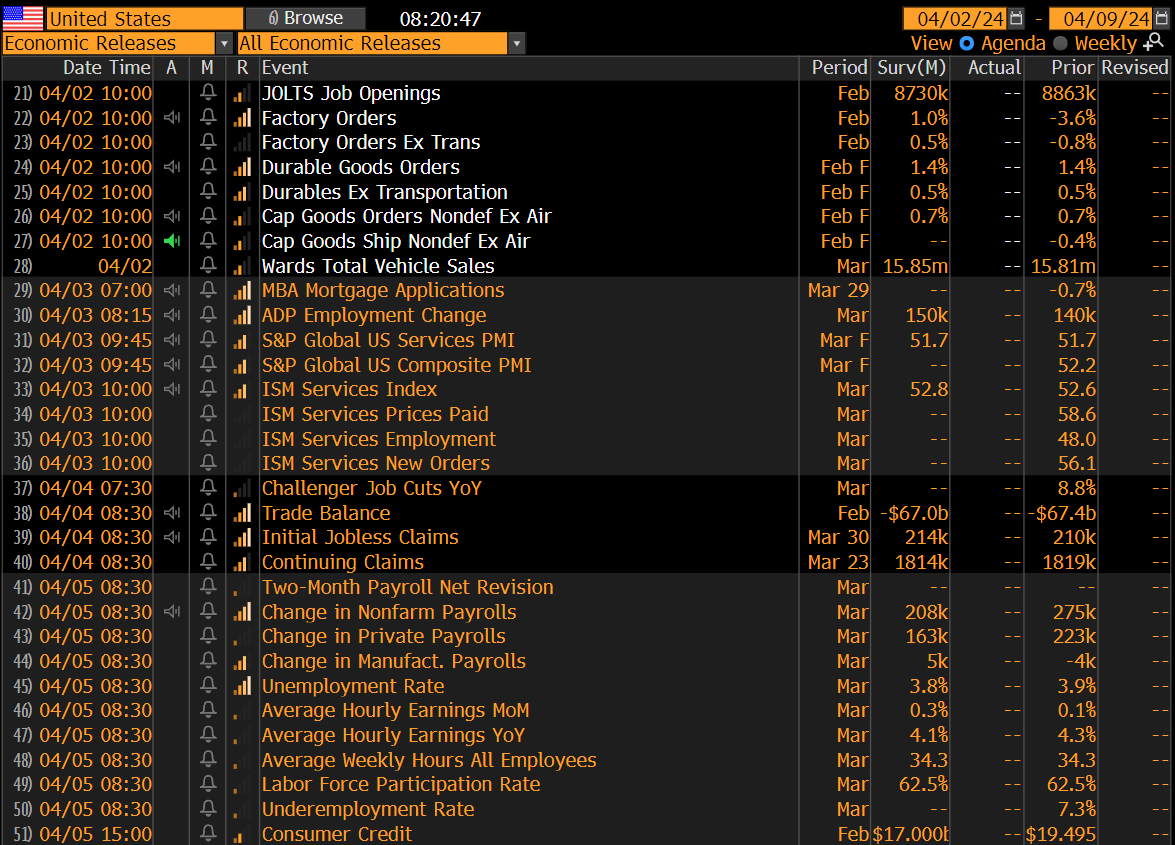
US Upcoming Economics
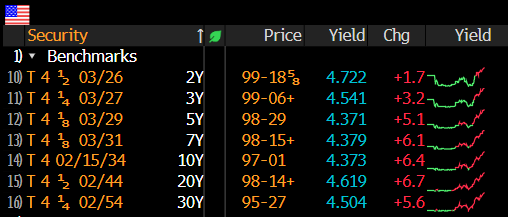
US Bond Yields
Index Updates
At TTG, I use Volume At Price in my chart analysis and I use the MarketWebs Indicator to provide Value Areas & VPOCs which indicate significant support & resistance levels. Learn More Here about Volume At Price and the MarketWebs.
ES_F - SPX Futures - Daily chart: Price ind. -0.4% as Bond yields continue to rise. Price continues to be in uptrend channel & above the April Value Area, support 5245.5
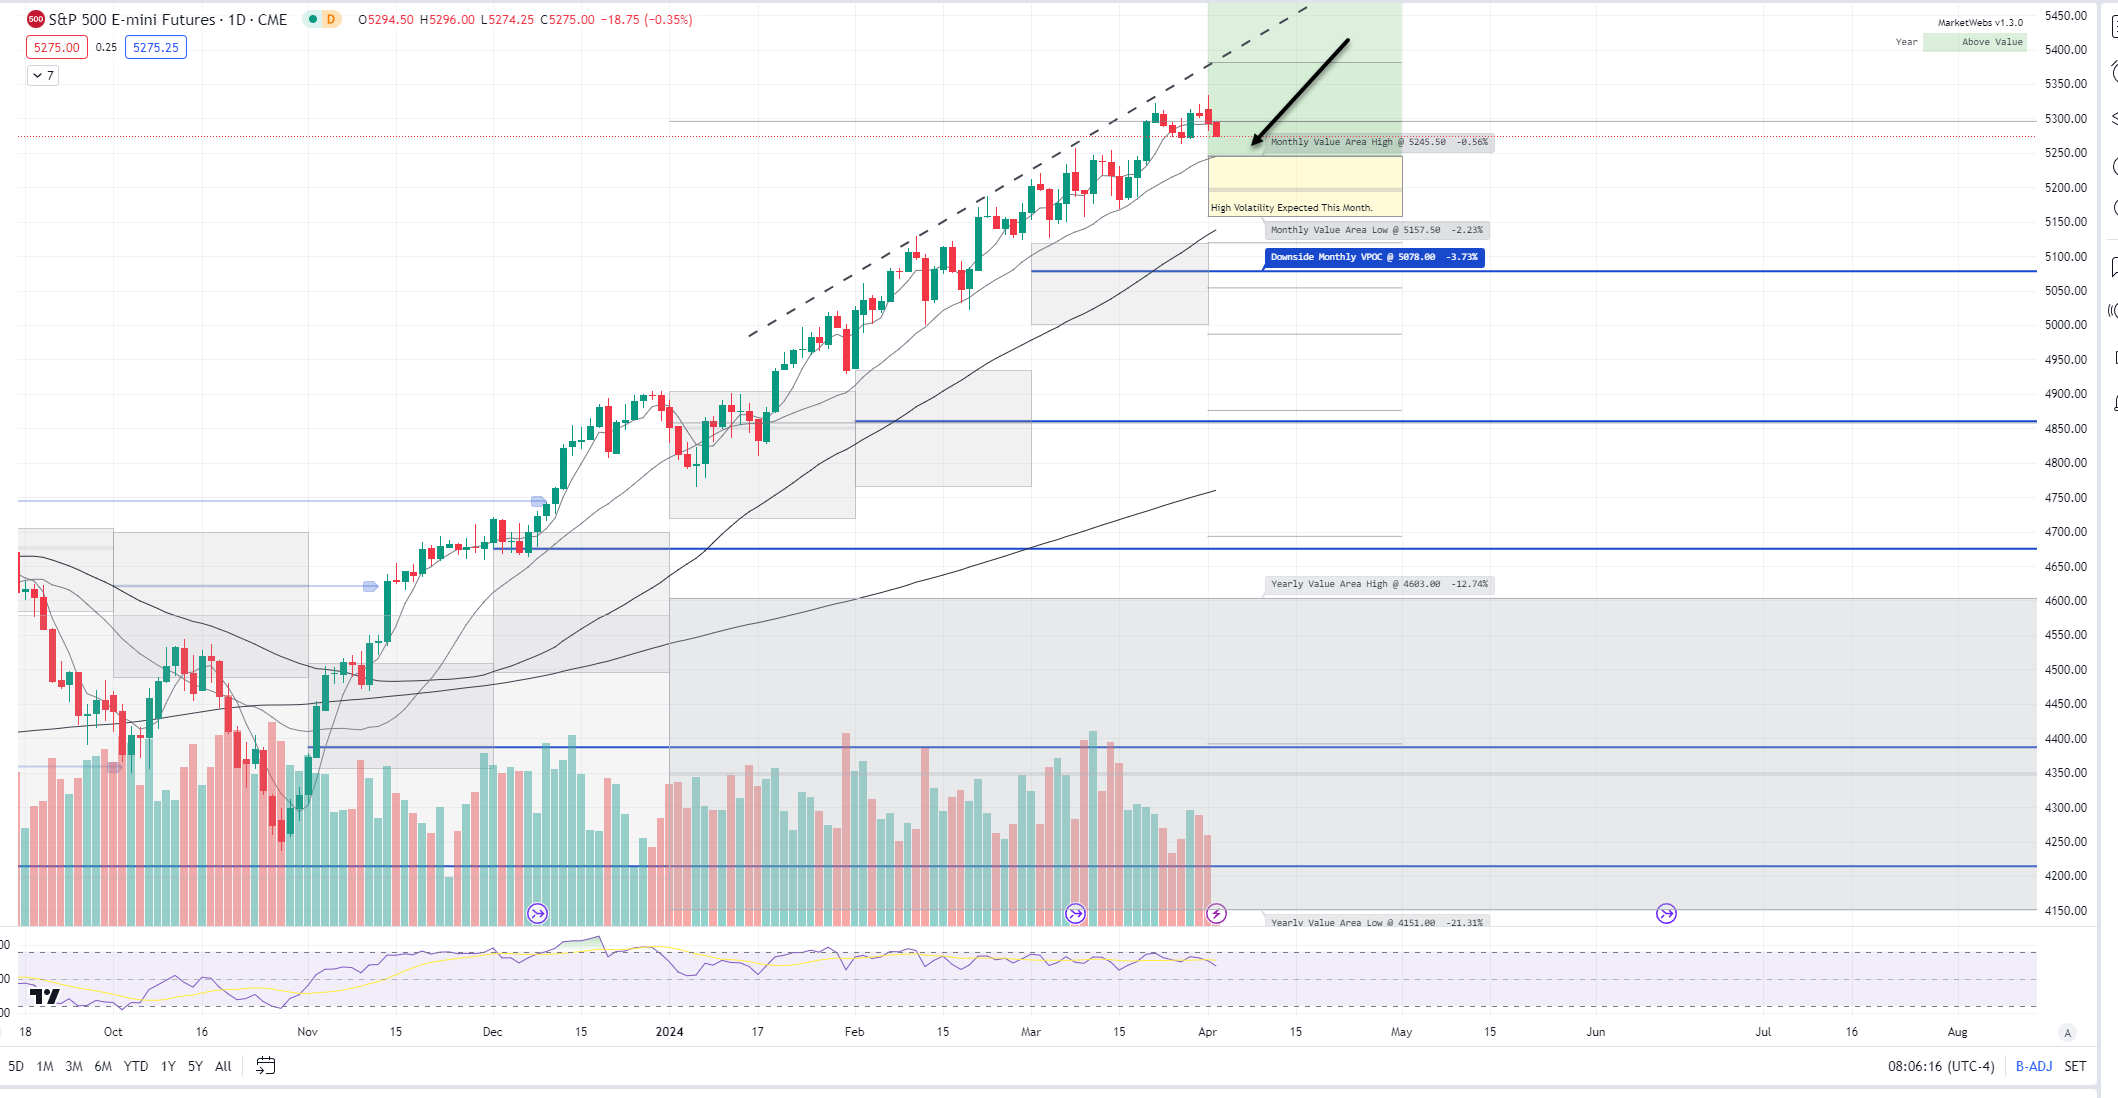
1hr chart: Bearish 80% rule continuing to play out , bottom of Value Area is first support support level to watch 5258.25
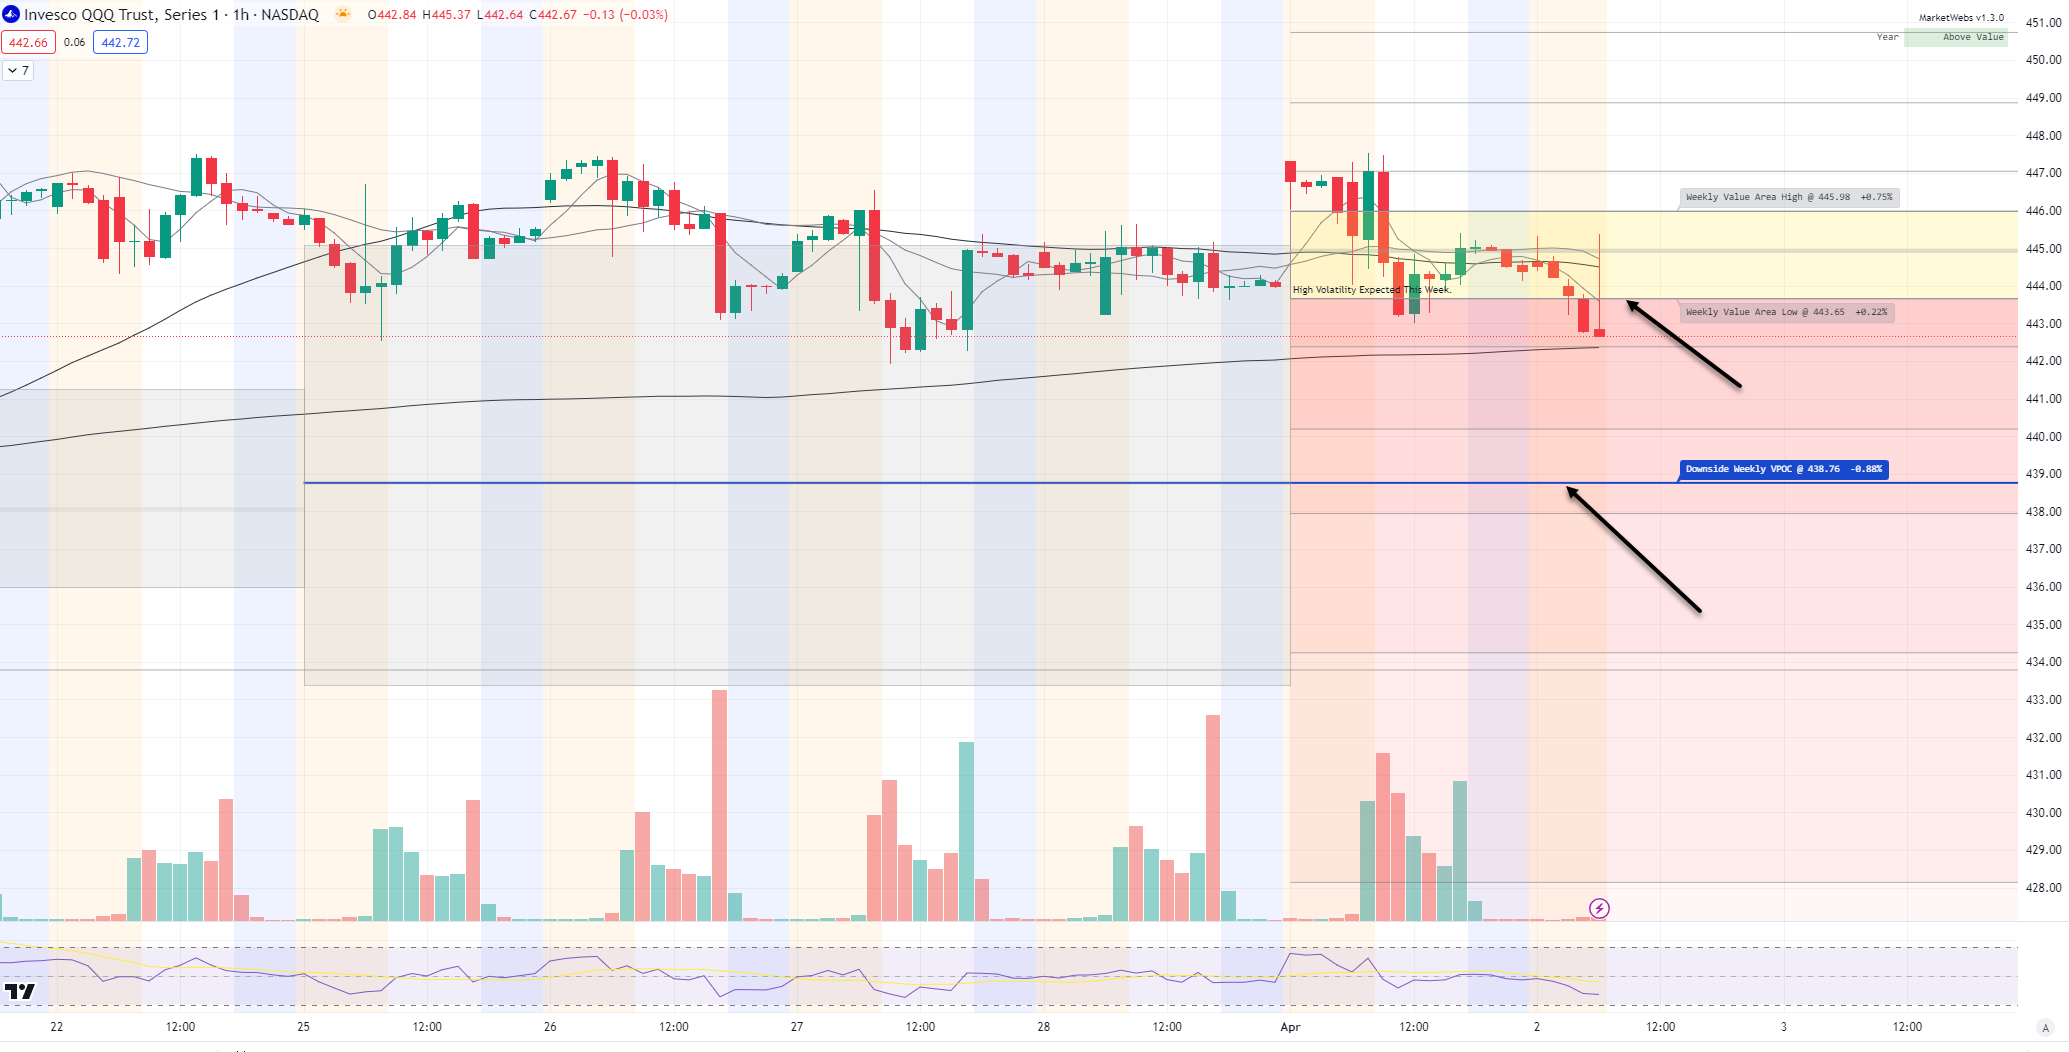
QQQ - NDX 100 ETF - Daily chart: Price ind. -0.5% and breaking into its Apr Value Area, upside level to watch today $444.57 and bottom of Value Area support is $435.85
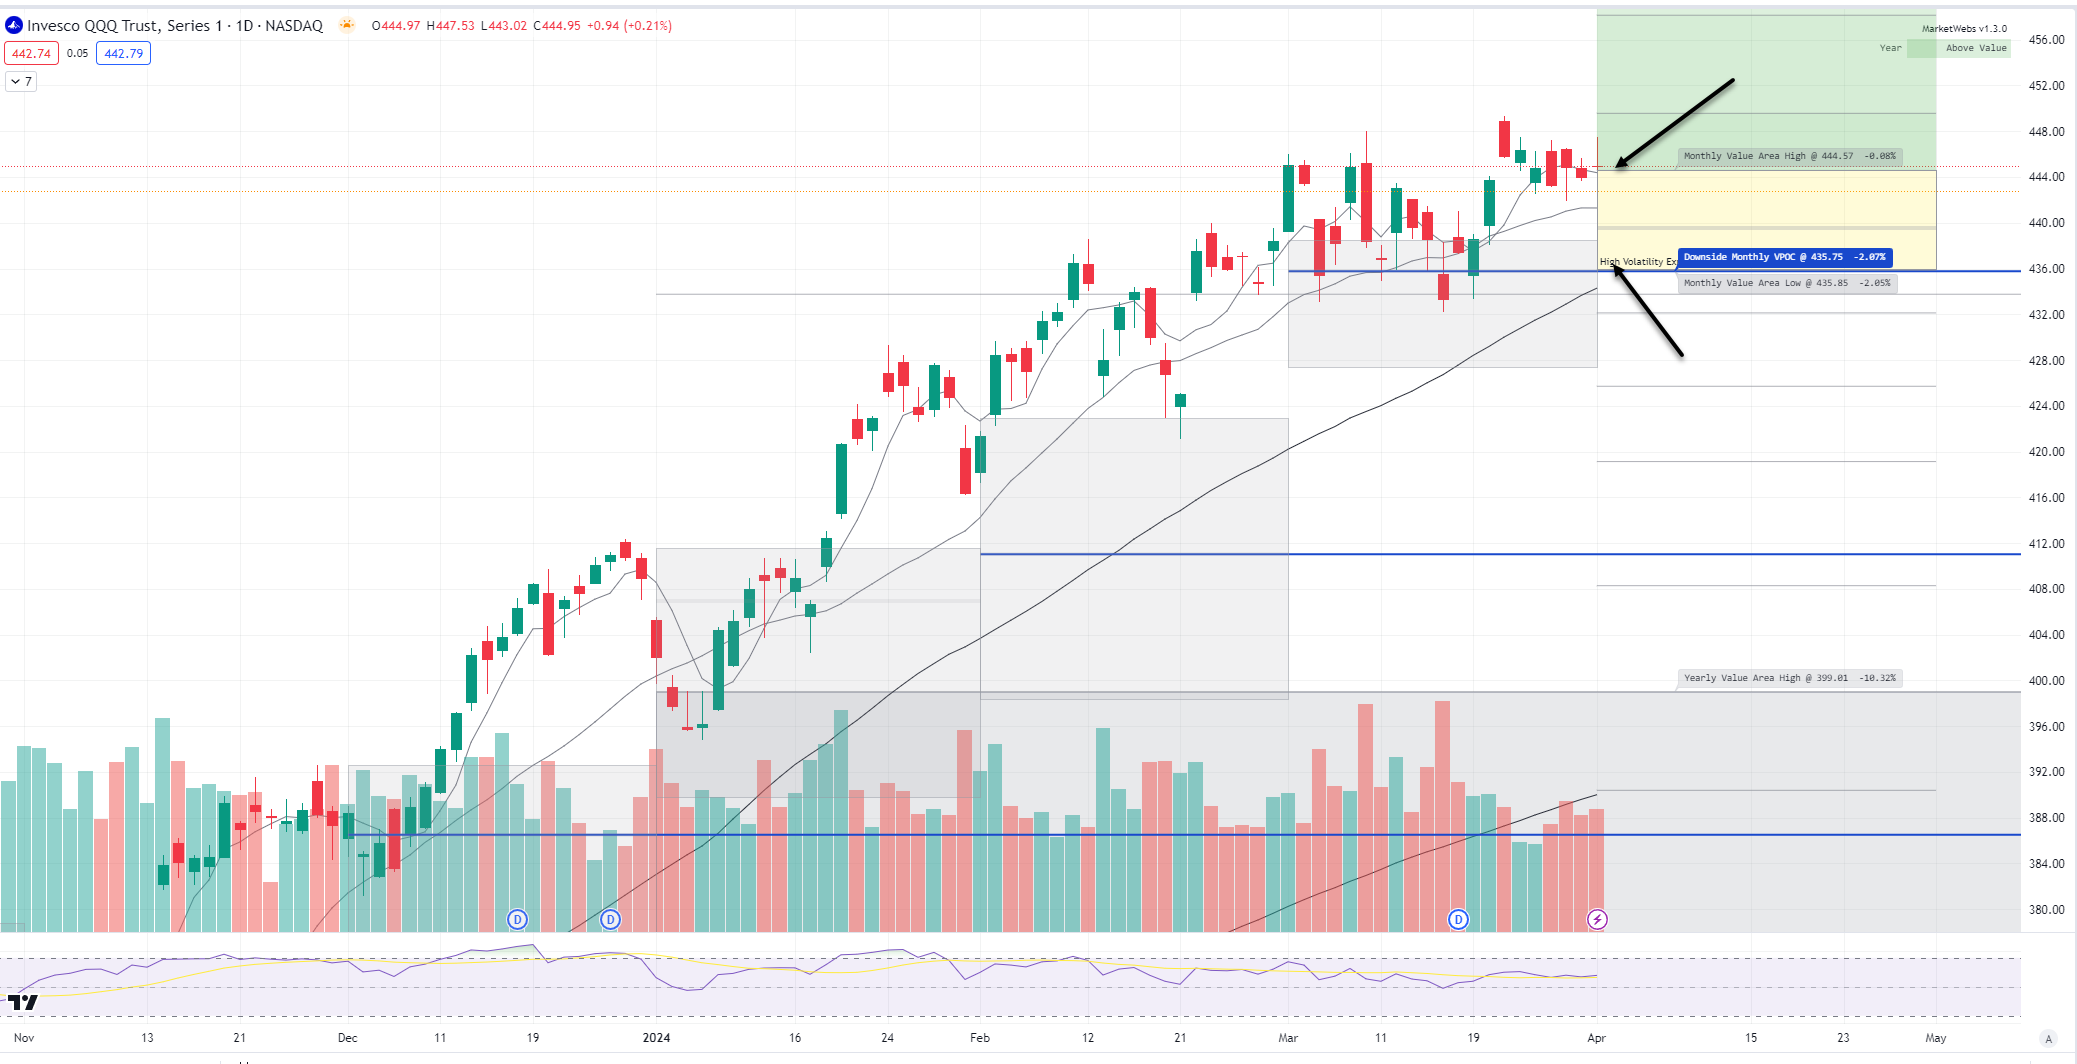
1hr chart: Price falling below its Value Area for the week, support is now resistance, watch $443.65
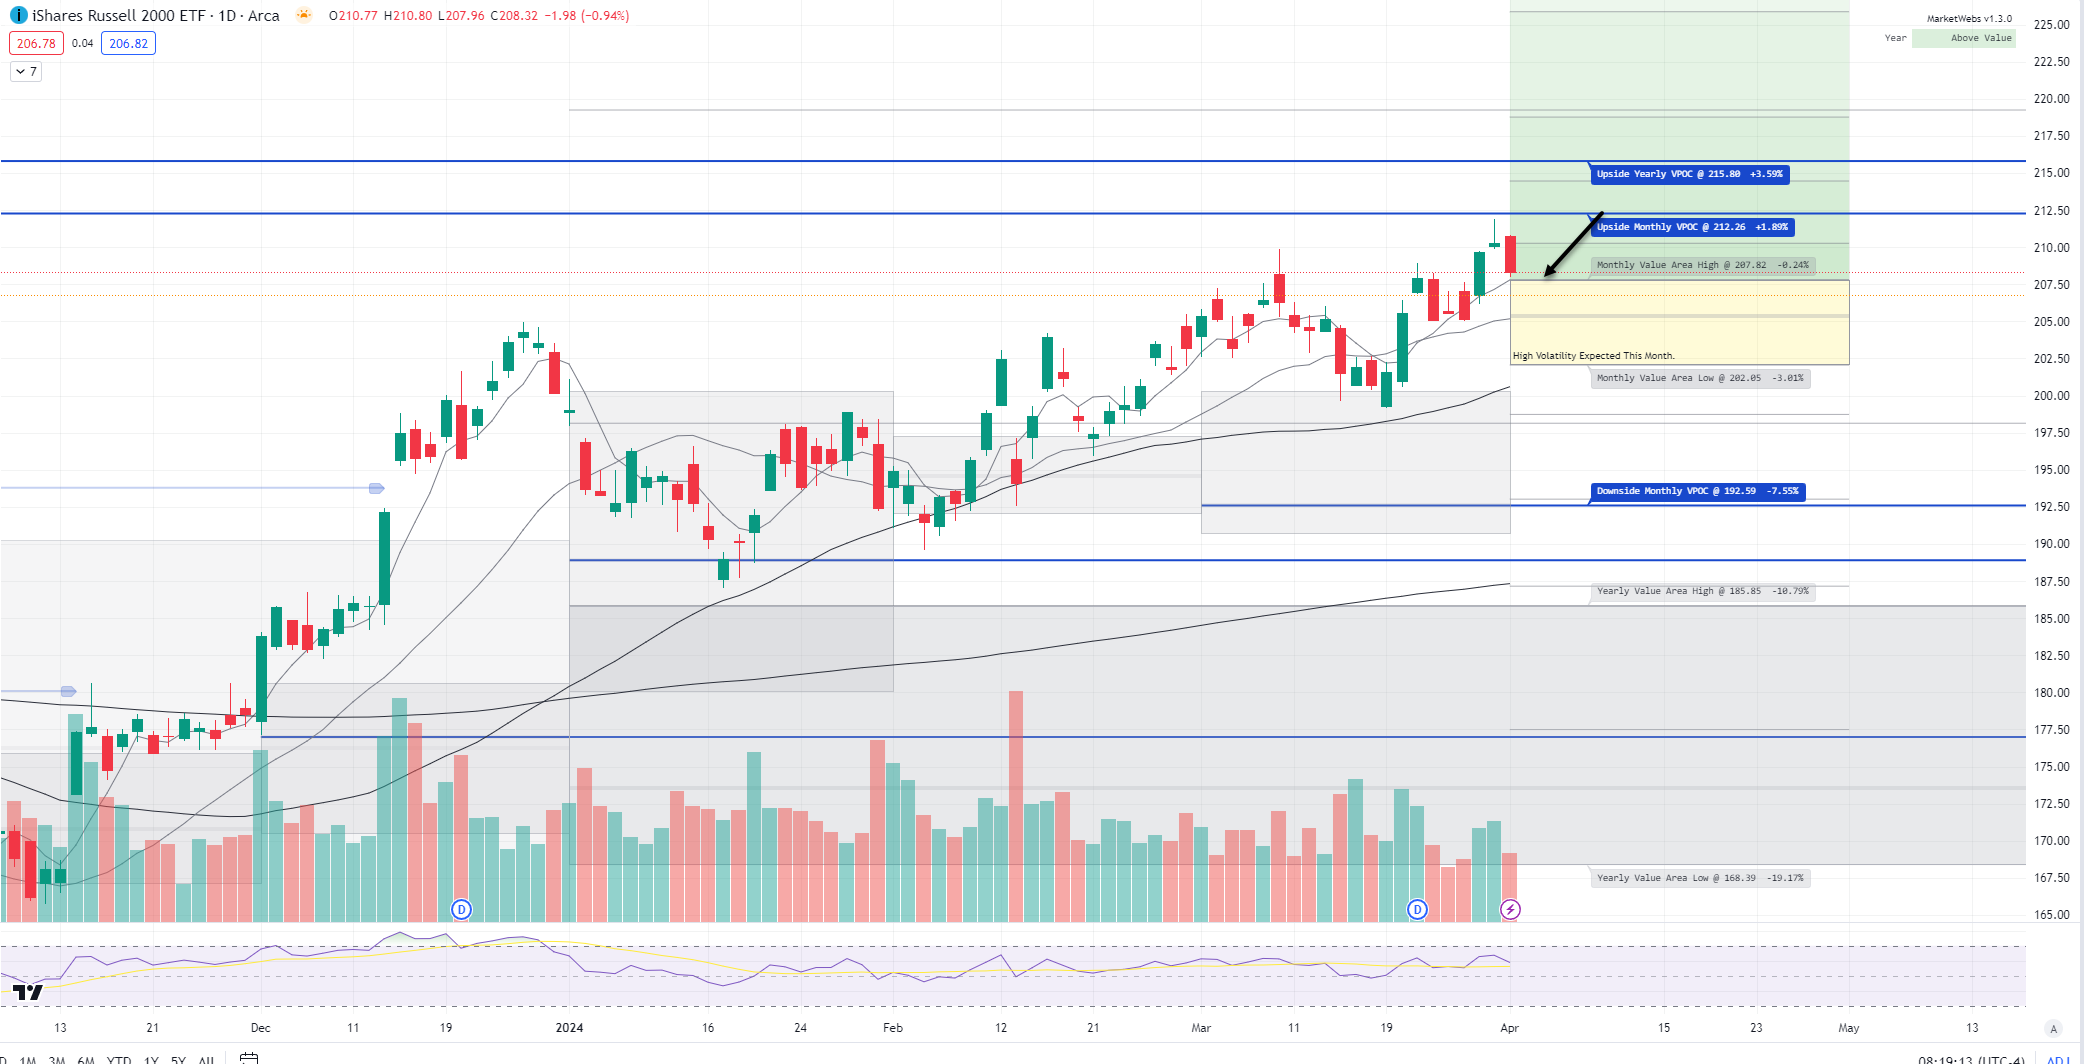
IWM - Russell Small Cap ETF- Price ind. -0.7% this morning and underperforming as yields move higher & price has now broken into its April Value Area , watch $207.82 (note, price has not updated on this chart for premkt activity)
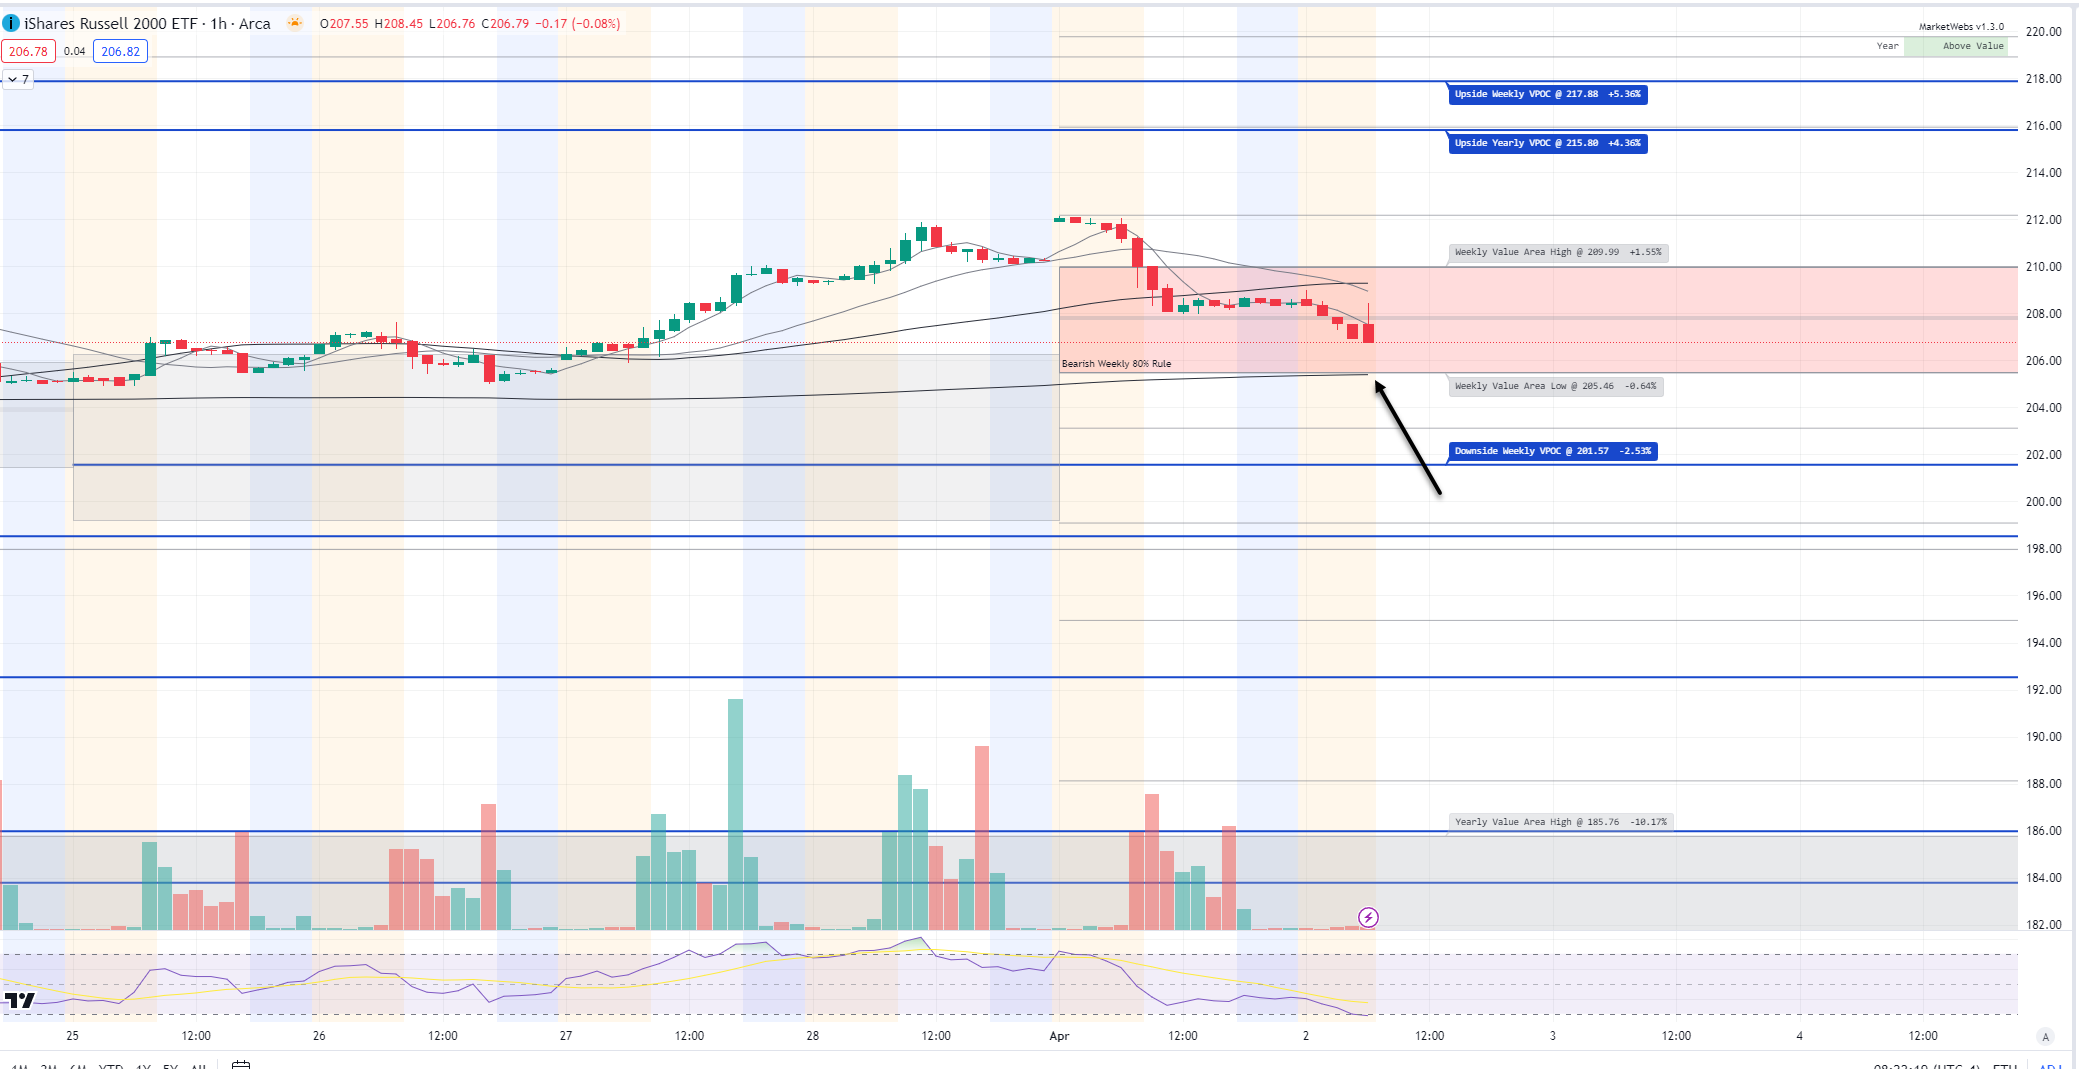
1hr chart: Price falling through its Value Area for the week, 1st level of support to watch is $205.46
Here is today’s TTG Proprietary Stock Screen “Out of the Box” using Volume At Price
names trending above their Value Areas (on 3 multiple timeframes & not super extended)
Keep reading with a 7-day free trial
Subscribe to The Tribeca Trade Group to keep reading this post and get 7 days of free access to the full post archives.