

TTG Index Charts & Out of the Box Stock Screen 4/4/24 $TECK
TTG Index Charts & Out of the Box Stock Screen 4/4/24 $TECK
Out of the Box MarketWebs Screen
US Dollar -0.1% / 30yr Bonds -0.2% / Crude -0.3% & Nat Gas -0.7% / Gold -0.5% / Copper +1.0% / BTC +1.0%
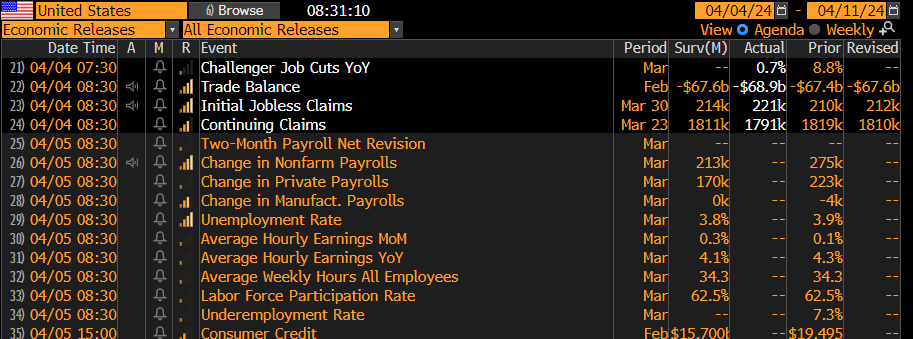
US Upcoming Economics
US Bond Yields
Index Updates
At TTG, I use Volume At Price in my chart analysis and I use the MarketWebs Indicator to provide Value Areas & VPOCs which indicate significant support & resistance levels. Learn More Here about Volume At Price and the MarketWebs.
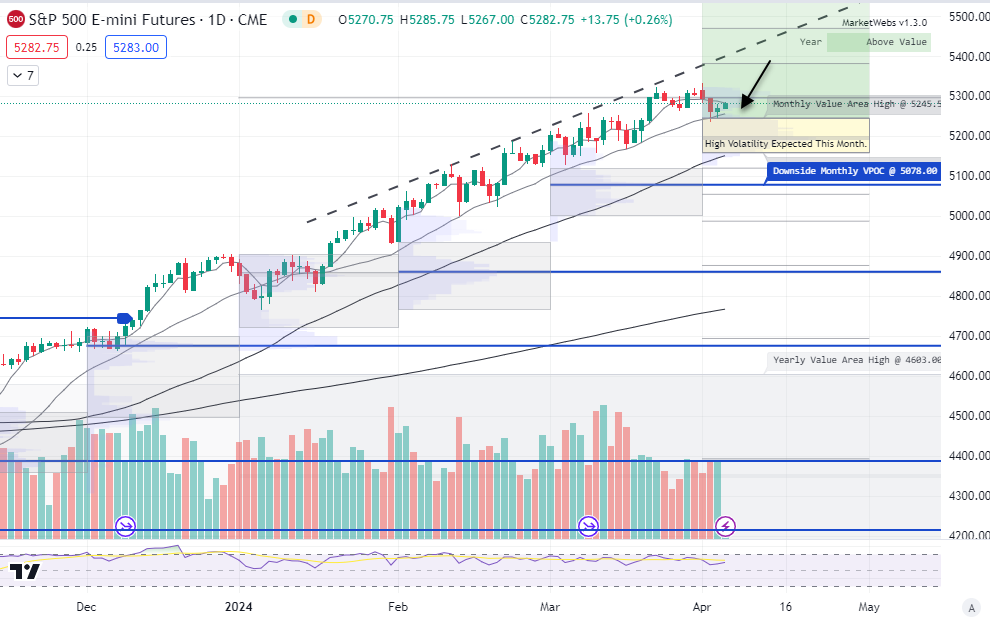
ES_F - SPX Futures - Daily chart: Prices continuing to bounce this morning +0.3% and price held support yesterday, 5245.5 top of Apr Value Area and 20d MA - these are the levels I want to continue to watch. Note, price has not reclaimed its short -term 5d MA, something to watch for upside continuation
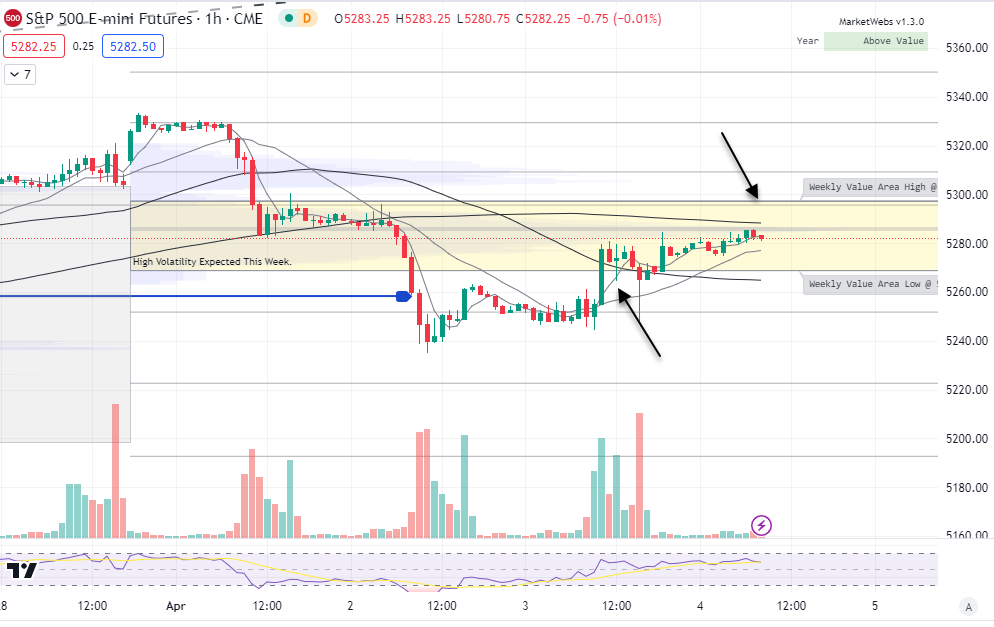
1hr chart: Price back inside its Value Area for the week, levels to watch below
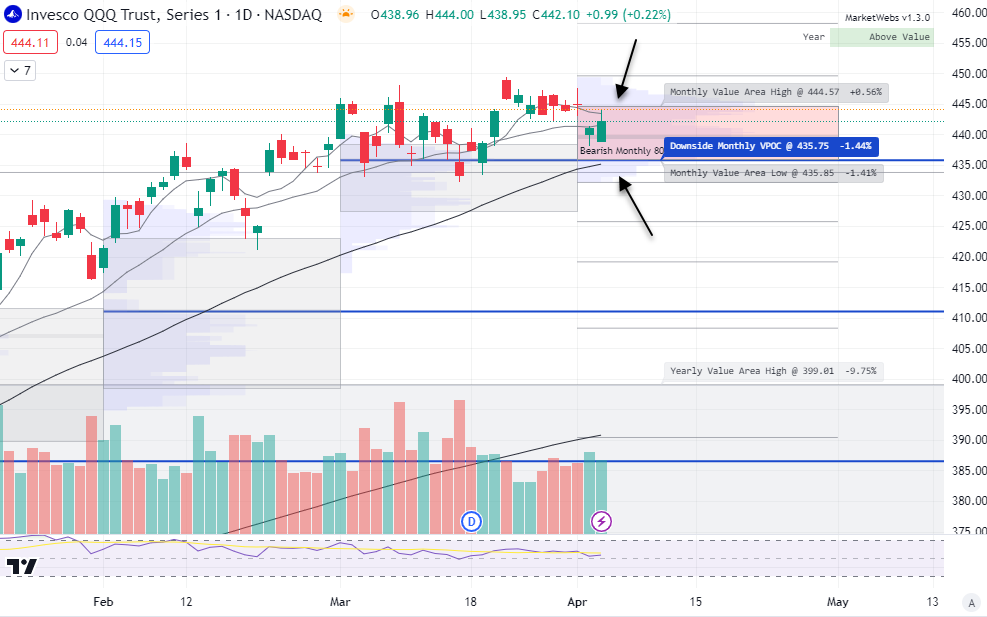
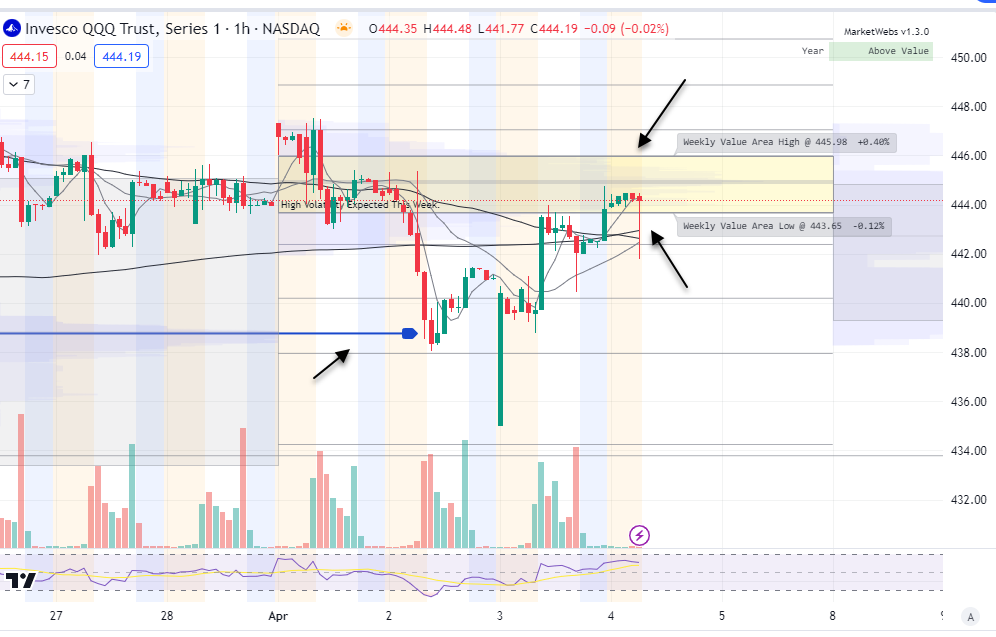
QQQ - NDX 100 ETF - Daily chart: Price ind. +0.4% and will be testing top of its Apr Value Area, watch $444.57 resistance
1hr chart: Price is now back inside its Value Area after a nice reversal on the lower VPOC on Monday , support to watch $443.65 & resistance $445.98
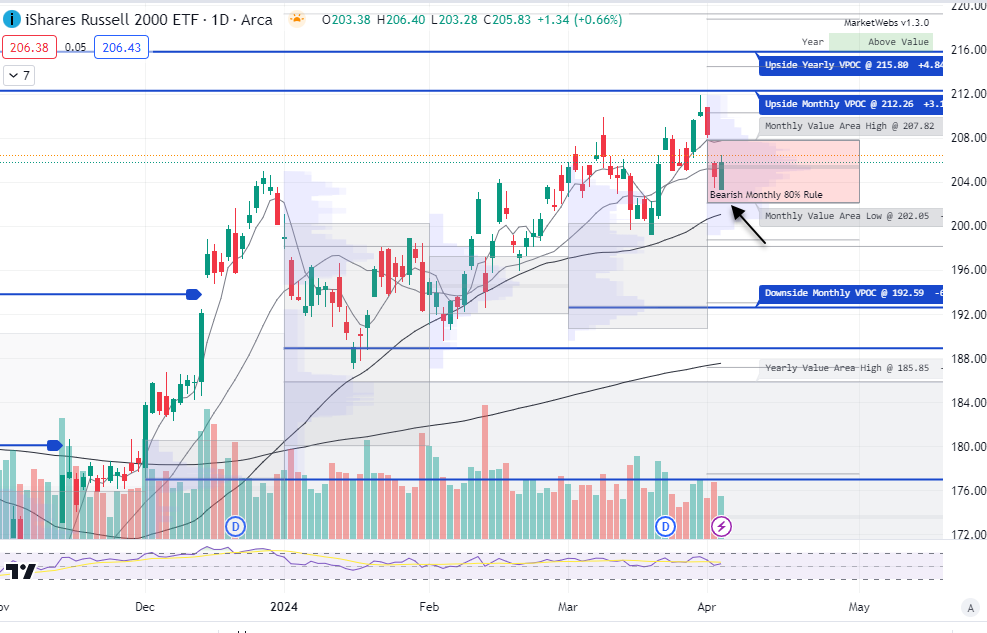
IWM - Russell Small Cap ETF- Price outperformed yesterday (IWM +0.7%) and pie held where it needed to at bottom of Value support $202.05
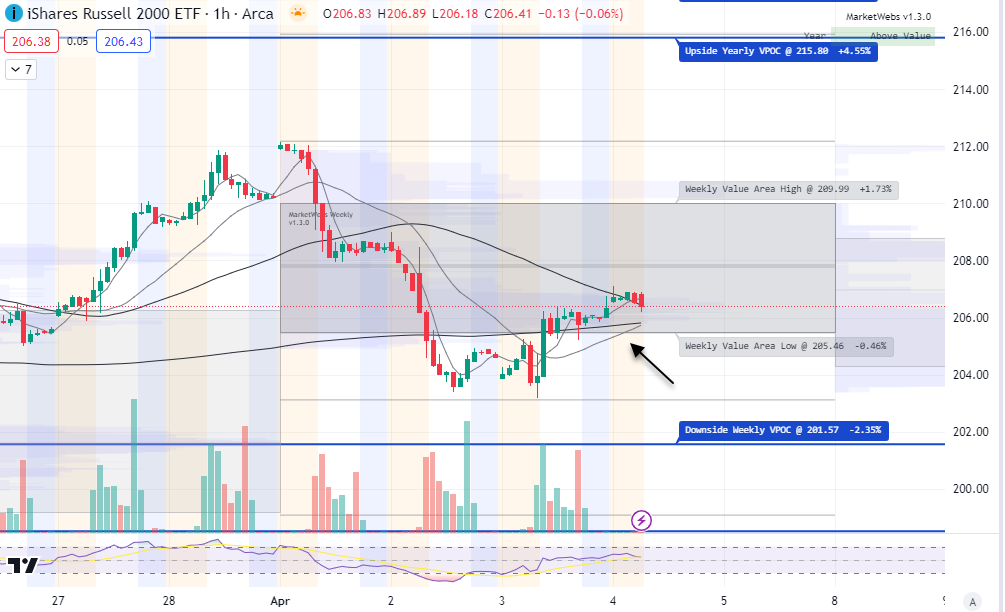
1hr chart: Price also reclaimed its Value Area for week , watch $205.46 support. Also, note there has not been much of a bond recovery so I view the IWM move yesterday more of a bounce vs sustained move higher
Here is today’s TTG Proprietary Stock Screen “Out of the Box” using Volume At Price
names trending above their Value Areas (on 3 multiple timeframes & not super extended)
Keep reading with a 7-day free trial
Subscribe to The Tribeca Trade Group to keep reading this post and get 7 days of free access to the full post archives.