

TTG Index Charts & Out of the Box Stock Screen 3/14/24 $MNST
TTG Index Charts & Out of the Box Stock Screen 3/14/24 $MNST
Out of the Box MarketWebs Screen
US Dollar +0.1% / 30yr Bonds flat / Crude +0.7% & Nat Gas -0.4% / Gold -0.4% / Copper -0.5% / BTC -0.4%
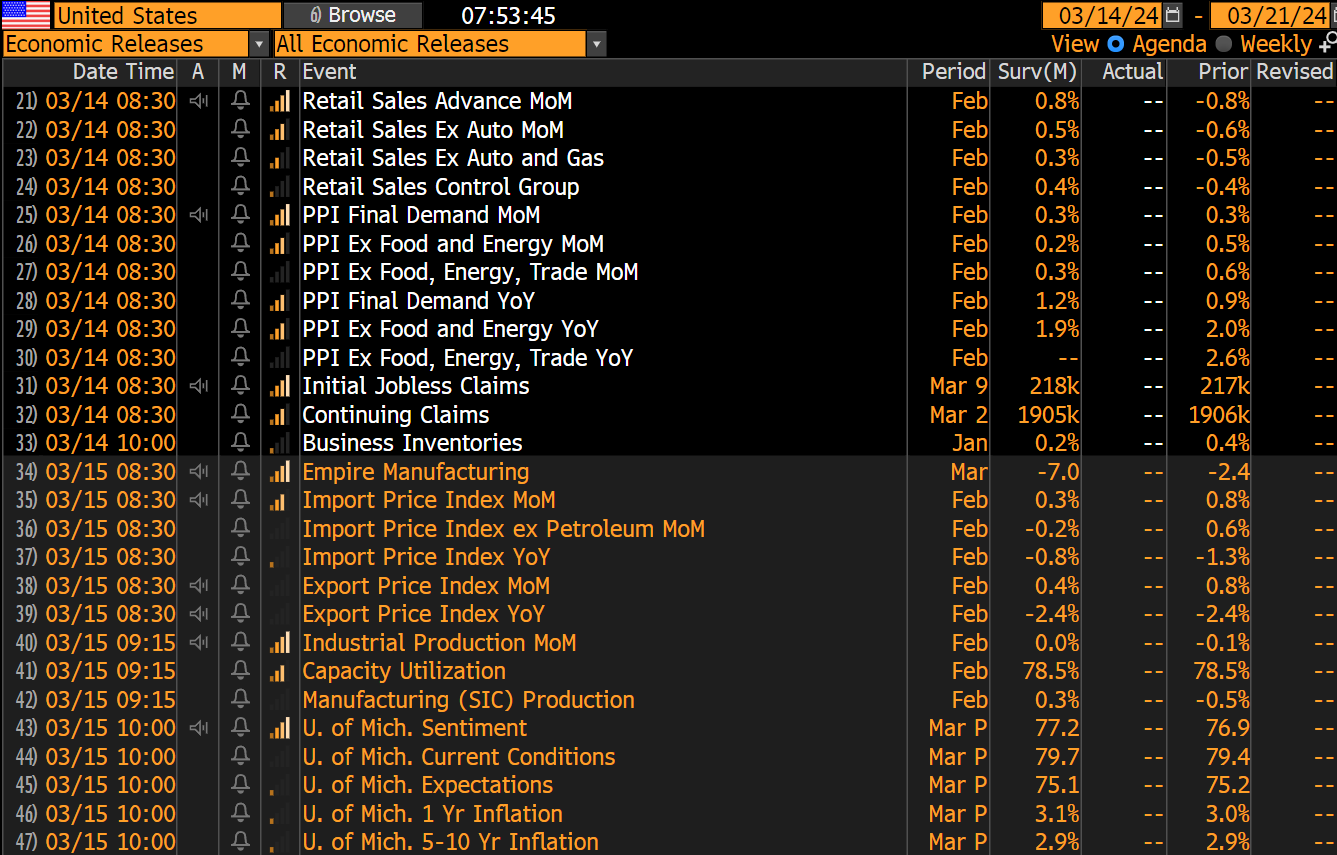
US Upcoming Economics
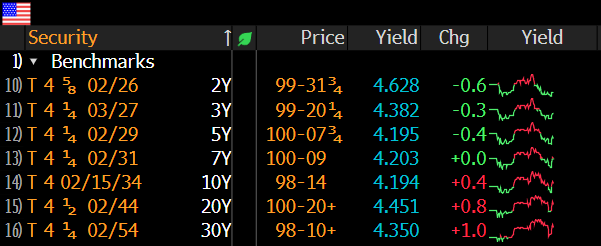
US Bond Yields
Index Updates
At TTG, I use Volume At Price in my chart analysis and I use the MarketWebs Indicator to provide Value Areas & VPOCs which indicate significant support & resistance levels. Learn More Here about Volume At Price and the MarketWebs.
ES_F - SPX Futures - Price rallying into this morning Economic reports (PPI, Retail Sales) ind. +0.3% and price remains inside the uptrend channel
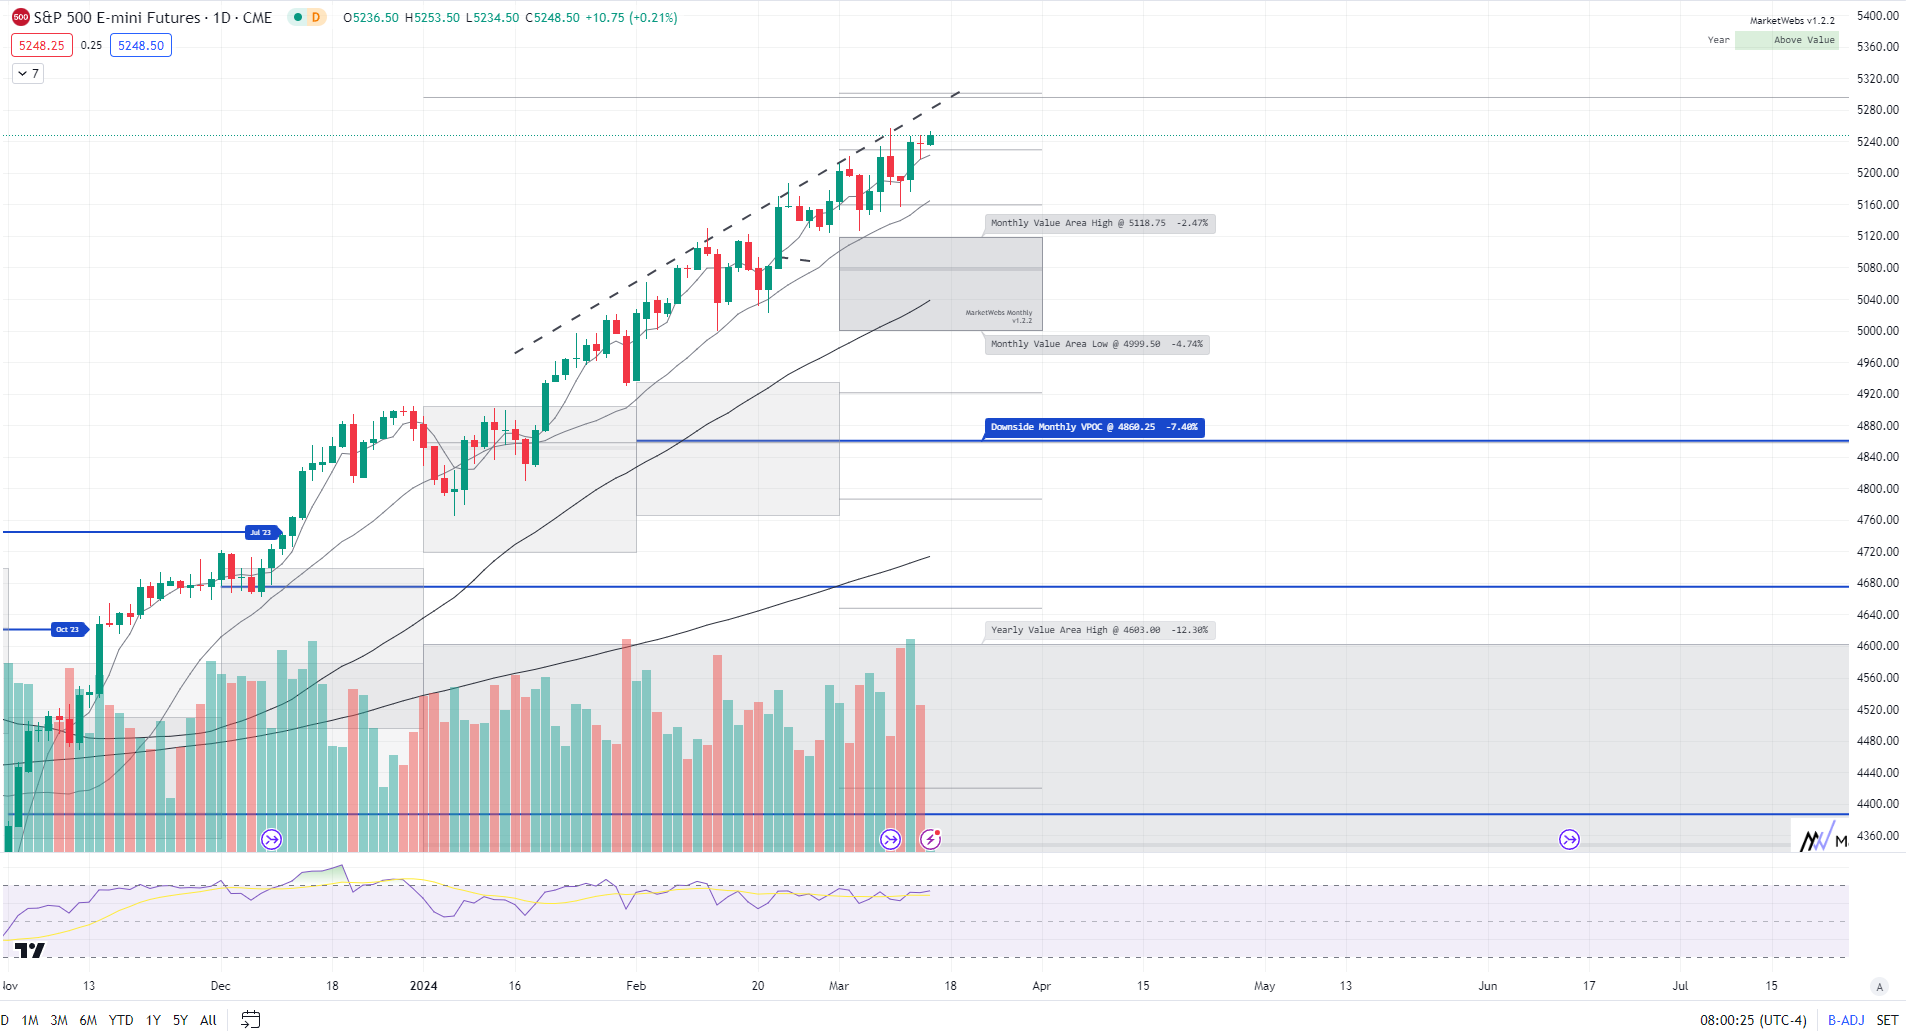
1hr chart: Price is above its Value Area for the week and testing Friday's highs, support to watch 5231.5

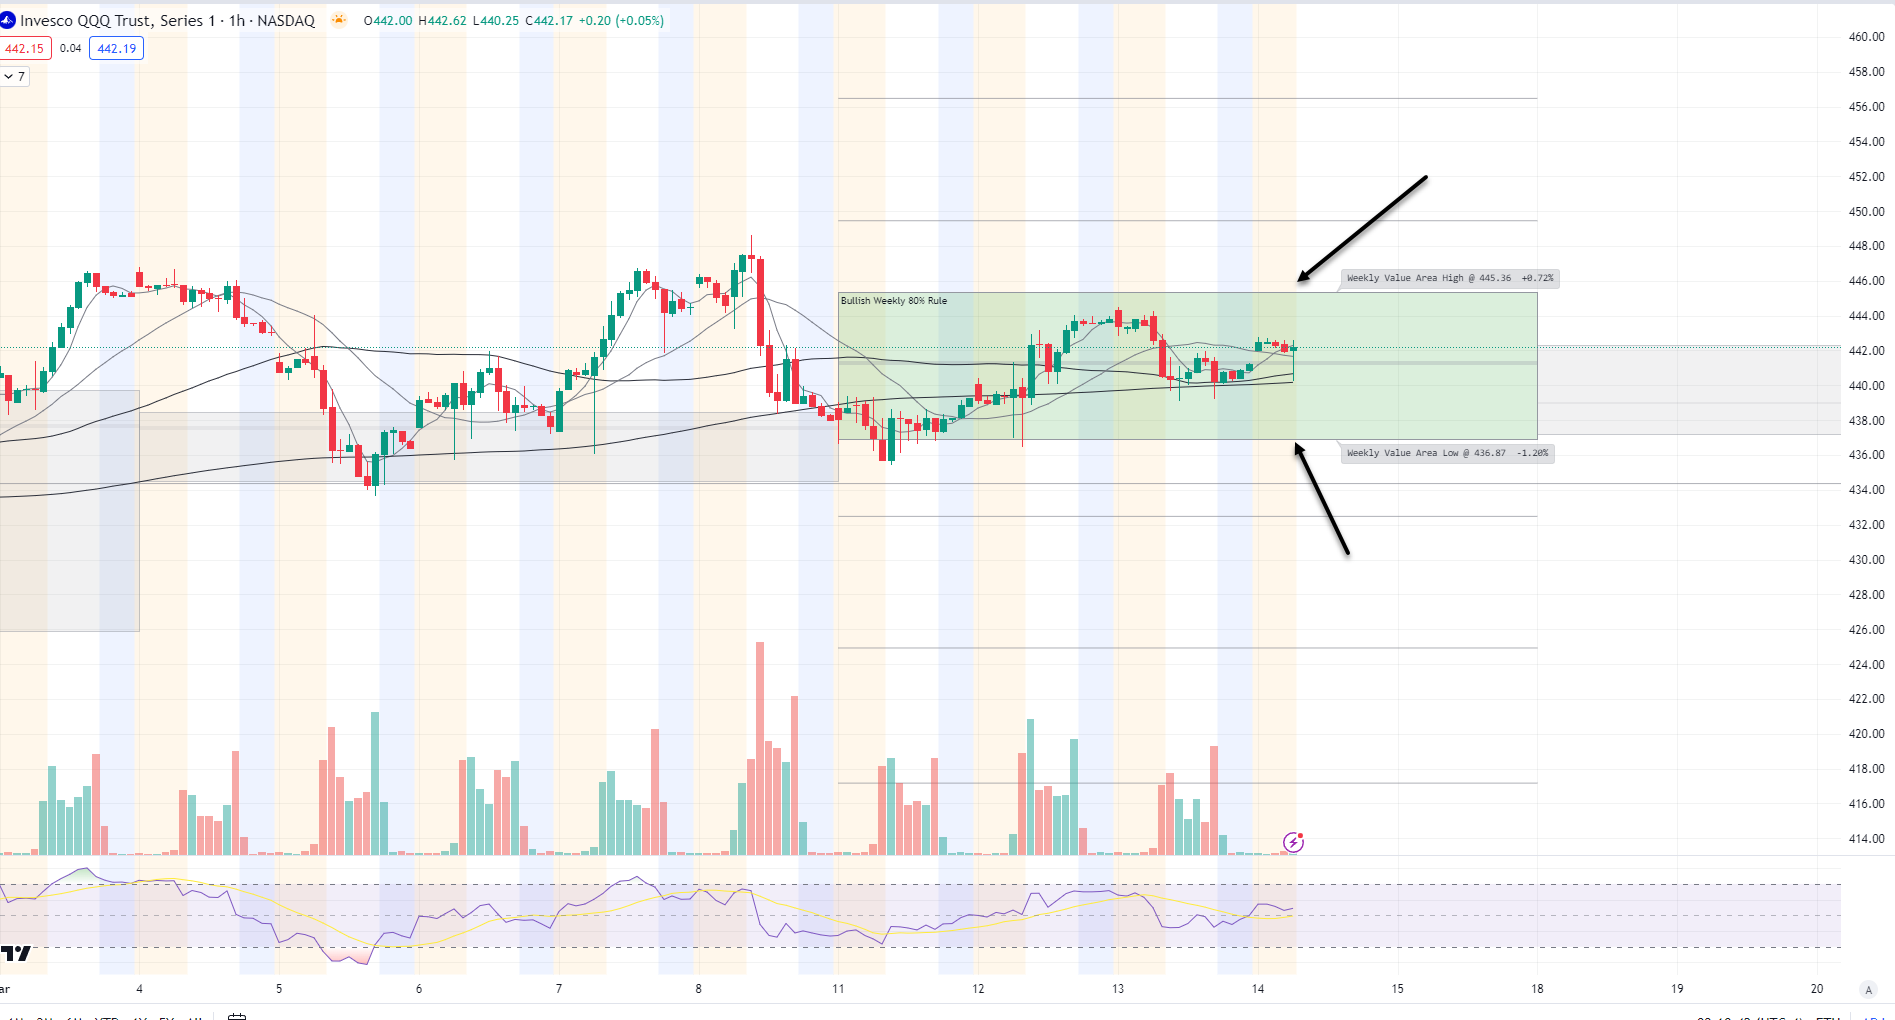
QQQ - NDX 100 ETF - Daily chart: Price ind. +0.4% and yesterday price held above its Mar Value Area, support to watch $439.06
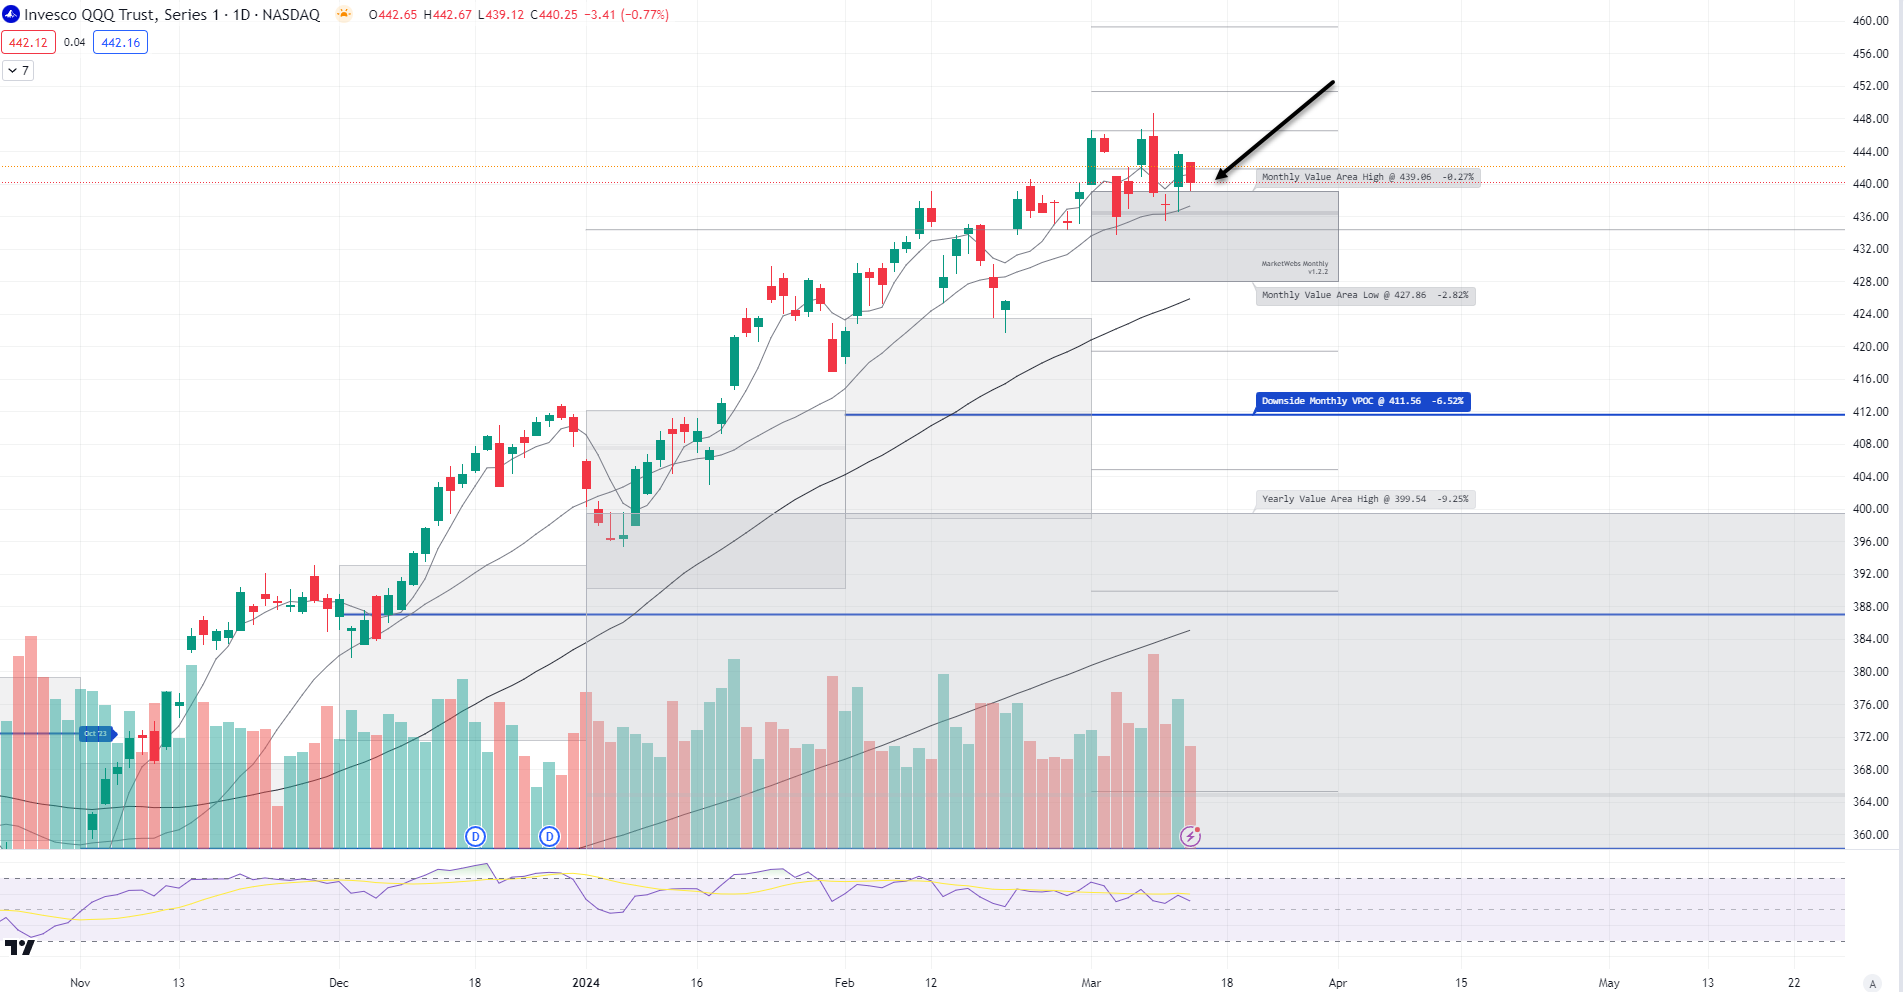
1hr chart: Price inside its Value Area for the week, levels to watch below
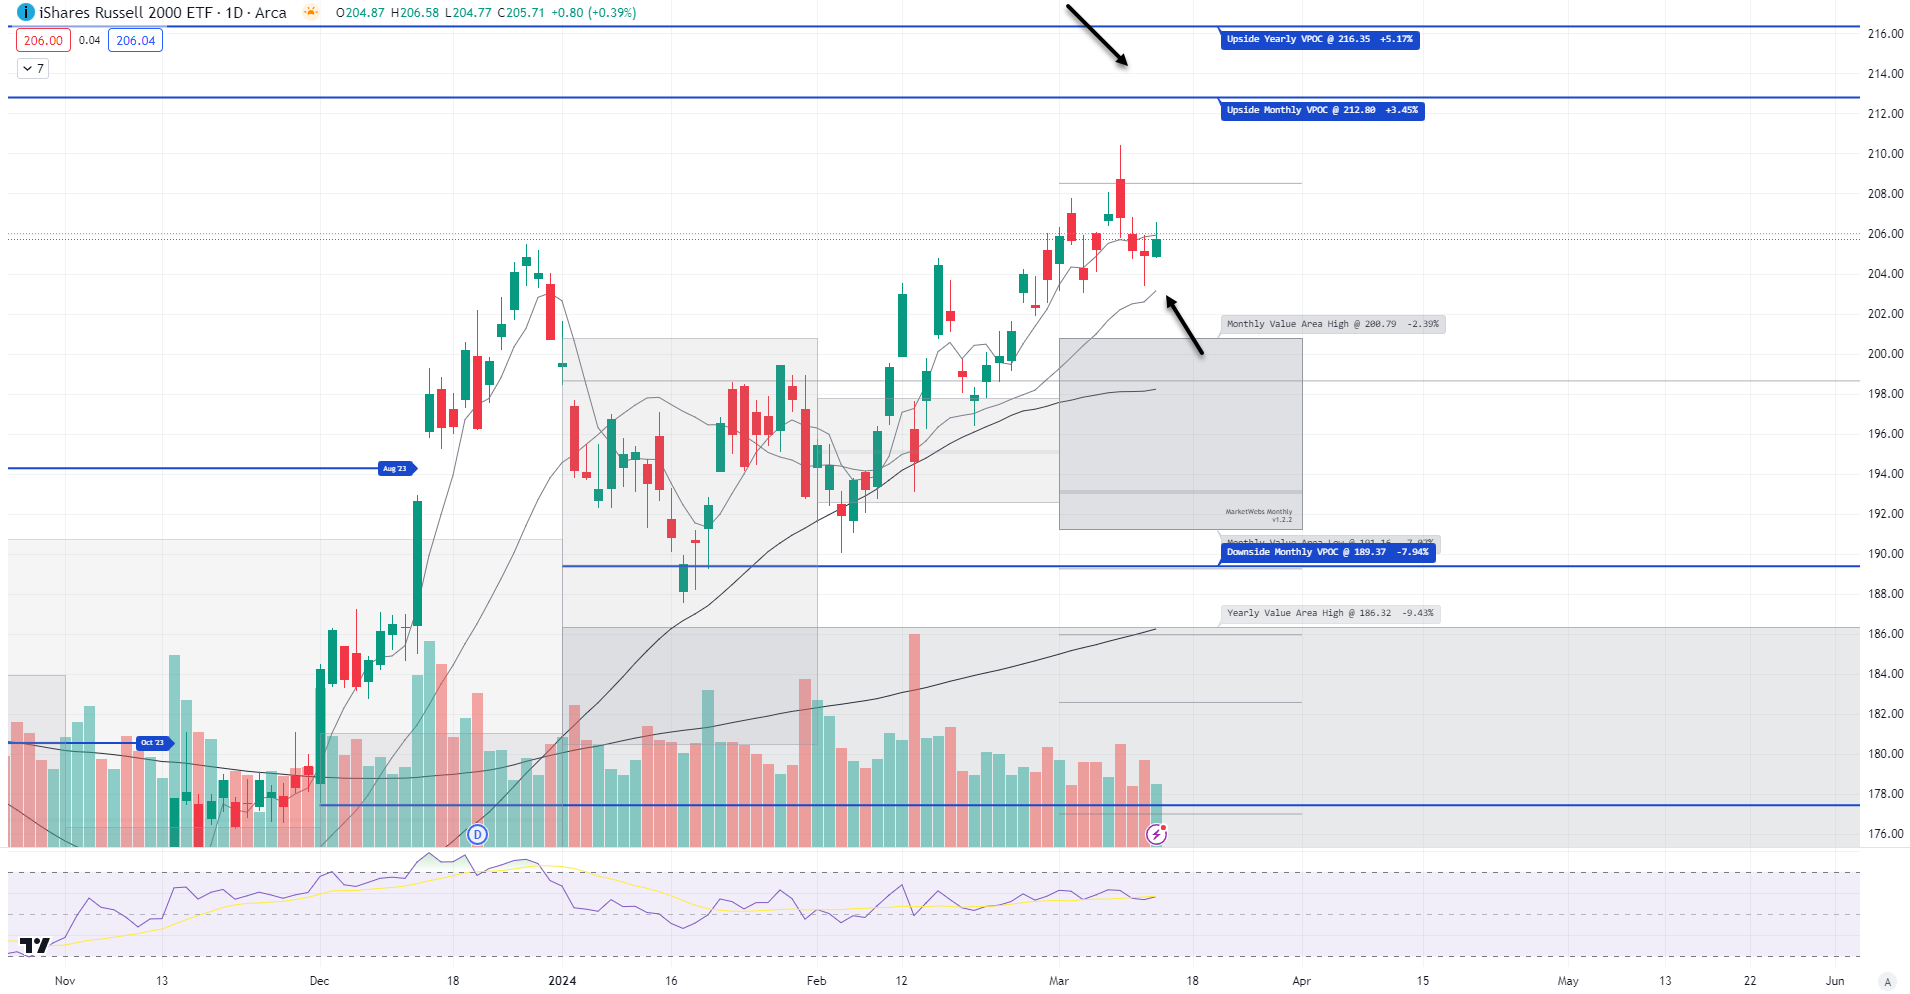
IWM - Russell Small Cap ETF- Price ind. +0.1% and lagging the other indices a touch this morning. Price remains above its 20d MA, but is not doing much else this week so far
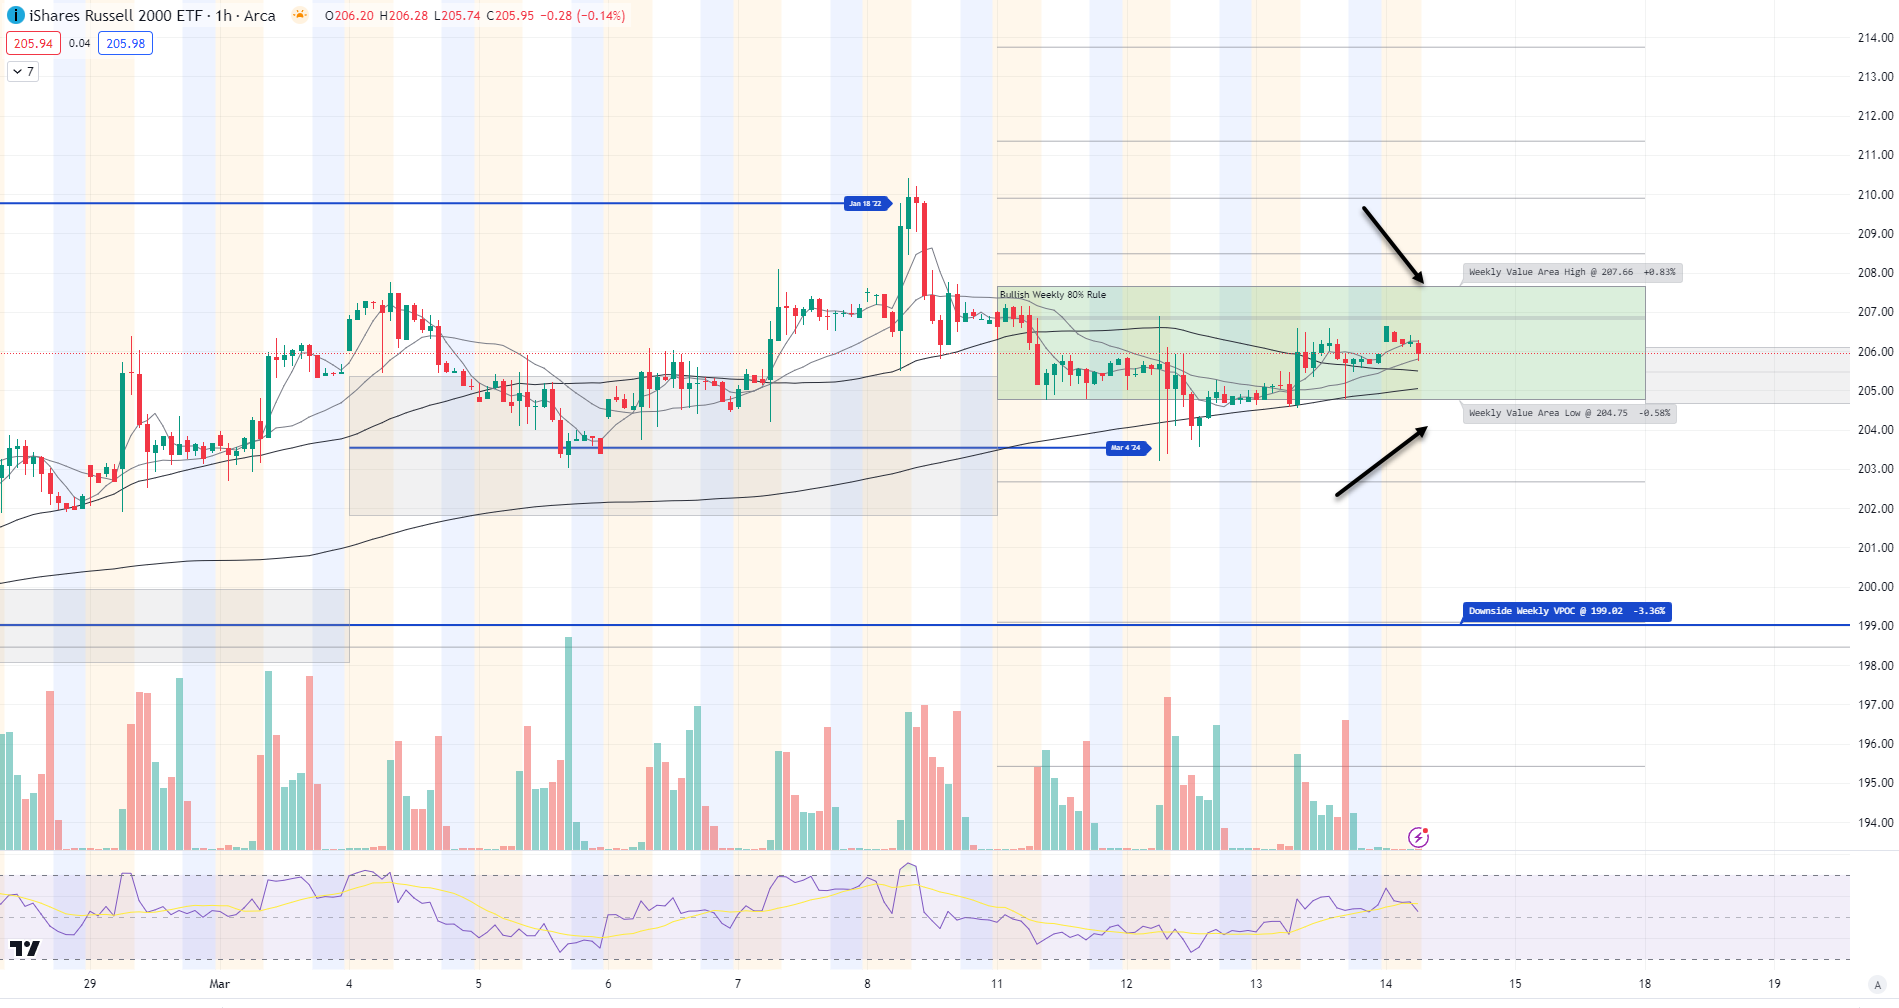
1hr chart: Price also remains inside its Value Area for the week, levels to watch below
Here is today’s TTG Proprietary Stock Screen “Out of the Box” using Volume At Price
names trending above their Value Areas (on 3 multiple timeframes & not super extended)
Keep reading with a 7-day free trial
Subscribe to The Tribeca Trade Group to keep reading this post and get 7 days of free access to the full post archives.