
TTG Index Charts & Out of the Box Stocks 8/28/24 & Chart + Premarket Video
Out of the Box MarketWebs Screen
US Dollar +0.6% / 30yr Bonds +0.1% / Crude -1.5% & Nat Gas -1.0% / Gold -1.0% / Copper -2.1% / BTC -3.1%
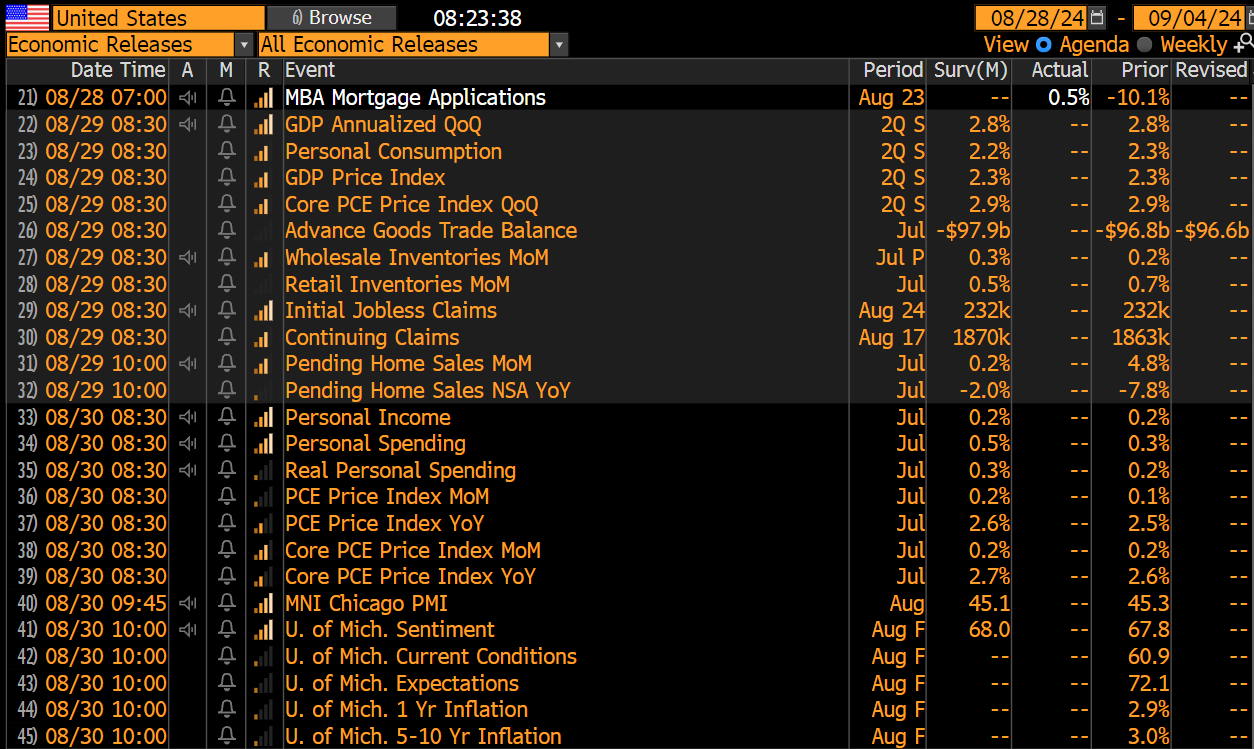
US Upcoming Economics
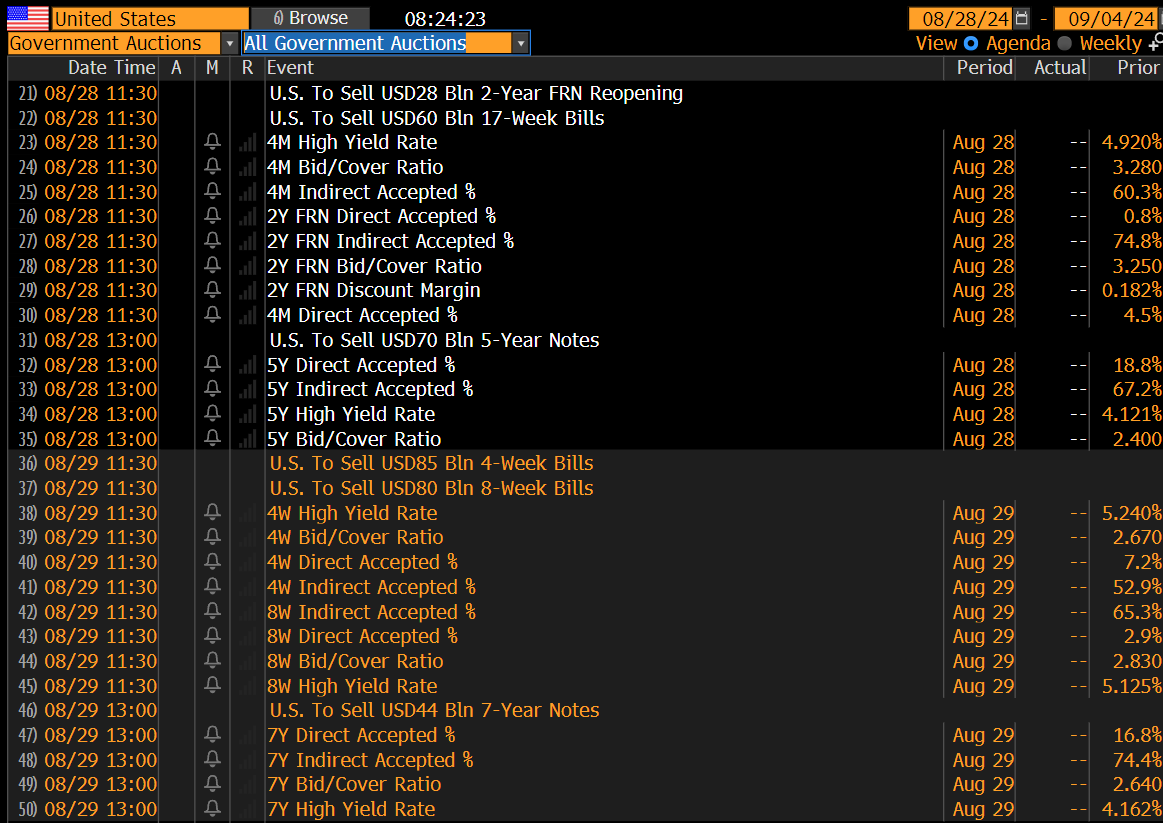
Bond Auctions this Week
Index Updates
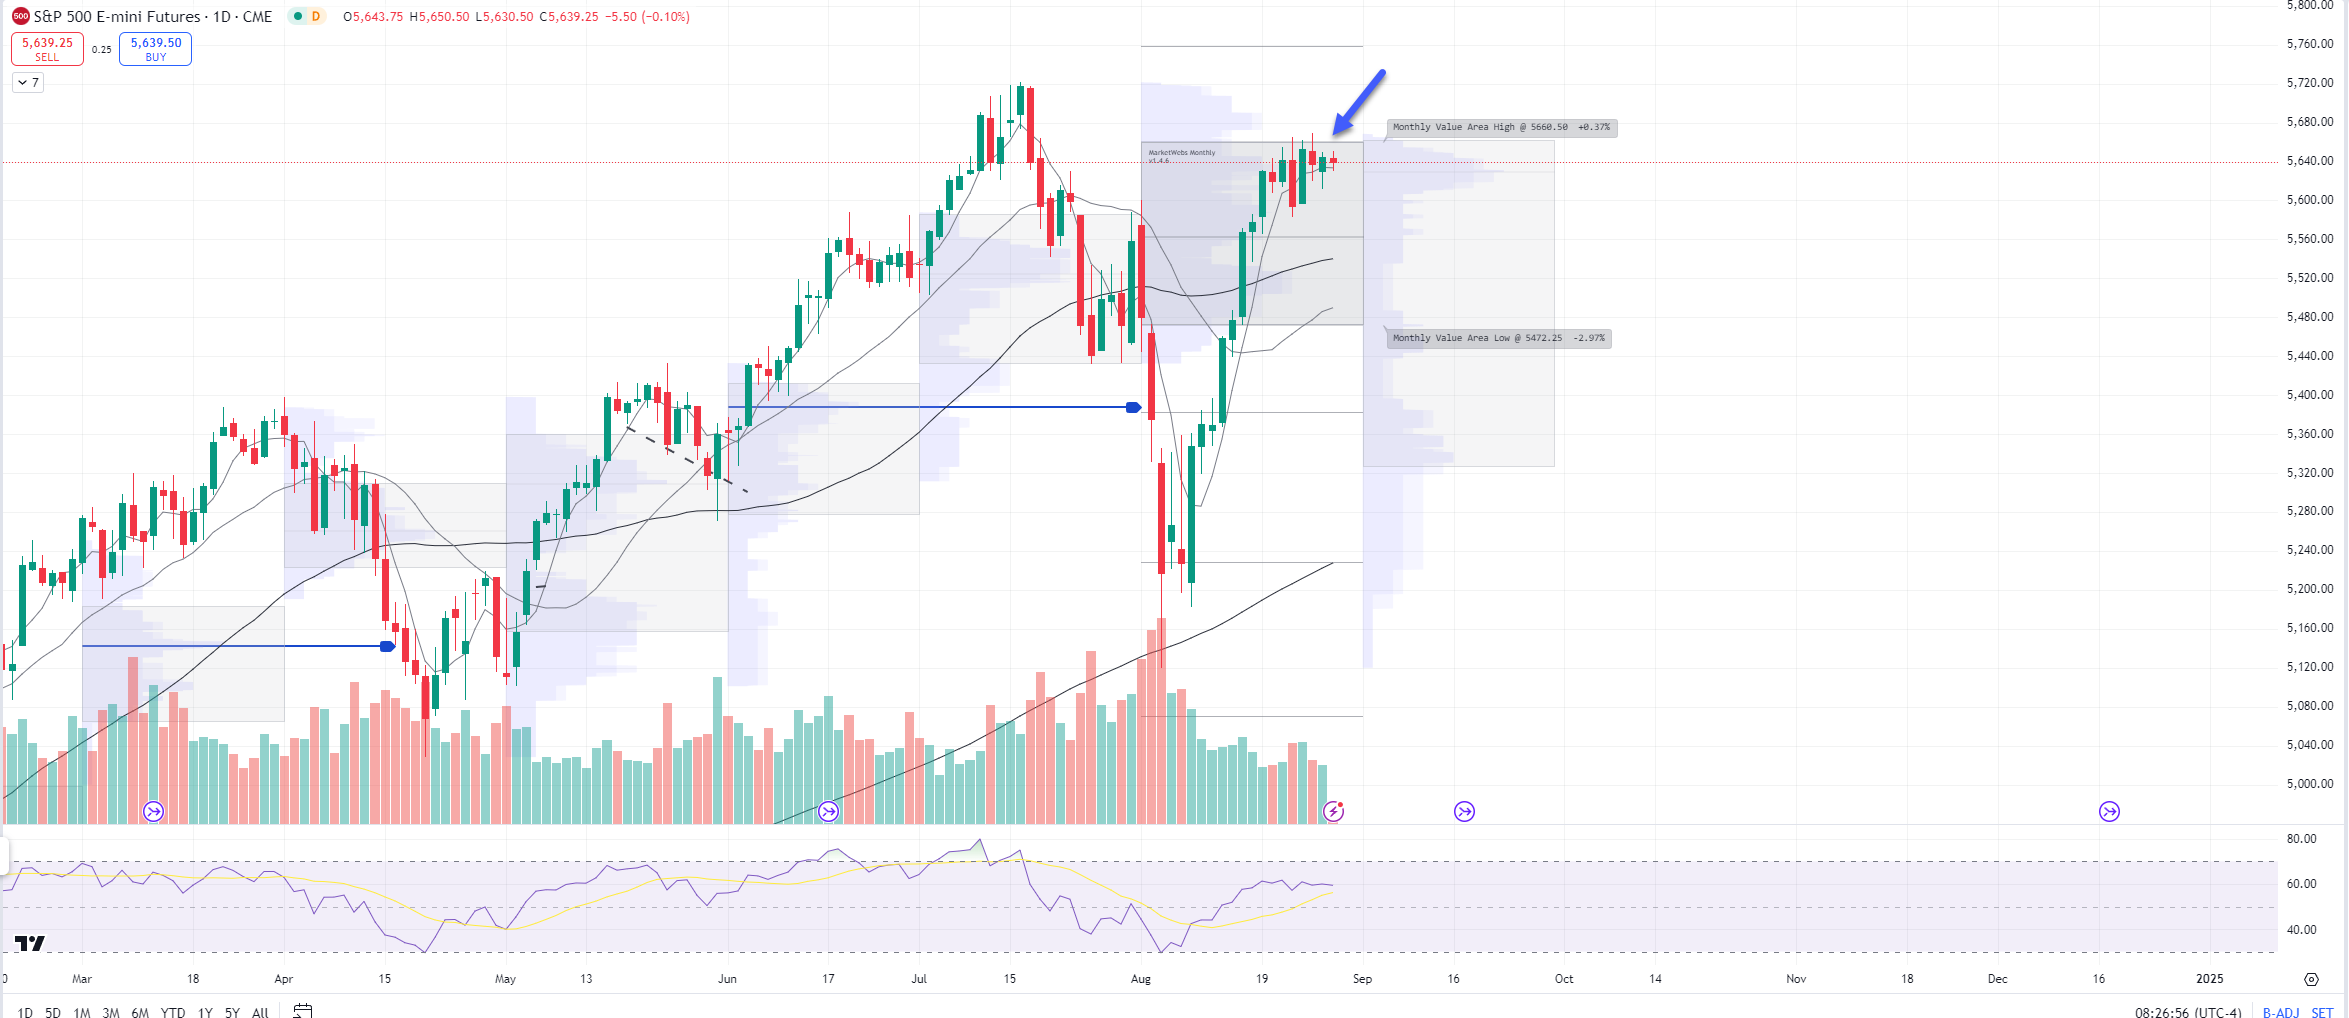
At TTG, I use Volume At Price in my chart analysis and I use the MarketWebs Indicator to provide Value Areas & VPOCs which indicate significant support & resistance levels. Learn More Here about Volume At Price and the MarketWebs.

ES_F - SPX Futures - Daily chart: S&P futures ind. -0.1% and remains stuck inside its August Value Area, the level to watch remains 5660.5 resistance and support I am watching is the 5d MA
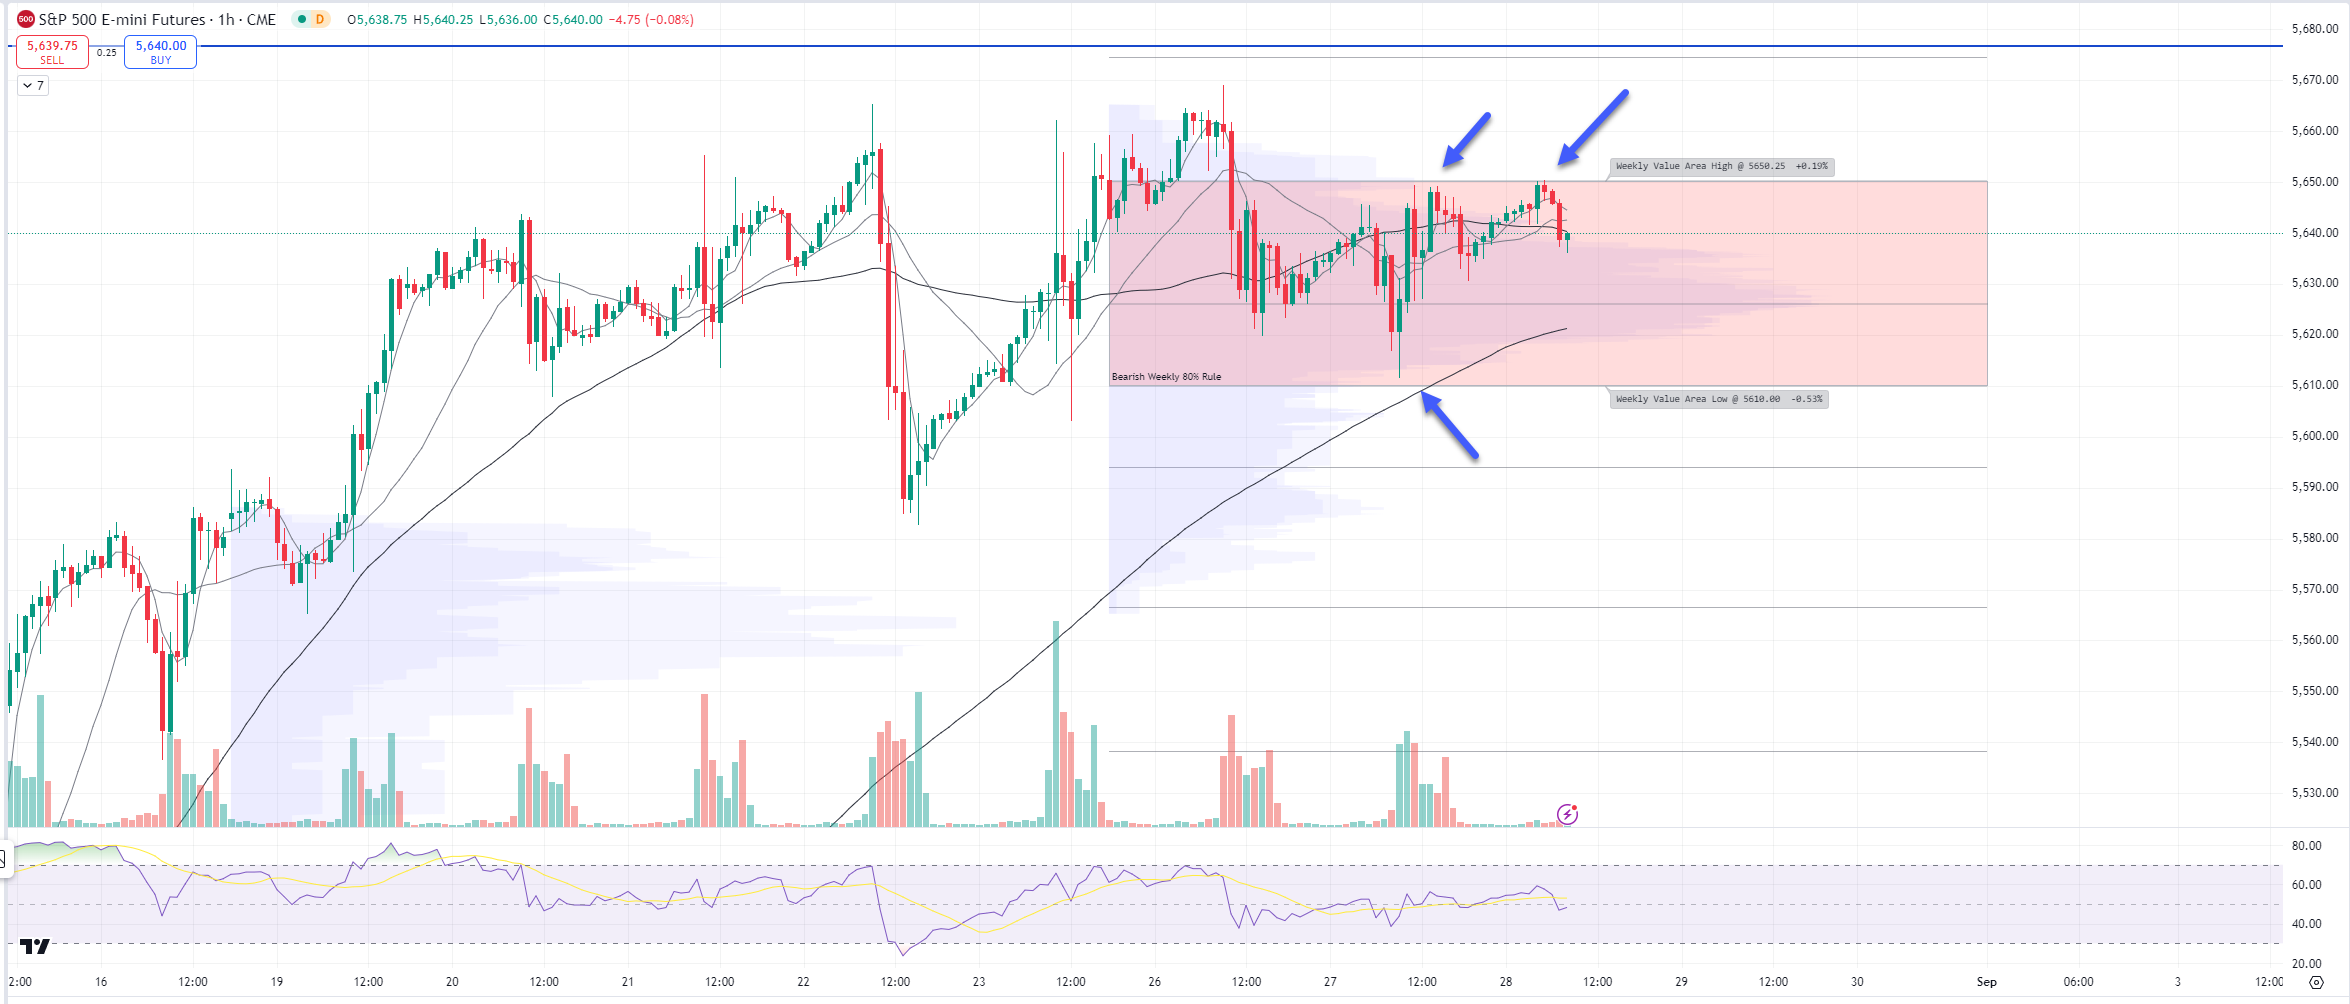
1hr chart: Price is INSIDE its Value Area for the week, support 5610 & resistance 5650.25
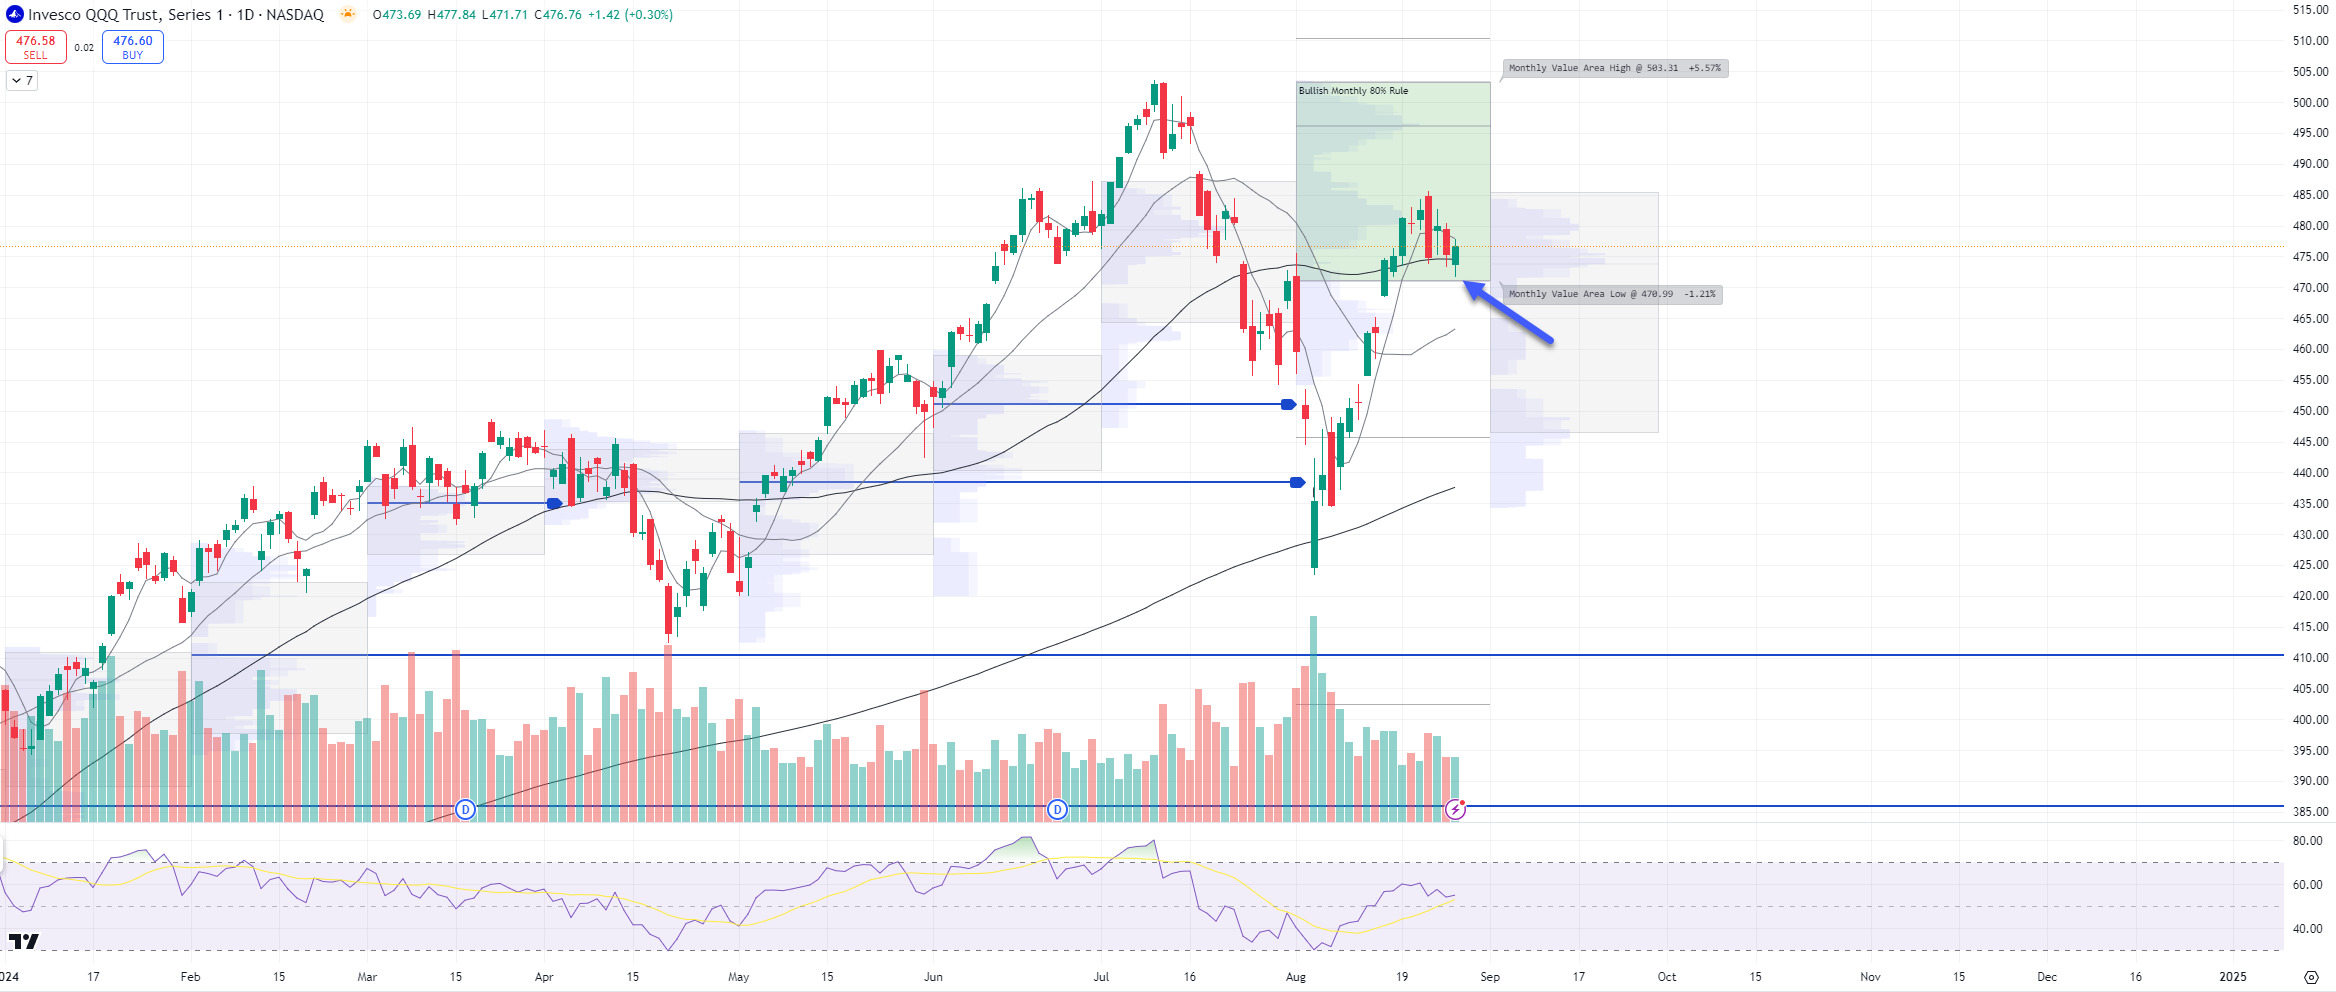
QQQ - NDX 100 ETF- Daily chart: Price ind. -0.1% and price is now at its 50d MA and just inside its Aug Value Area, watch the bottom of the Aug Value Area $471 to see if price holds this support.
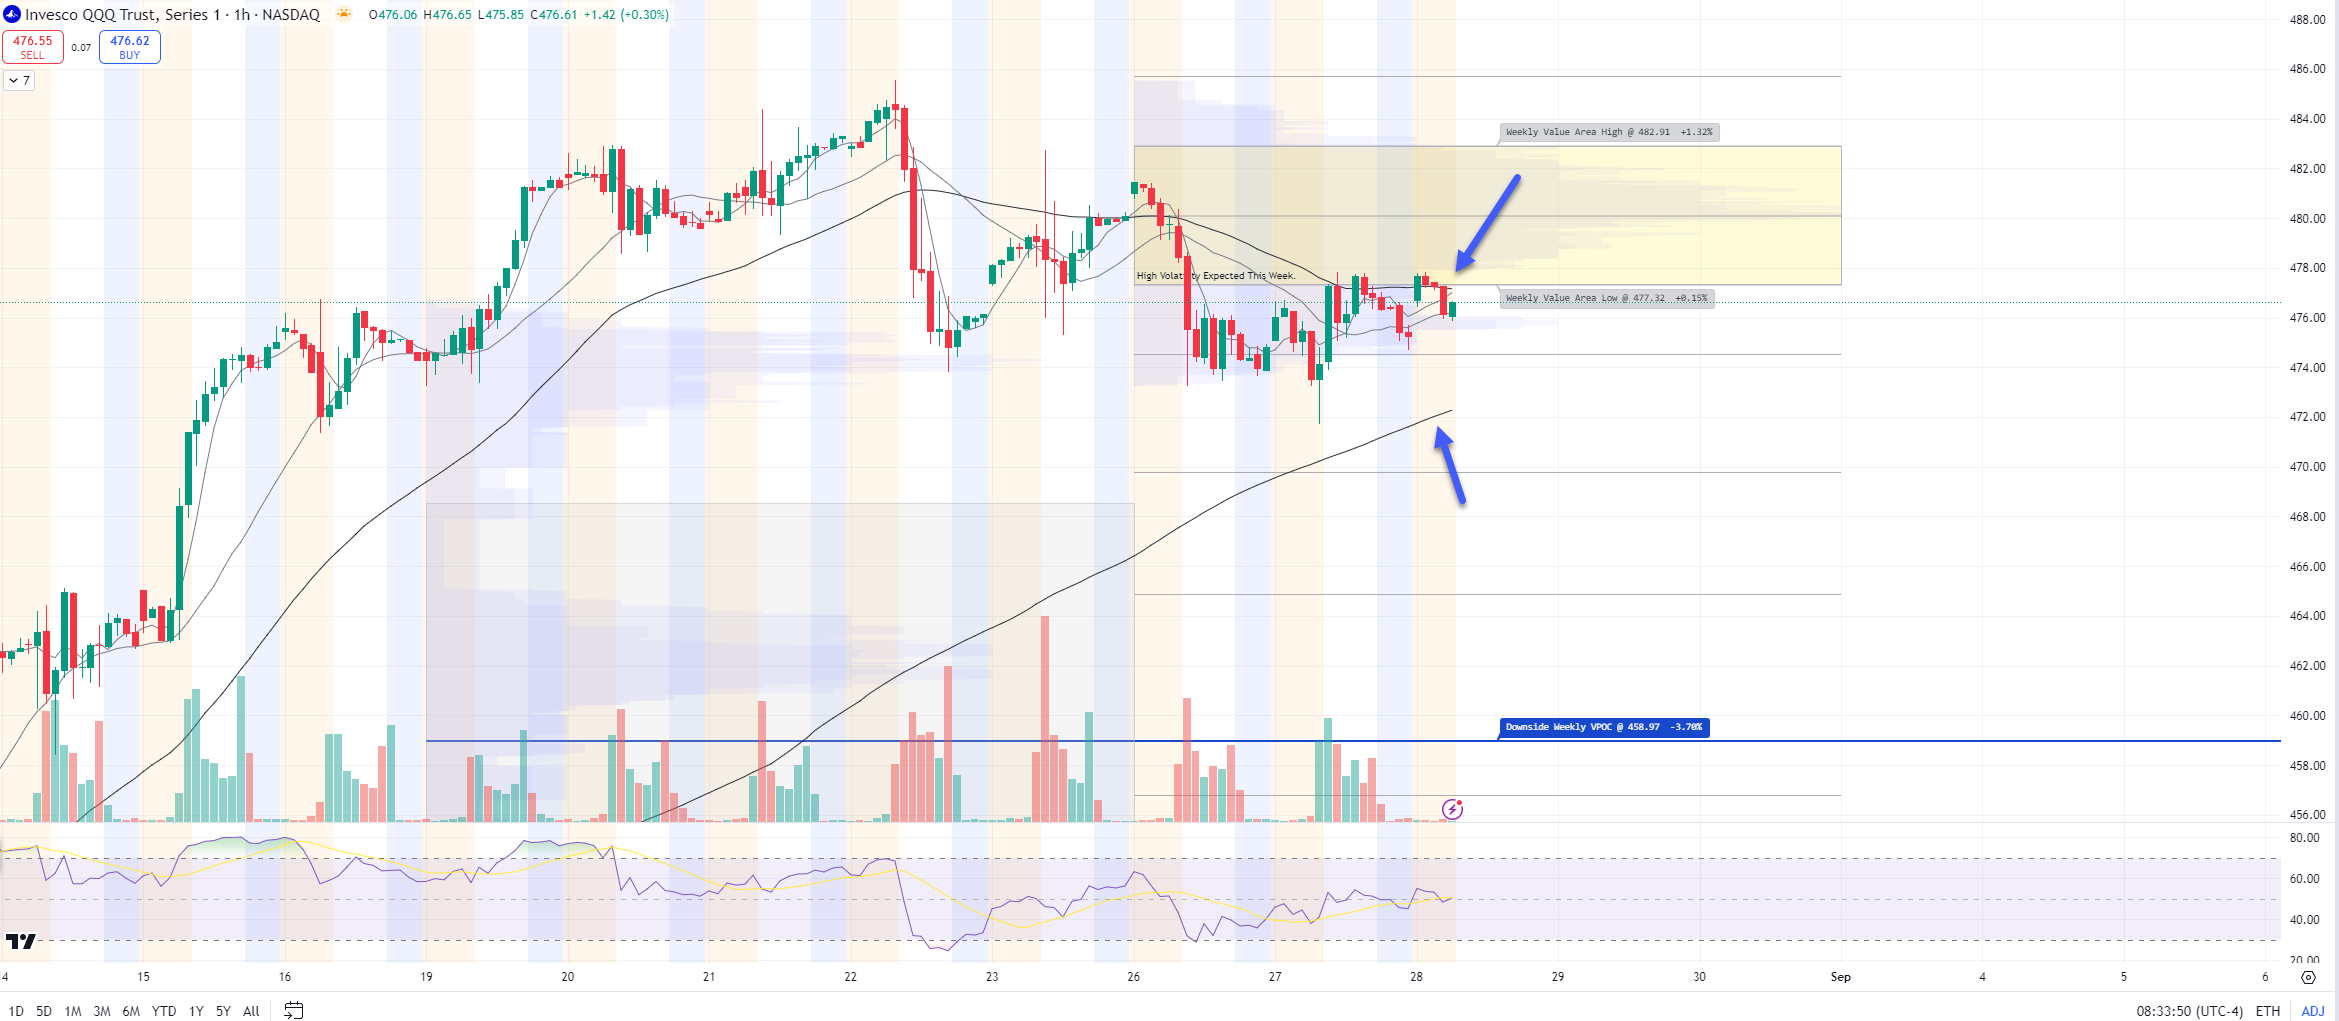
1hr chart: Price is BELOW its Value Area for the week, resistance $477.32
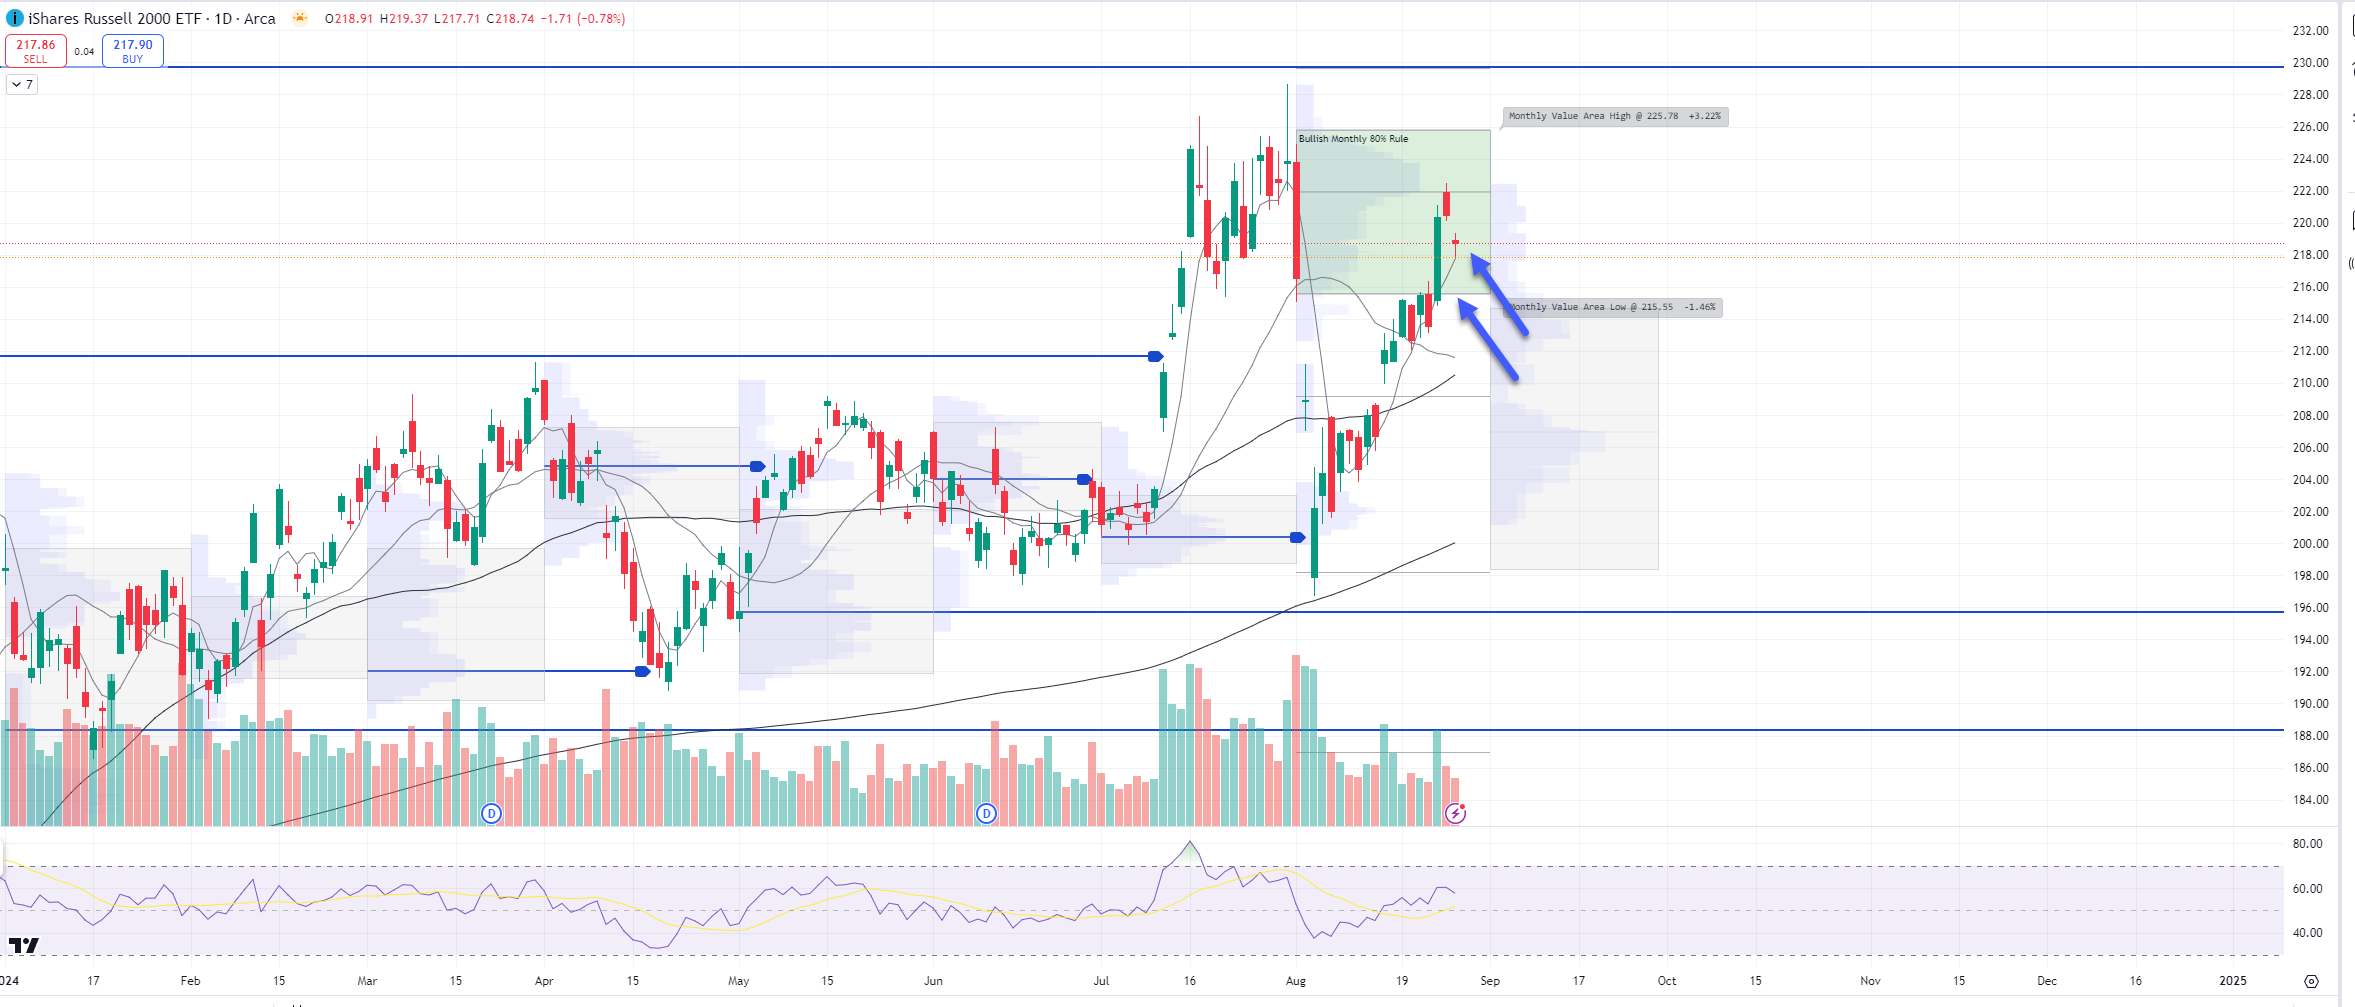
IWM - Russell Small Cap ETF- Daily Chart: Price ind. -0.4% and price has moved down to its 5d MA and that will be interesting to see if price holds its short-term MA for upside momentum to continue, next support $215.55
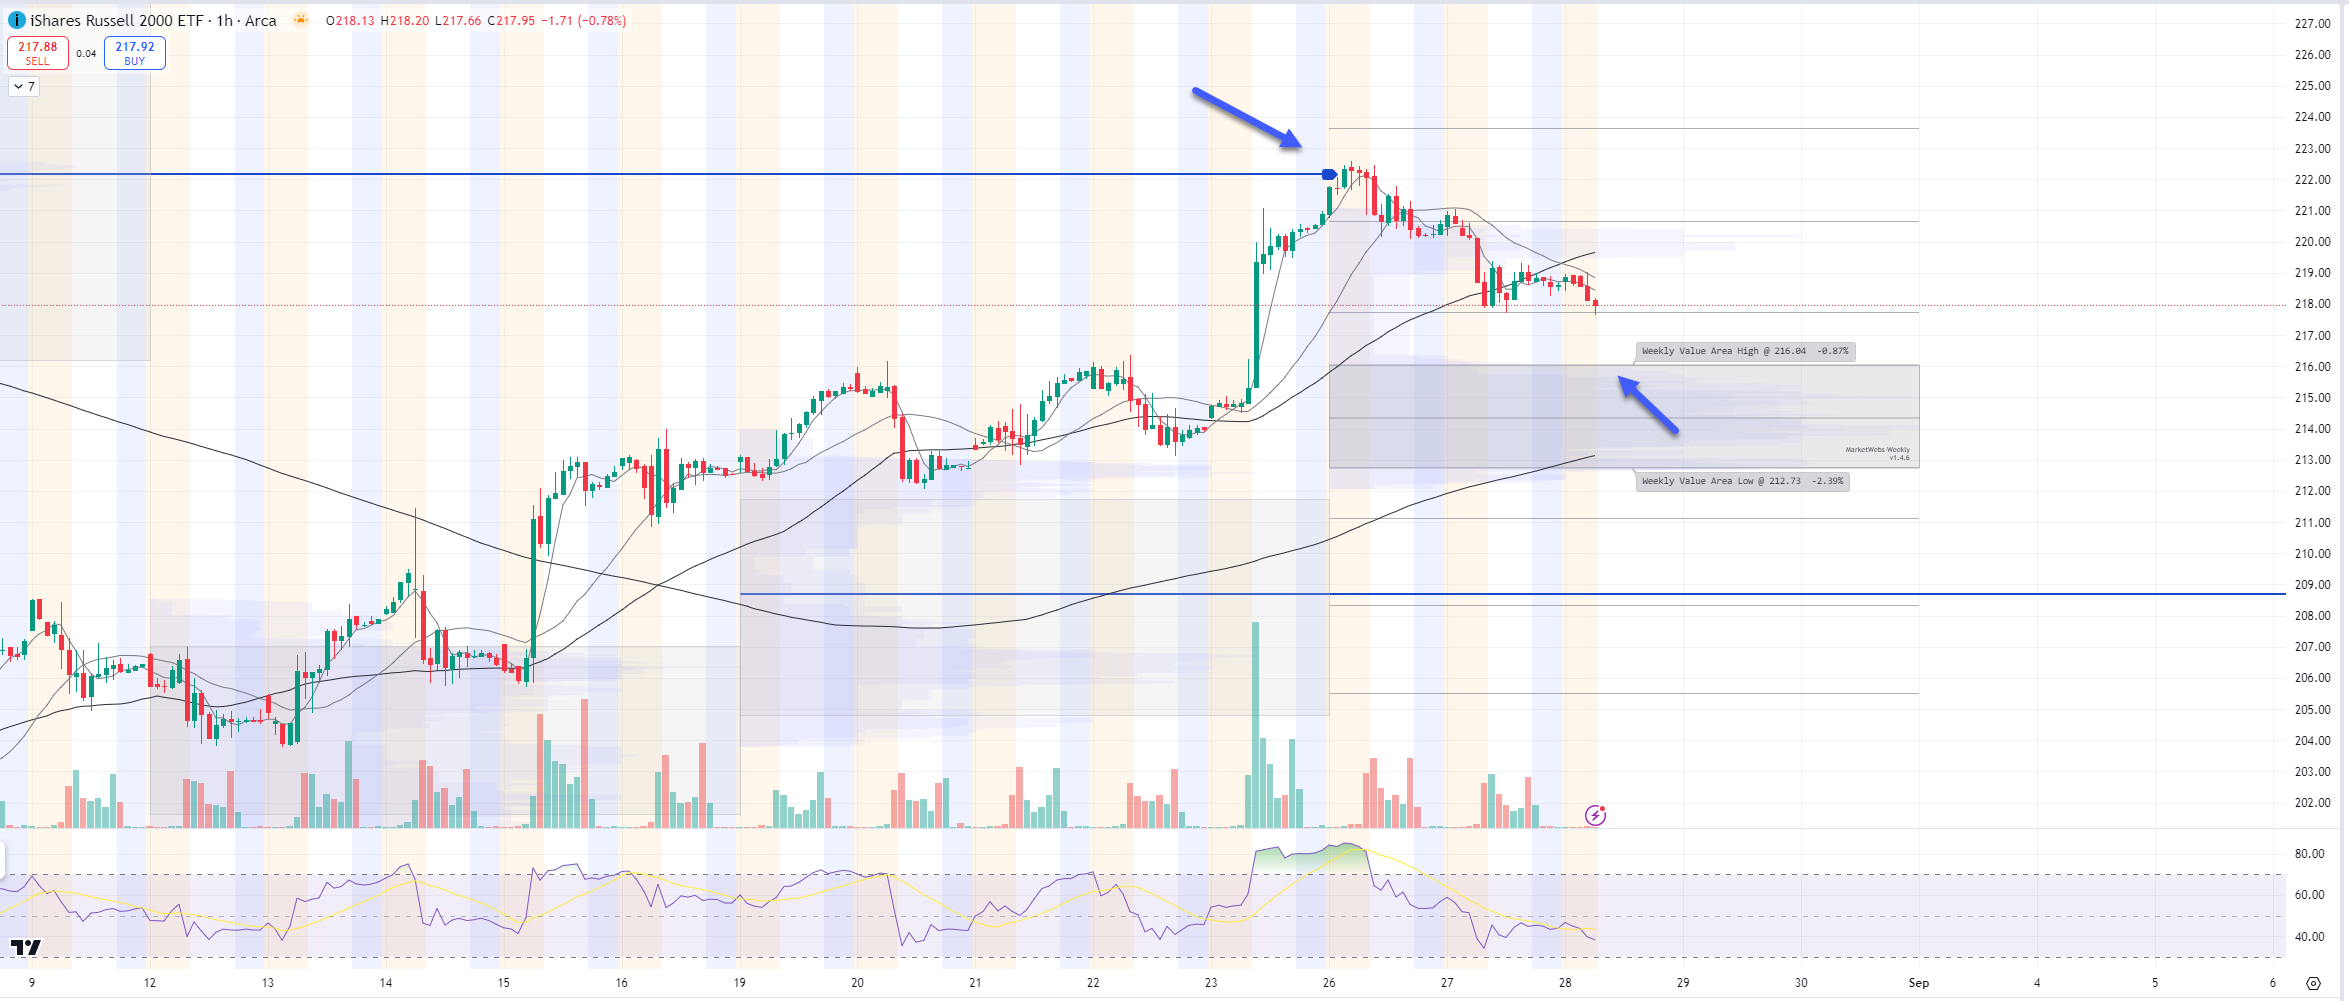
1hr chart: The VPOC (blue line) marked the top for the week and price is moving towards its top of Value Area, watch $216.04 support
Here is today’s TTG Proprietary Stock Screen “Out of the Box” using Volume At Price
names trending above their Value Areas (on 3 multiple timeframes & not super extended)
Keep reading with a 7-day free trial
Subscribe to The Tribeca Trade Group to keep reading this post and get 7 days of free access to the full post archives.