

TTG Index Charts & Out of the Box Stock Screen 4/16/24
TTG Index Charts & Out of the Box Stock Screen 4/16/24
Out of the Box MarketWebs Screen
US Dollar -0.1% / 30yr Bonds -0.2% / Crude -0.5% & Nat Gas -0.2% / Gold +0.3% / Copper -1.7% / BTC -0.5%
US Upcoming Economics

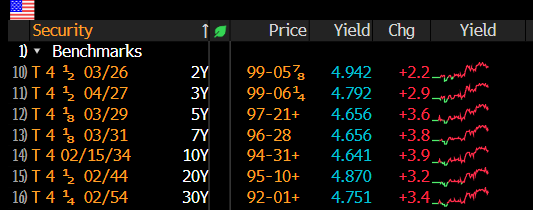
US Bond Yields
Index Updates
At TTG, I use Volume At Price in my chart analysis and I use the MarketWebs Indicator to provide Value Areas & VPOCs which indicate significant support & resistance levels. Learn More Here about Volume At Price and the MarketWebs.
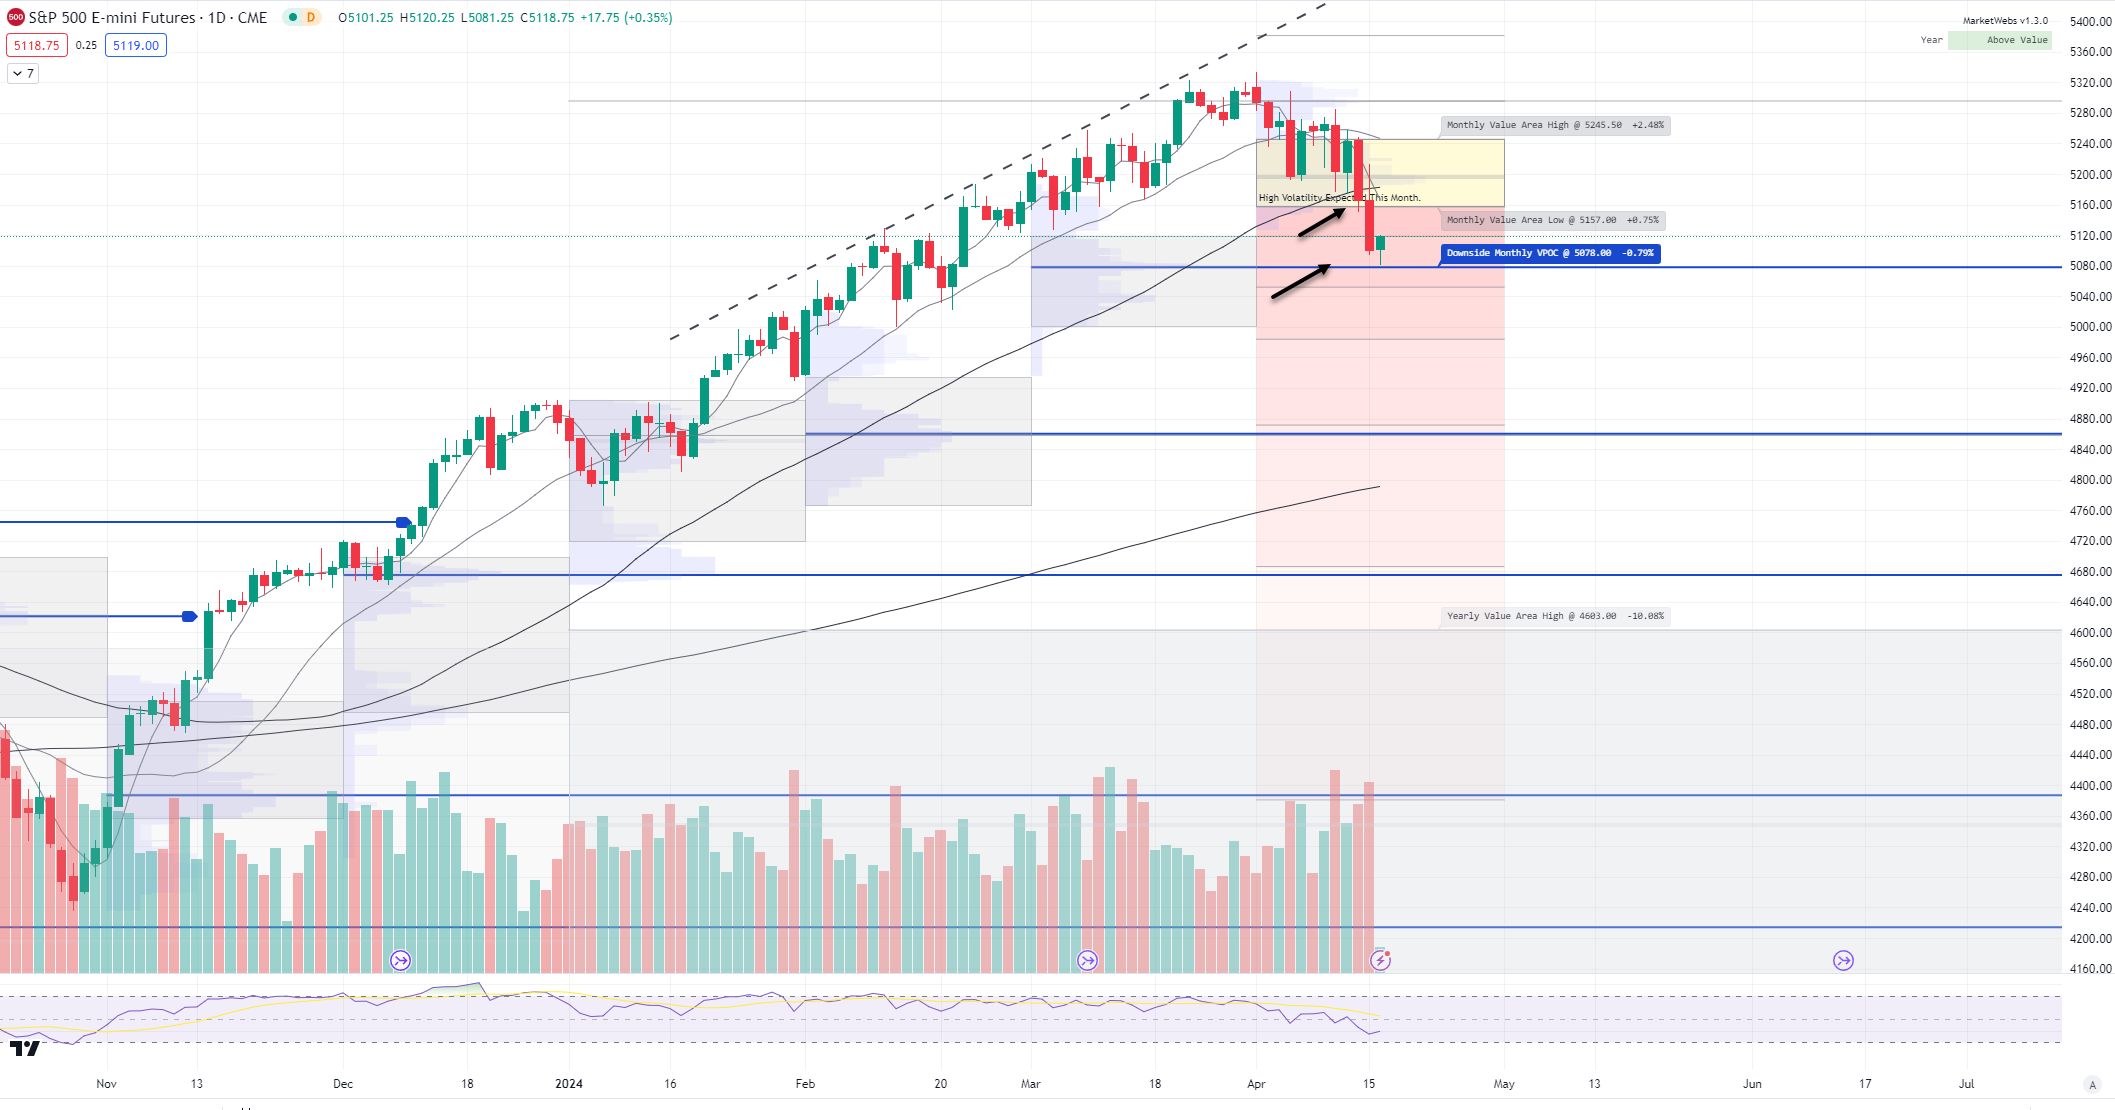
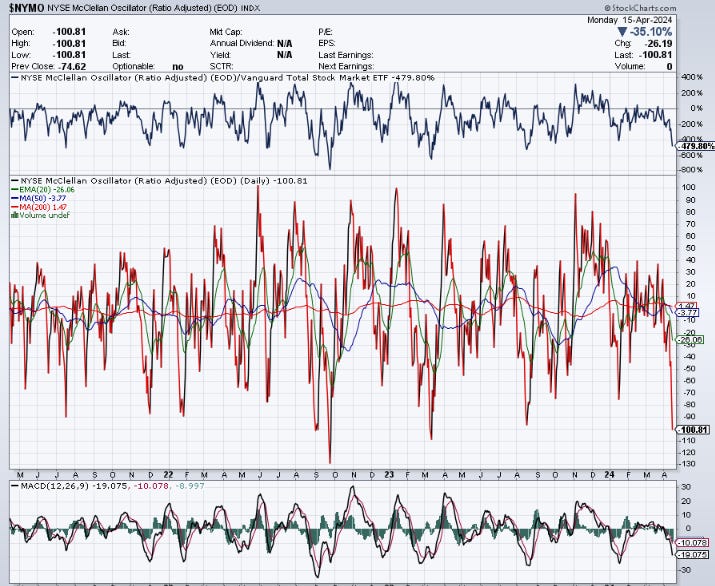
ES_F - SPX Futures - Daily chart: Price stabilizing a bit this morning after breaking its 50d MA (Moving Average) and April Value Area. Next level down to watch is 5078 VPOC for a possible reversal / demand area. Also, note the McClellan Oscillator (NYMO) is at -100 (see below) which is fairly oversold indicating a short term bounce may be coming this week. Reminder, the medium term is now trending down so a bounce imo should be sold into.
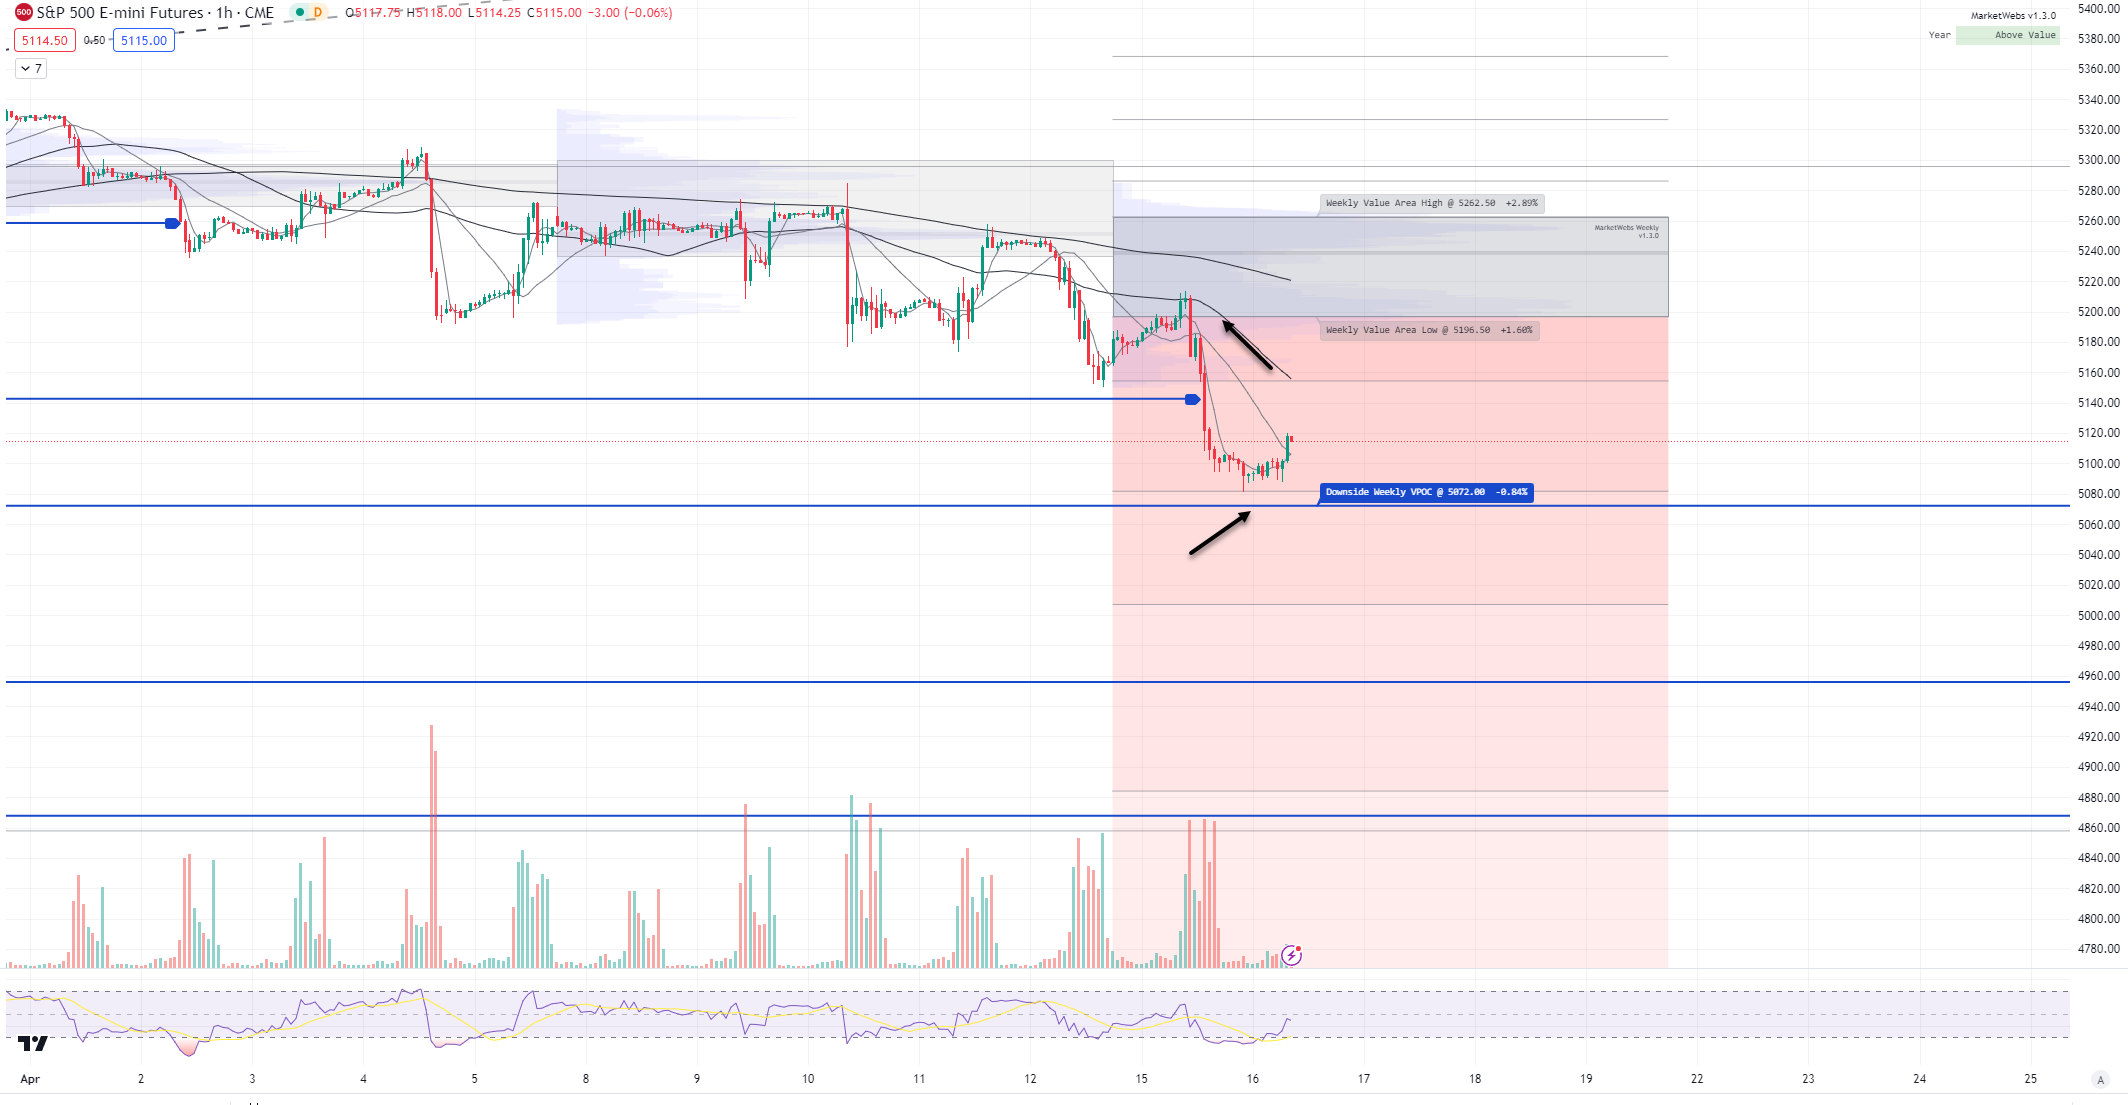
1hr chart: Yesterday. price was rejected at the bottom of this week's Value Area & spilled lower. Next downside level to watch here is 5072 VPOC (blue line)
QQQ - NDX 100 ETF - Daily chart: QQQ ~ flat this morning after breaking below its 50d MA and April Value Area. This is a significant break in trend.
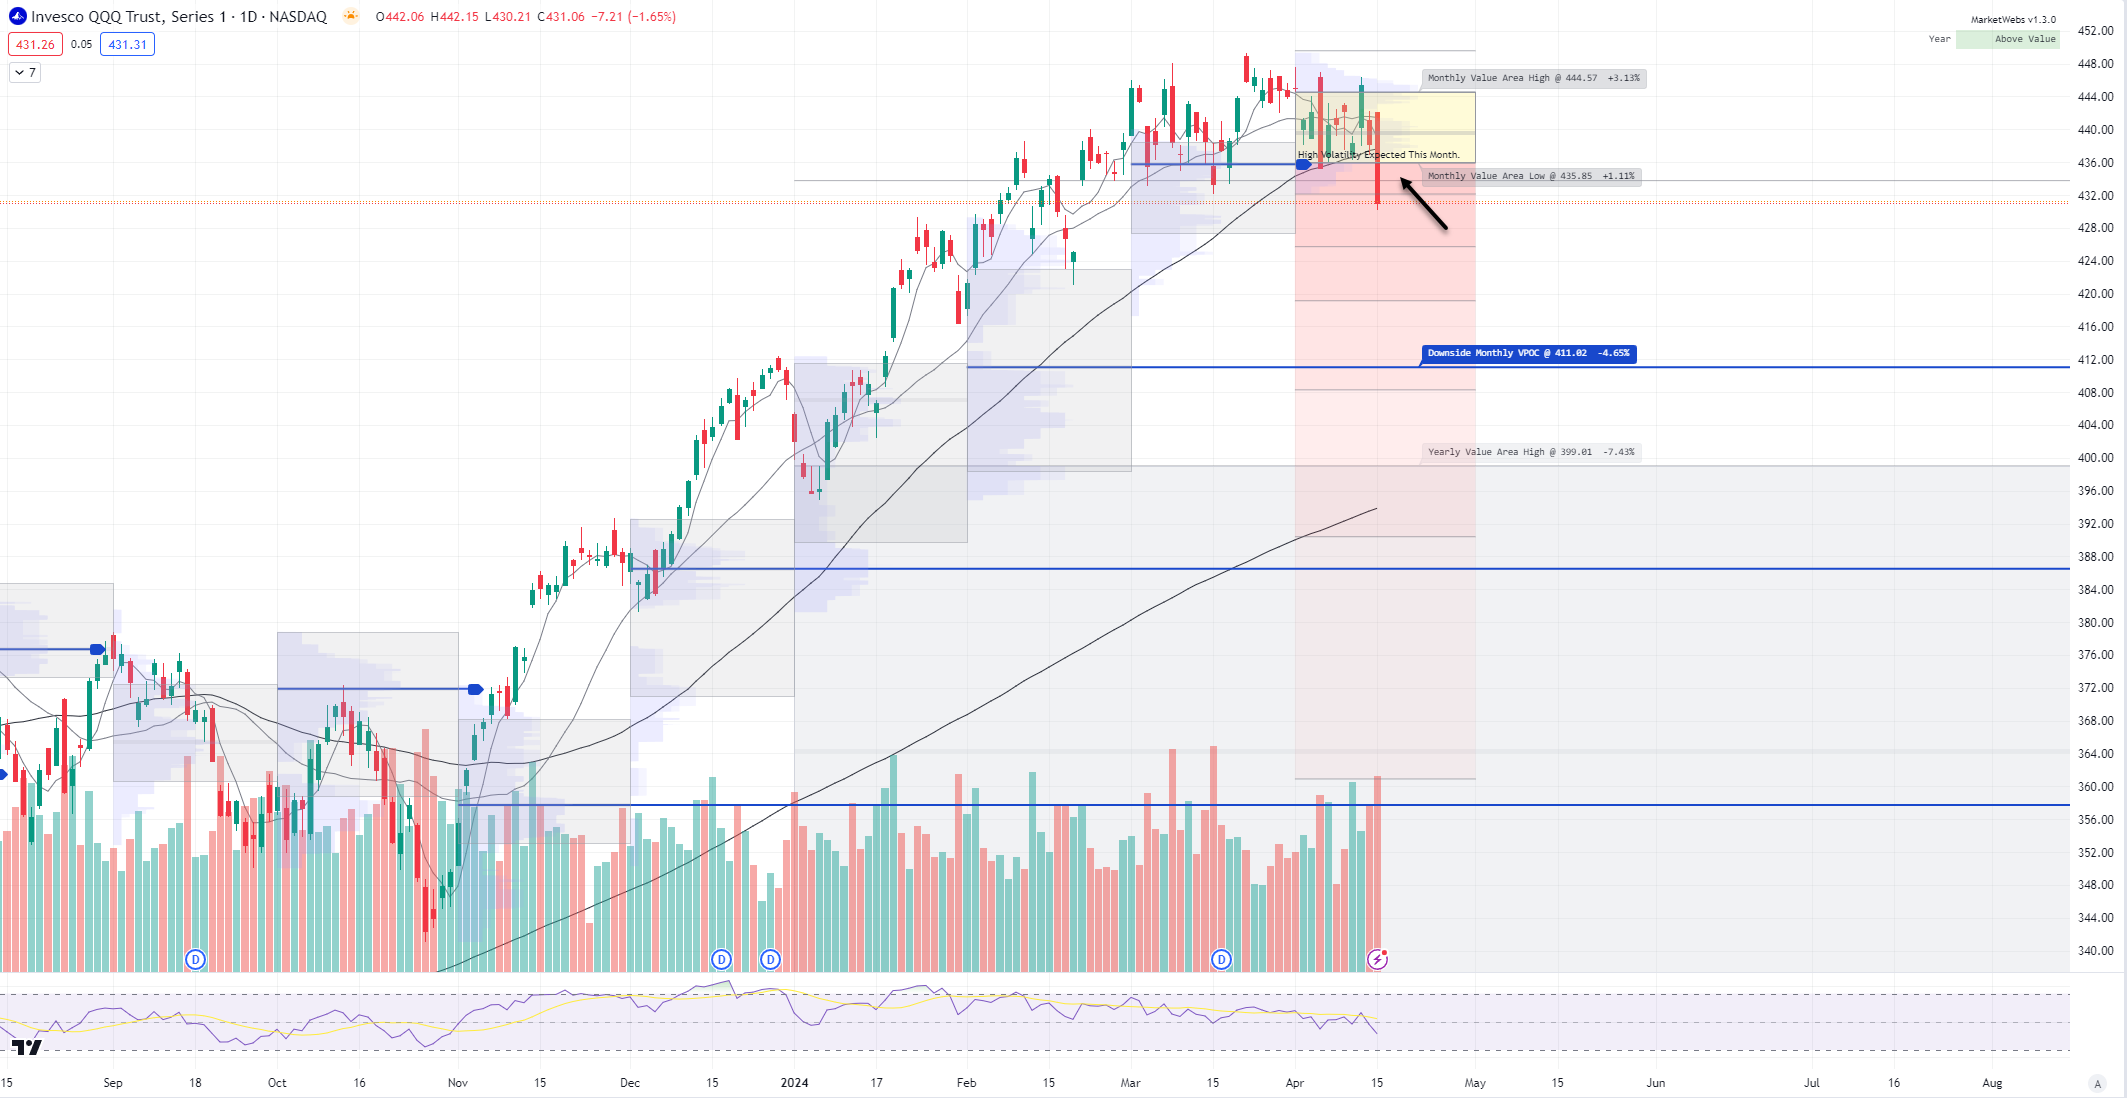
1hr chart: Price below below its Value Area for week, resistance $437.45

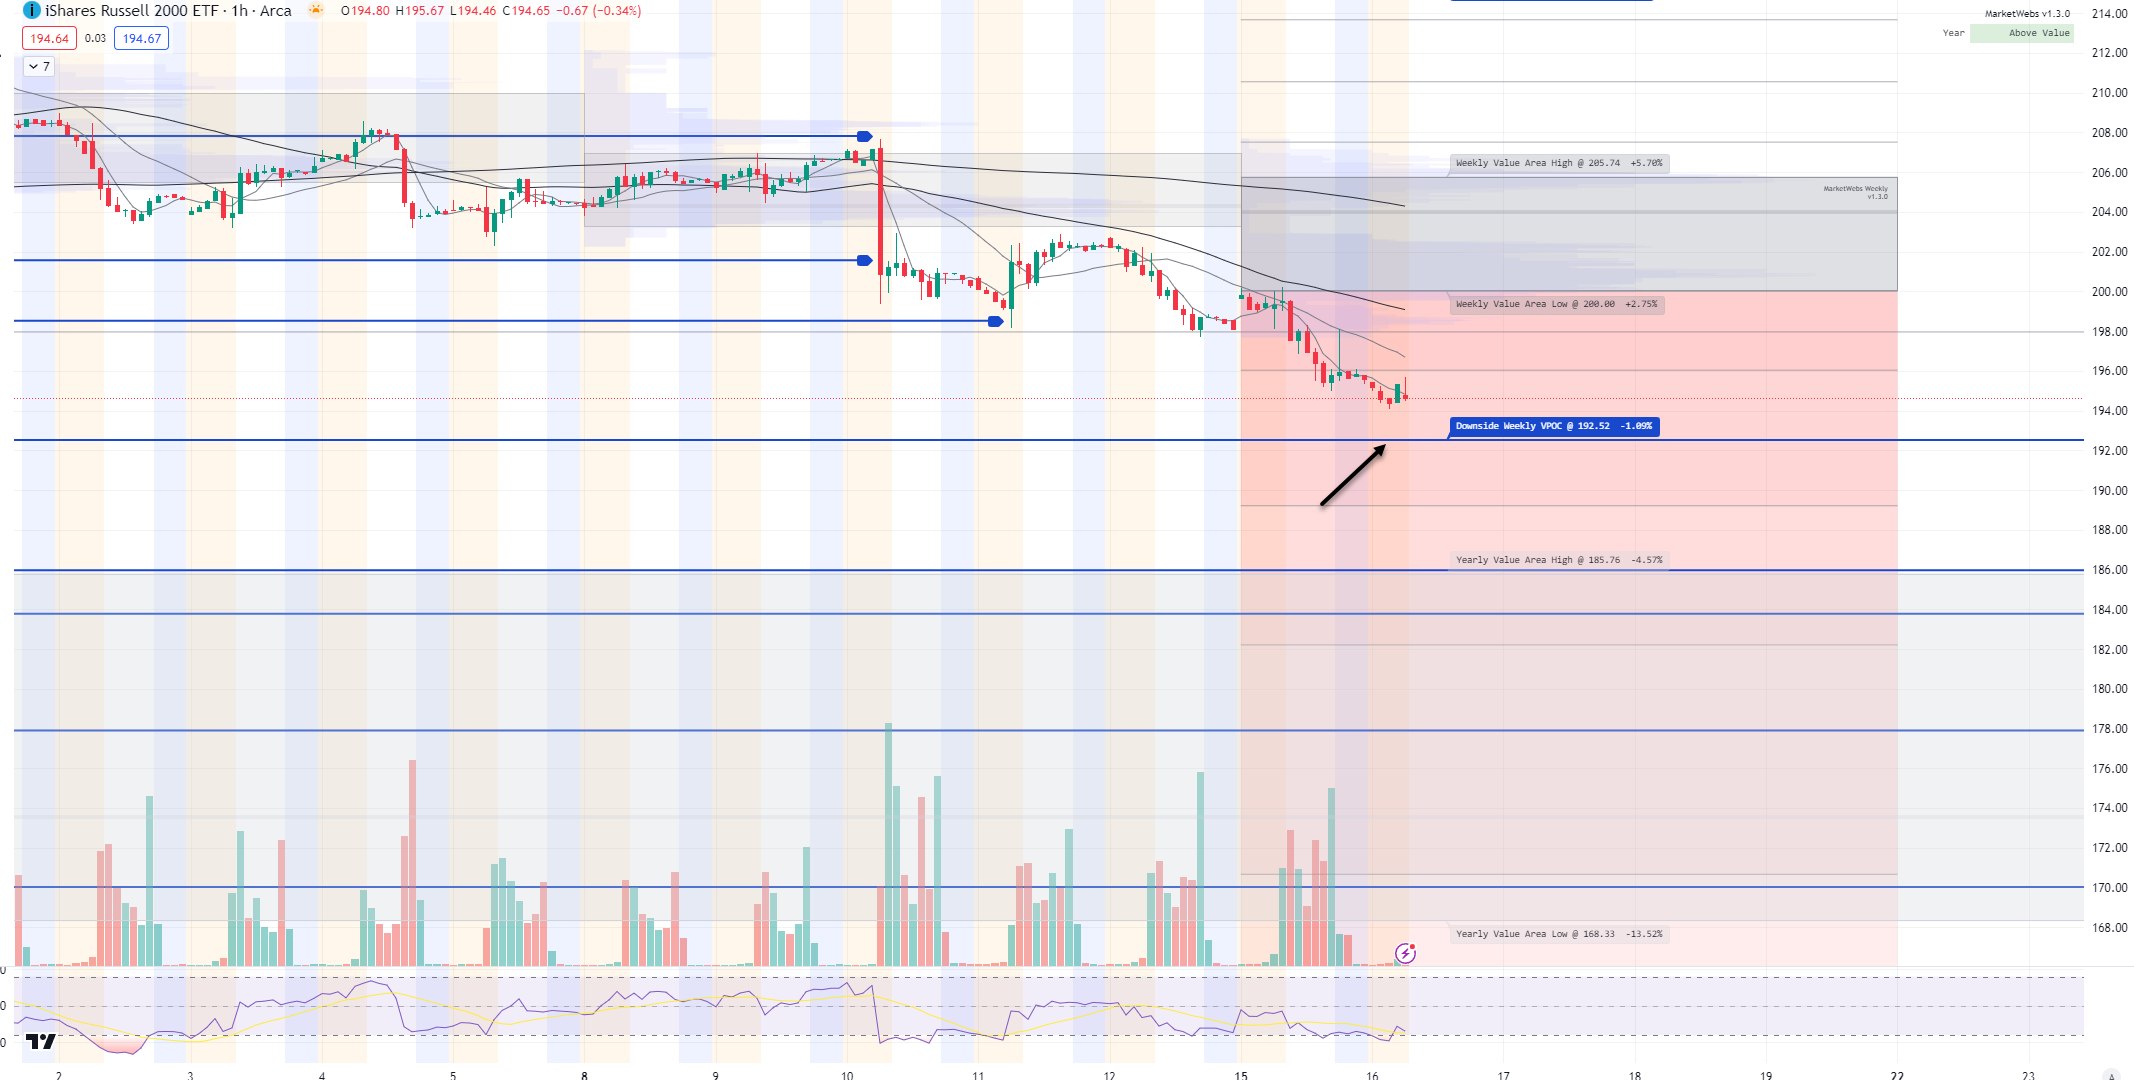
IWM - Russell Small Cap ETF- Price underperforming this morning, ind. -0.5% and next support level to watch is $192.59 VPOC (blue line) and resistance up at $202.05
1hr chart: Price is trending lower and next support to watch is $192.52 VPOC (blue line)
Here is today’s TTG Proprietary Stock Screen “Out of the Box” using Volume At Price
names trending above their Value Areas (on 3 multiple timeframes & not super extended)
Keep reading with a 7-day free trial
Subscribe to The Tribeca Trade Group to keep reading this post and get 7 days of free access to the full post archives.