

TTG Index Charts & Out of the Box Stock Screen 2/26/24 $ACN
TTG Index Charts & Out of the Box Stock Screen 2/26/24 $ACN
Out of the Box MarketWebs Screen
US Dollar -0.2% / 30yr Bonds +0.2% / Crude -0.4% & Nat Gas +6% / Gold -0.3% / Copper -1.0% / BTC +0.3%
US Upcoming Economics

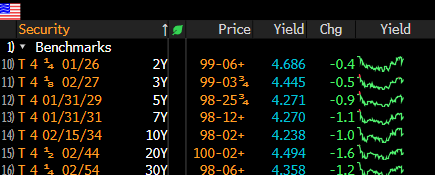
US Bond Yields
Index Updates
At TTG, I use Volume At Price in my chart analysis and I use the MarketWebs Indicator to provide Value Areas & VPOCs which indicate significant support & resistance levels. Learn More Here about Volume At Price and the MarketWebs.
ES_F - SPX Futures - Price ind. -0.1% as we head into the last trading week of Feb. Price remains above all short term MAs (Moving Averages)
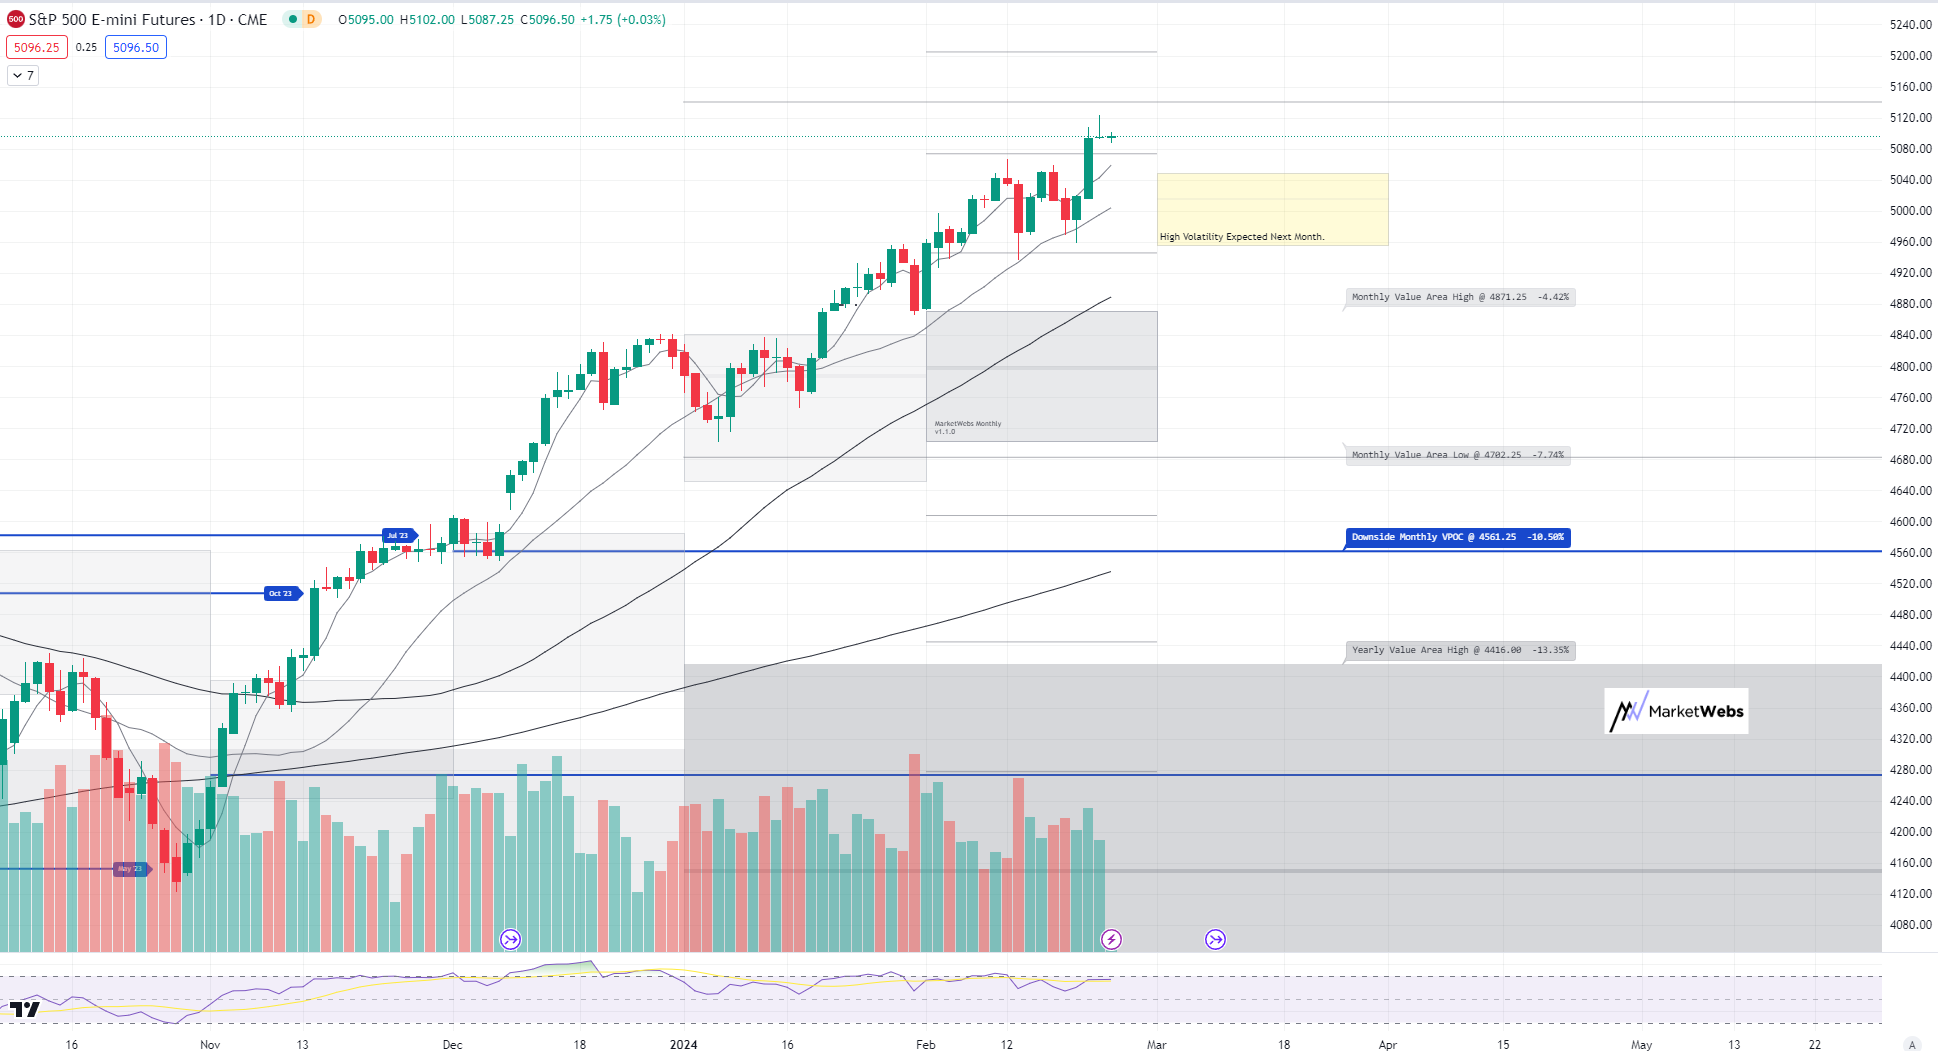
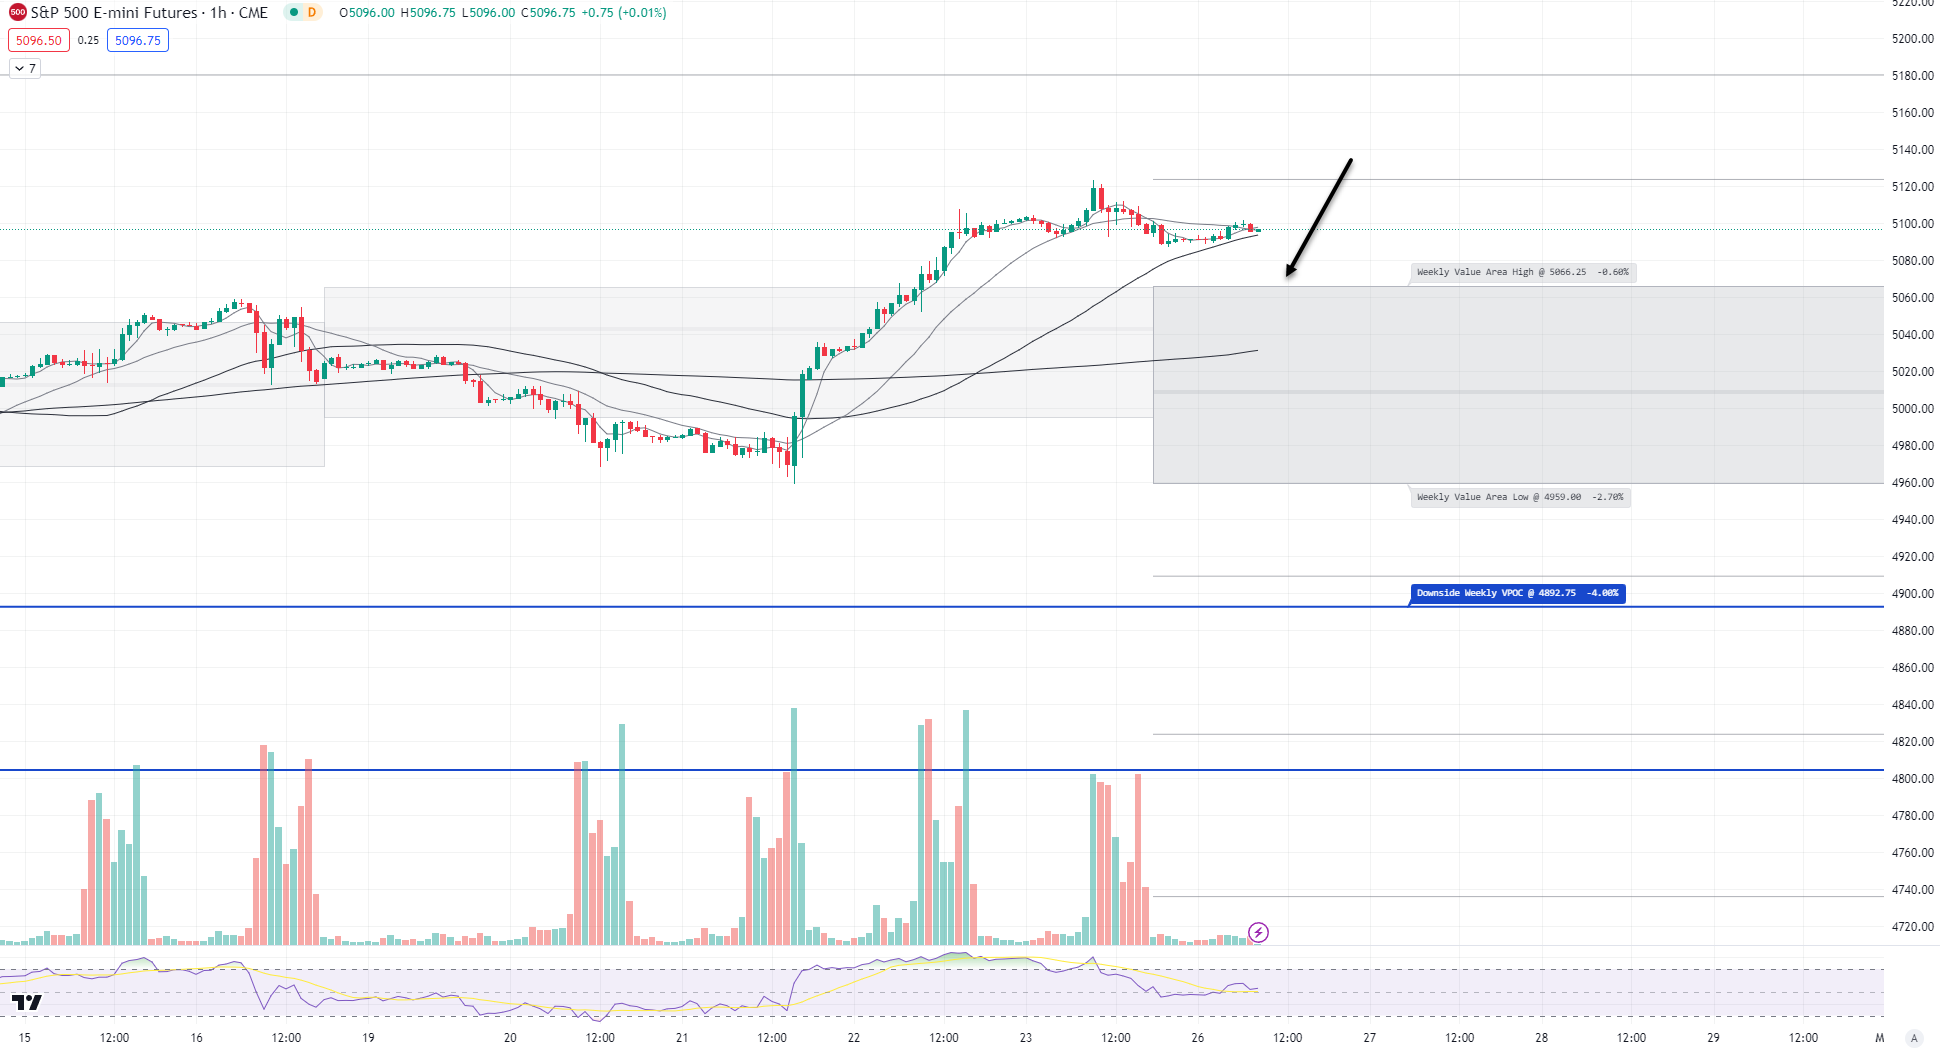
1hr chart: Price starts the week above its new Value Area for the week, support to watch here is 5066.25
QQQ - NDX 100 ETF - Daily chart: Price also quiet to start the new week, ind. flat. Price is above its Value Area for the month and above its short term MAs (5 & 20d)
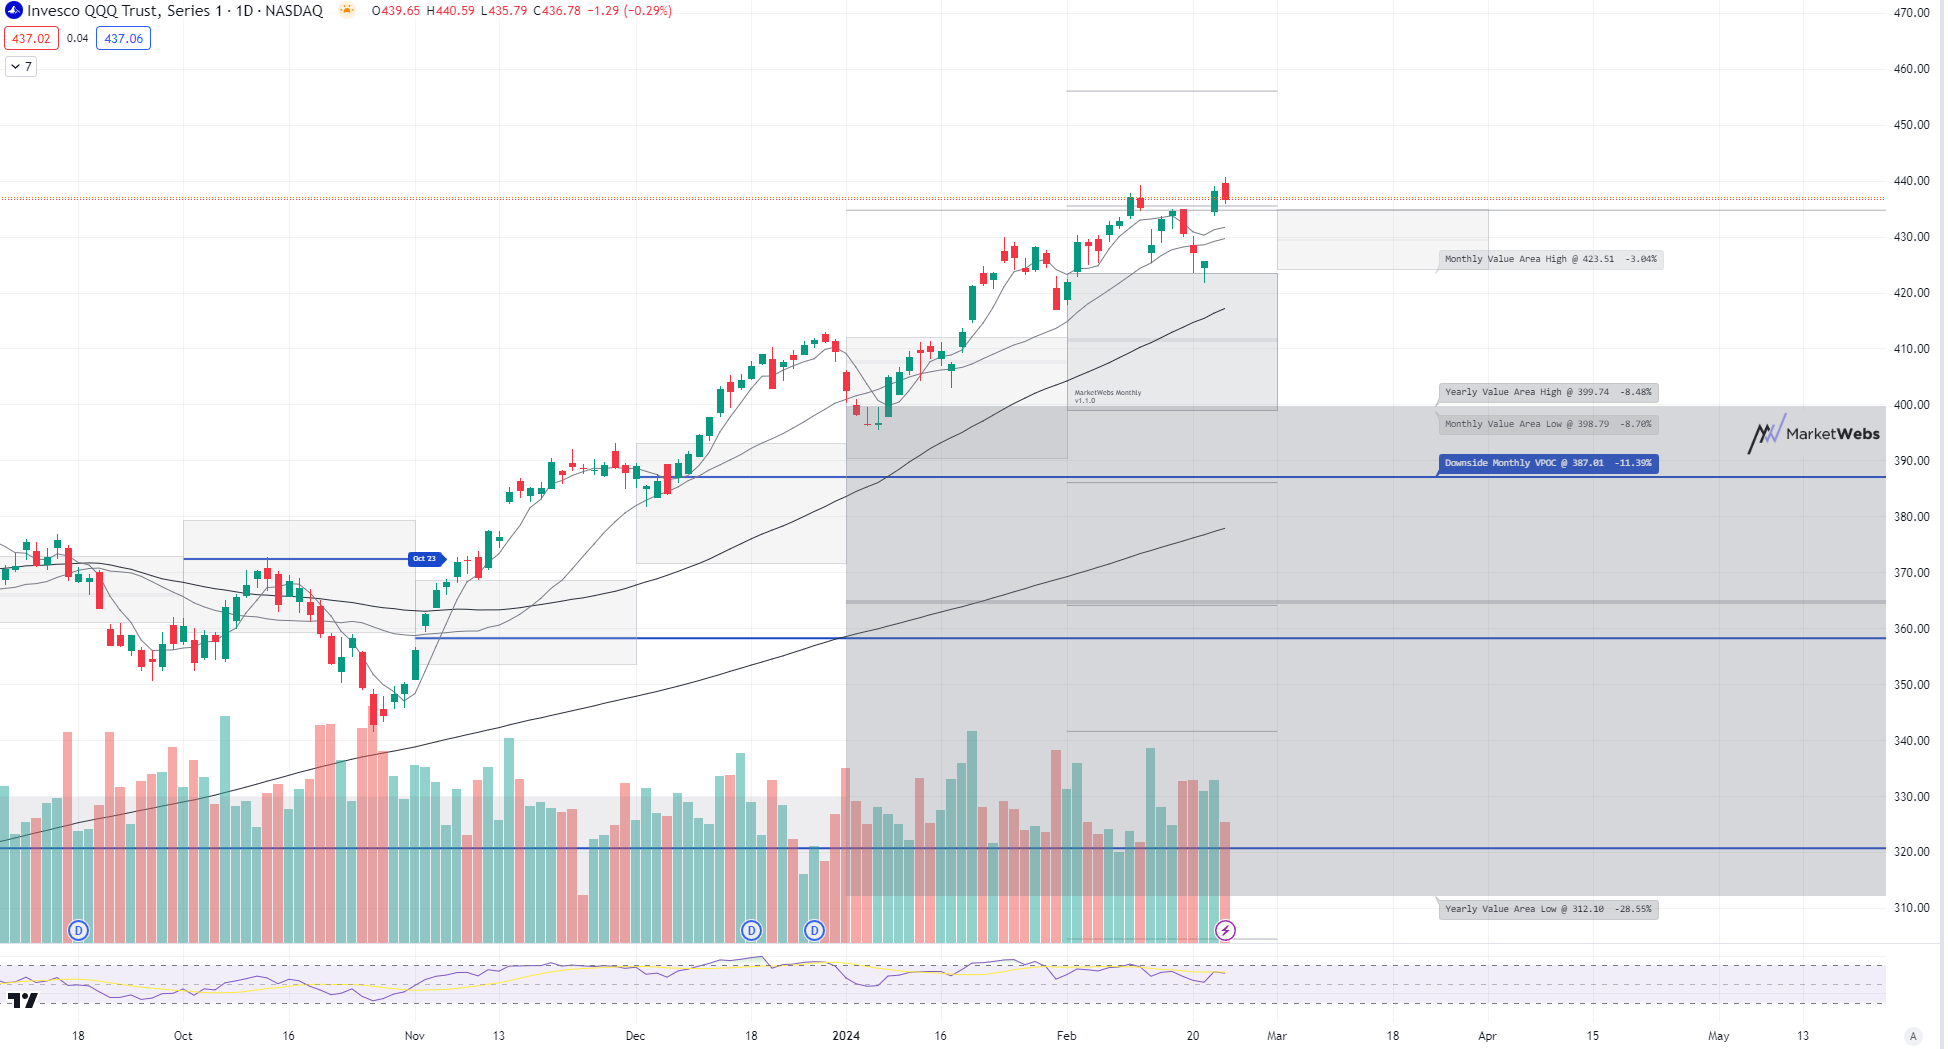
1hr chart: Bit of a different picture here vs the S&P as price opens up inside its new Value Area for the week, resistance at $439.72 / support down at $425.84

IWM - Russell Small Cap ETF- Price trailing this morning, ind. -0.3% and is above its Feb Value Area and 50d MA. Support to watch $197.76
1hr chart: Price opens up inside its new Value Area for the week and the Value Area is indicating High Volatility expected this week given the tighter than average recent price action. Levels top watch below.
Here is today’s TTG Proprietary Stock Screen “Out of the Box” using Volume At Price
names trending above their Value Areas (on 3 multiple timeframes & not super extended)
Keep reading with a 7-day free trial
Subscribe to The Tribeca Trade Group to keep reading this post and get 7 days of free access to the full post archives.