

TTG Index Charts & Out of the Box Stock Screen 2/21/24 $ABT $CL
TTG Index Charts & Out of the Box Stock Screen 2/21/24 $ABT $CL
Out of the Box MarketWebs Screen
US Dollar flat / 30yr Bonds +0.1% / Crude +0.1% & Nat Gas +10% / Gold +0.1% / Copper +0.6% / BTC -1.5%
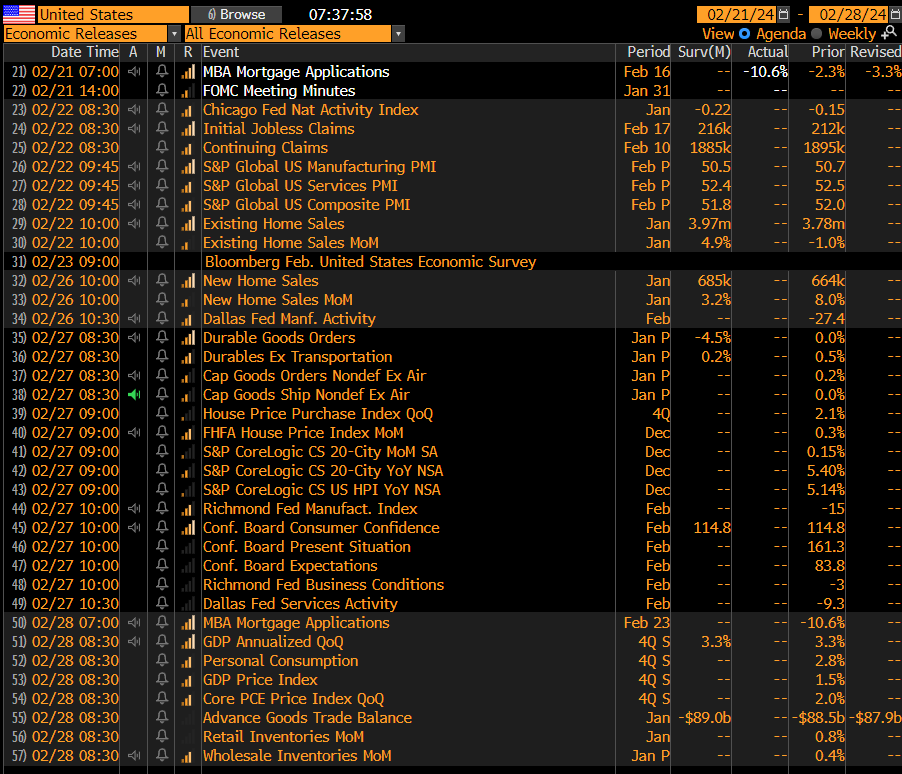
US Upcoming Economics
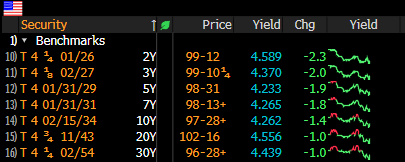
US Bond Yields
Index Updates
At TTG, I use Volume At Price in my chart analysis and I use the MarketWebs Indicator to provide Value Areas & VPOCs which indicate significant support & resistance levels. Learn More Here about Volume At Price and the MarketWebs.
ES_F - SPX Futures - Price ind. -0.3% and checking back to its 20d MA and it feels like many momentum trades / companies have lost that upside momentum and are correcting.
I am watching to see if price will hold its 20d MA support today , next support down is the top of Feb Value Area 4871.25 which is ~ 2% lower

1hr chart: Price now below its Value Area for the week, watch 4994.75 and downside VPOC (blue line) for next support

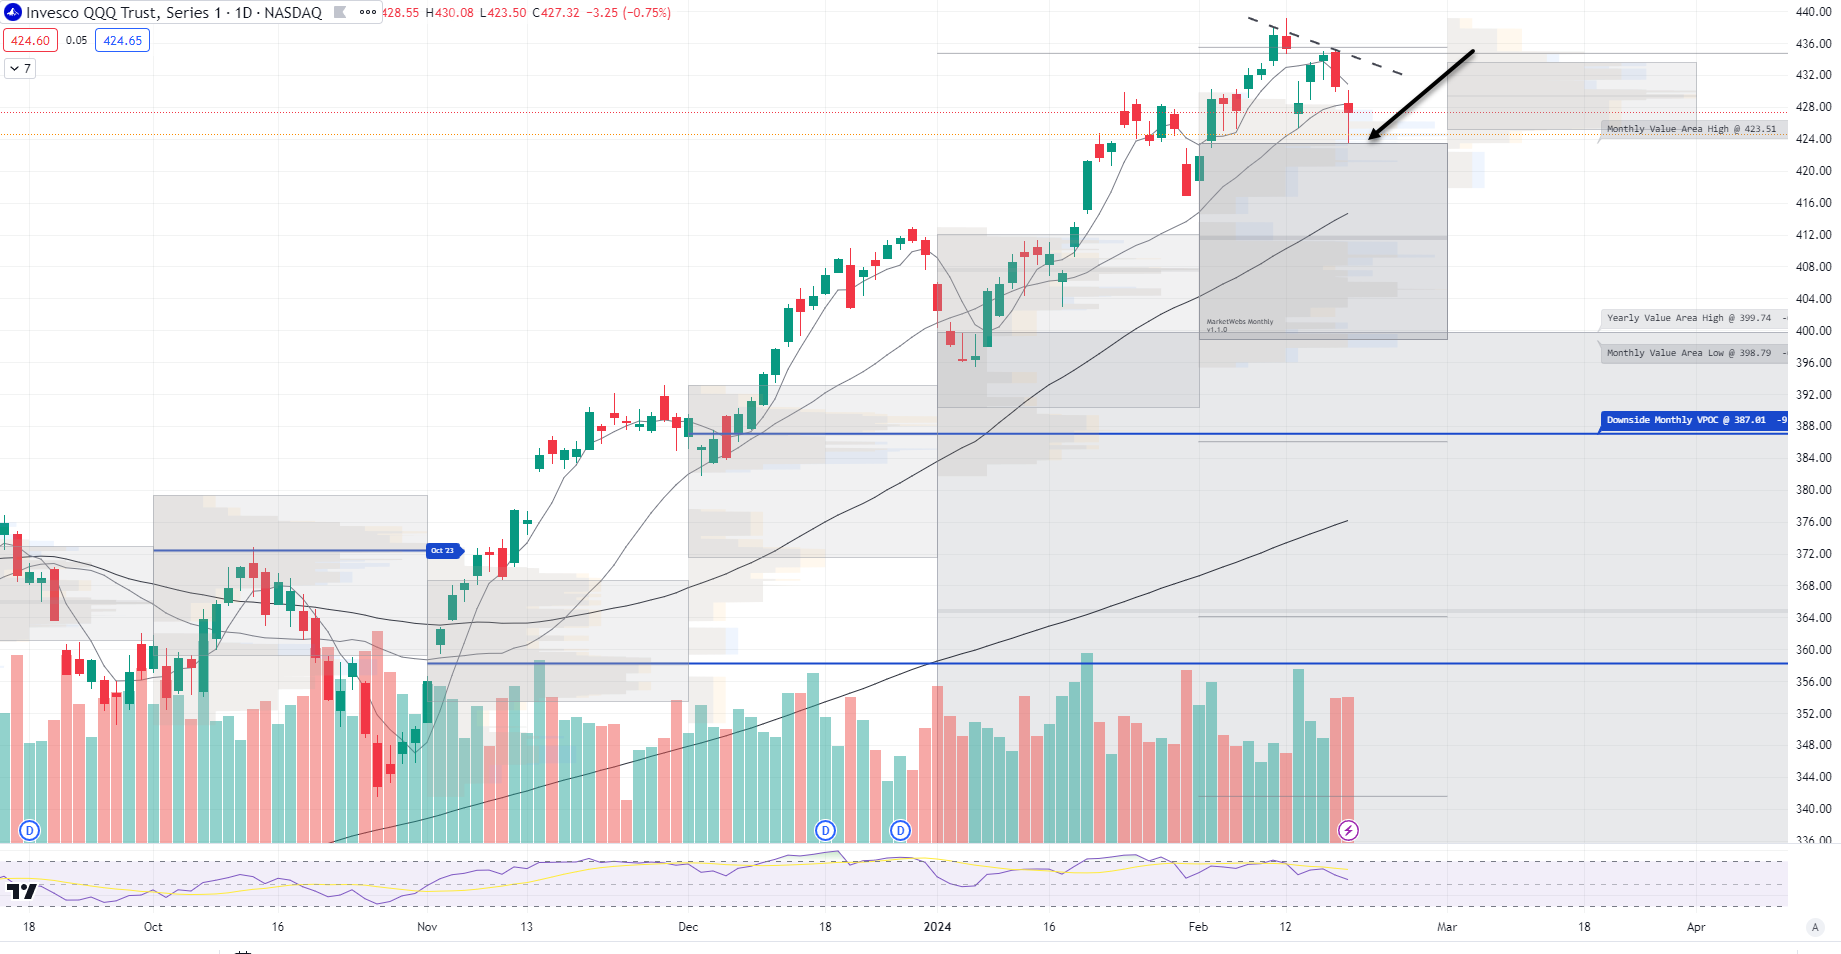
QQQ - NDX 100 ETF - Daily chart: Price ind. -0.6% and yesterday bounced of it top of Feb Value Area, I am continuing to watch $423.5 to see if support hold
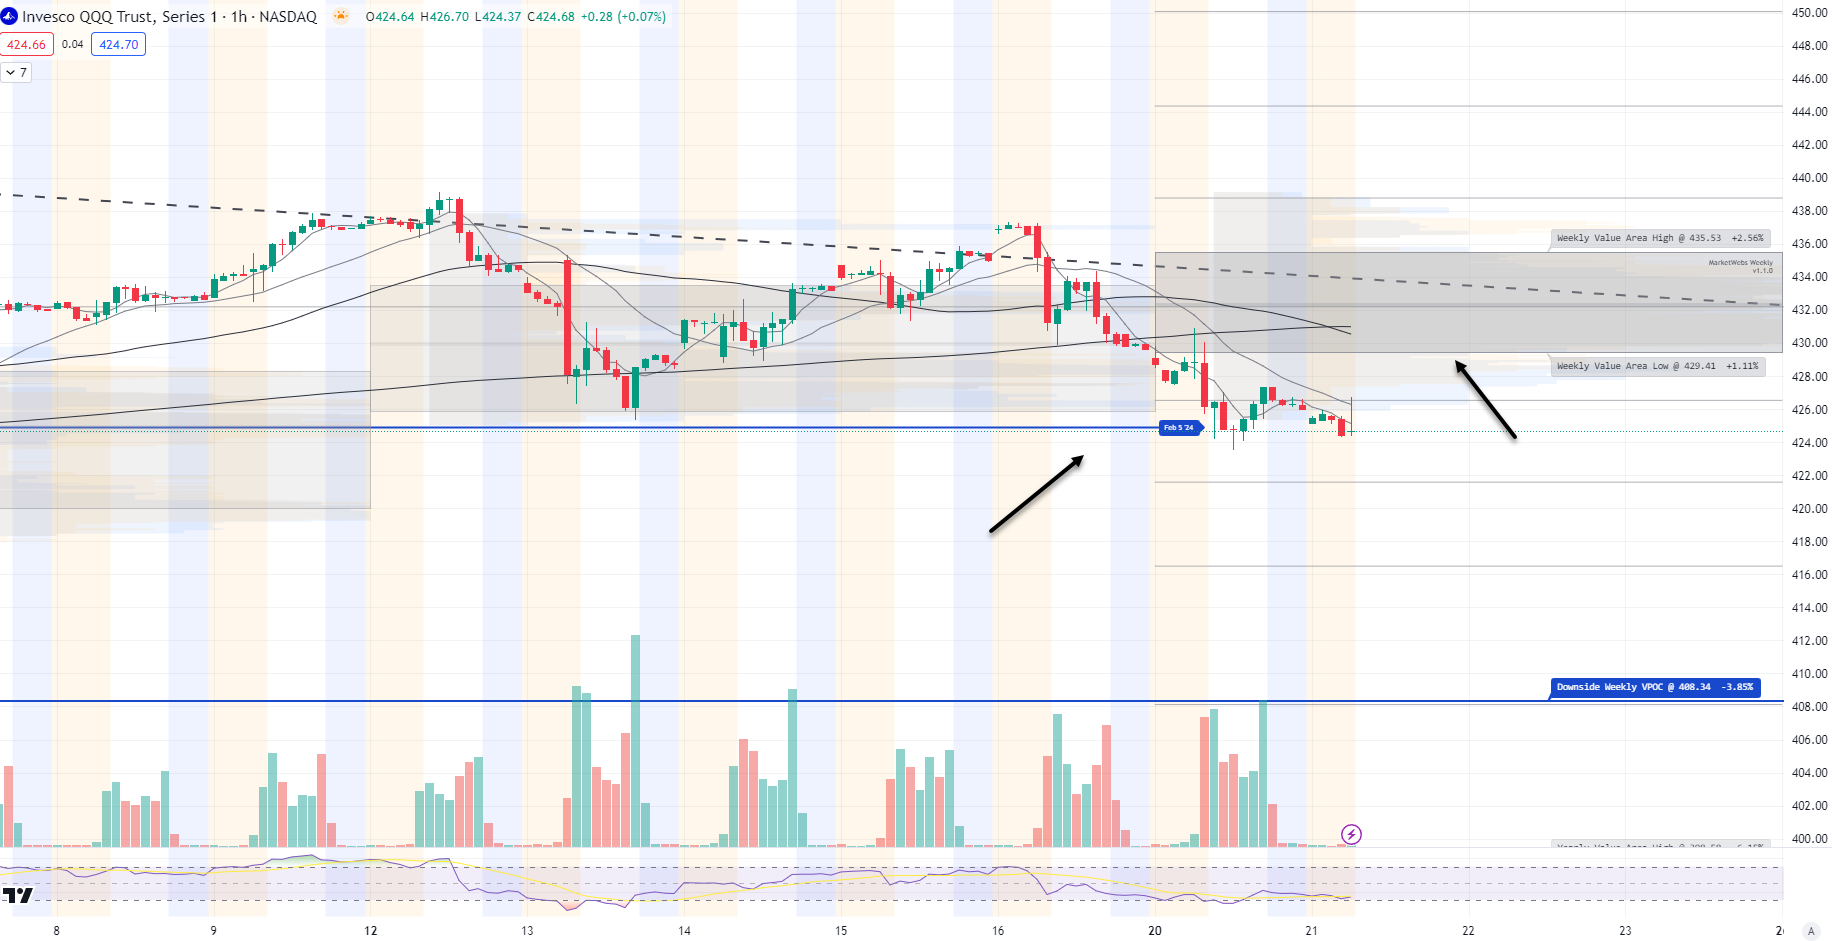
1hr chart: Price below its Value Area for the week and returning back to that VPOC (blue line) take out yesterday, it will be interesting to see if price can hold above that area today . Overhead resistance is $429.41
IWM - Russell Small Cap ETF- Price underperforming this morning, -0.8%. Support to watch is the top of the Feb Value Area, $197.76
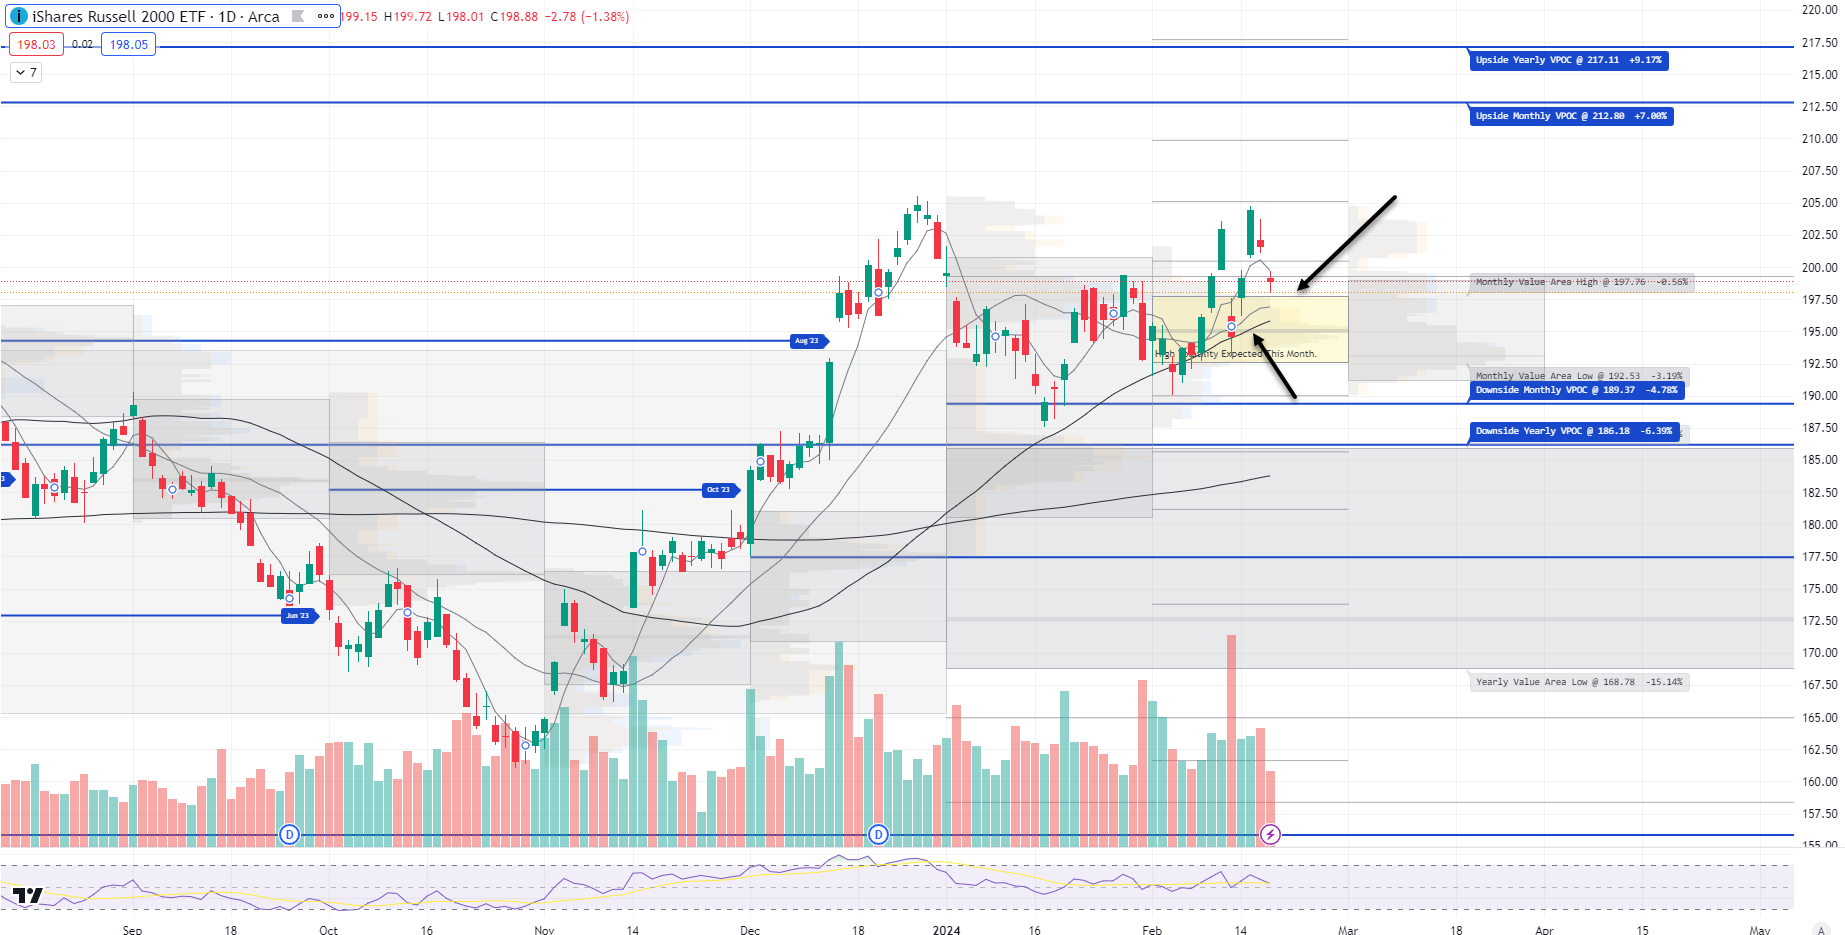
1hr chart: Price moving down to its bottom of Value Area , support to watch $197.44 which matches up closely with the top of Value Area on Daily chart timeframe

Here is today’s TTG Proprietary Stock Screen “Out of the Box” using Volume At Price
names trending above their Value Areas (on 3 multiple timeframes & not super extended)
Keep reading with a 7-day free trial
Subscribe to The Tribeca Trade Group to keep reading this post and get 7 days of free access to the full post archives.