

TTG Index Charts & Out of the Box Stock Screen 7/24/24
TTG Index Charts & Out of the Box Stock Screen 7/24/24
Out of the Box MarketWebs Screen
US Dollar -0.1% / 30yr Bonds flat / Crude +1.3% & Nat Gas -2.6% / Gold +0.5% / Copper -0.2% / BTC +1.5%
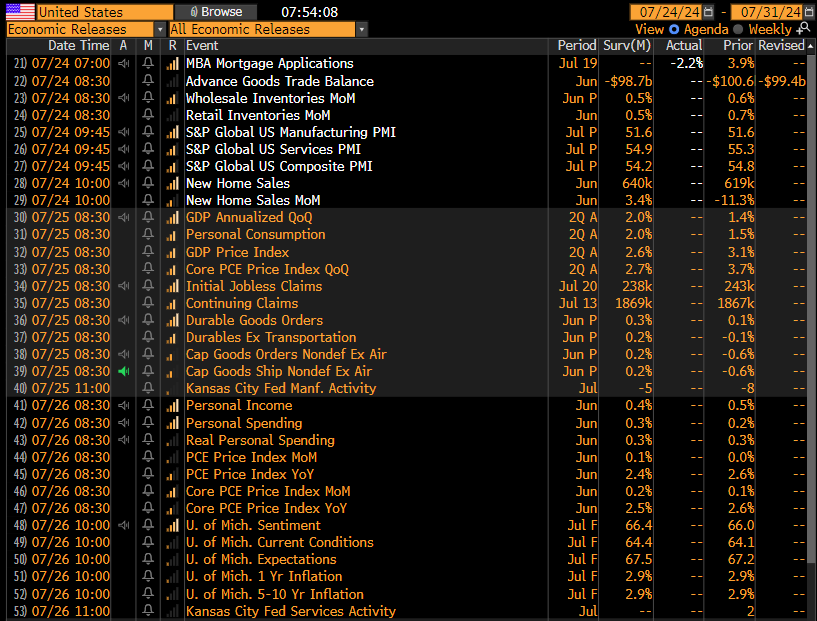
US Upcoming Economics & Fed Speakers
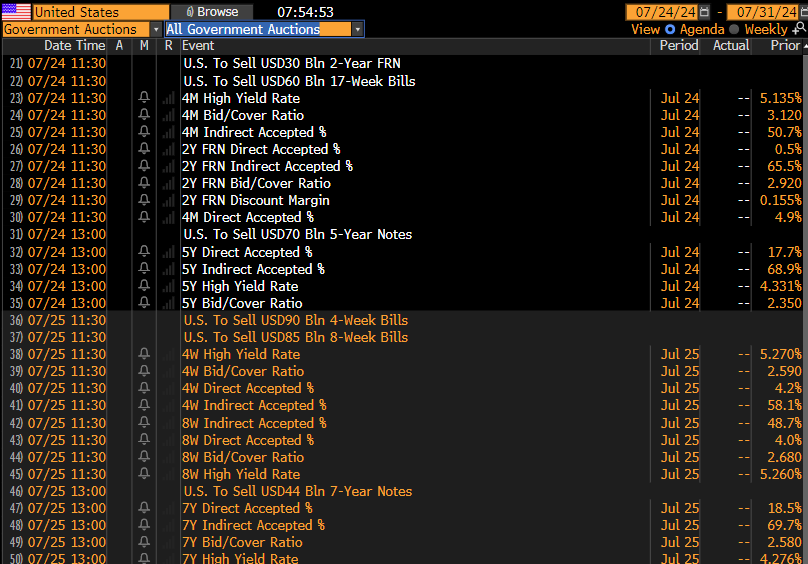
Bond Auctions
Index Updates
At TTG, I use Volume At Price in my chart analysis and I use the MarketWebs Indicator to provide Value Areas & VPOCs which indicate significant support & resistance levels. Learn More Here about Volume At Price and the MarketWebs.

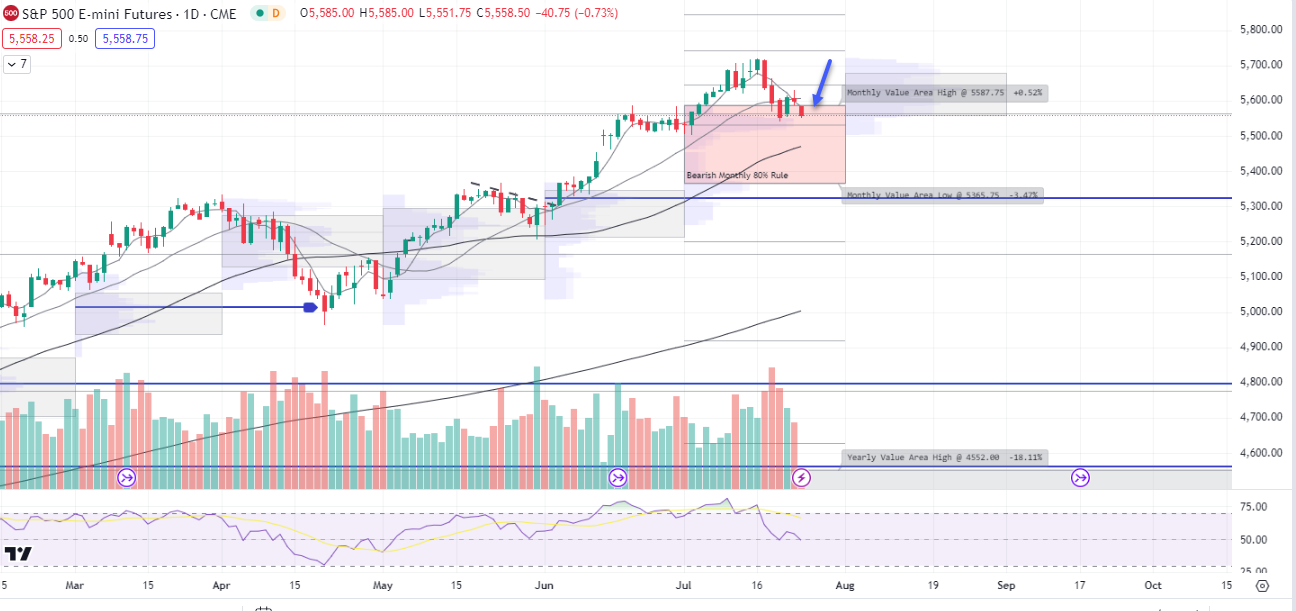
ES_F - SPX Futures - Daily chart: Price lower this morning -0.7% after some earnings report disappoint, and price now back inside the July Value Area, resistance 5587.75 and let's see if last week's lows hold as support
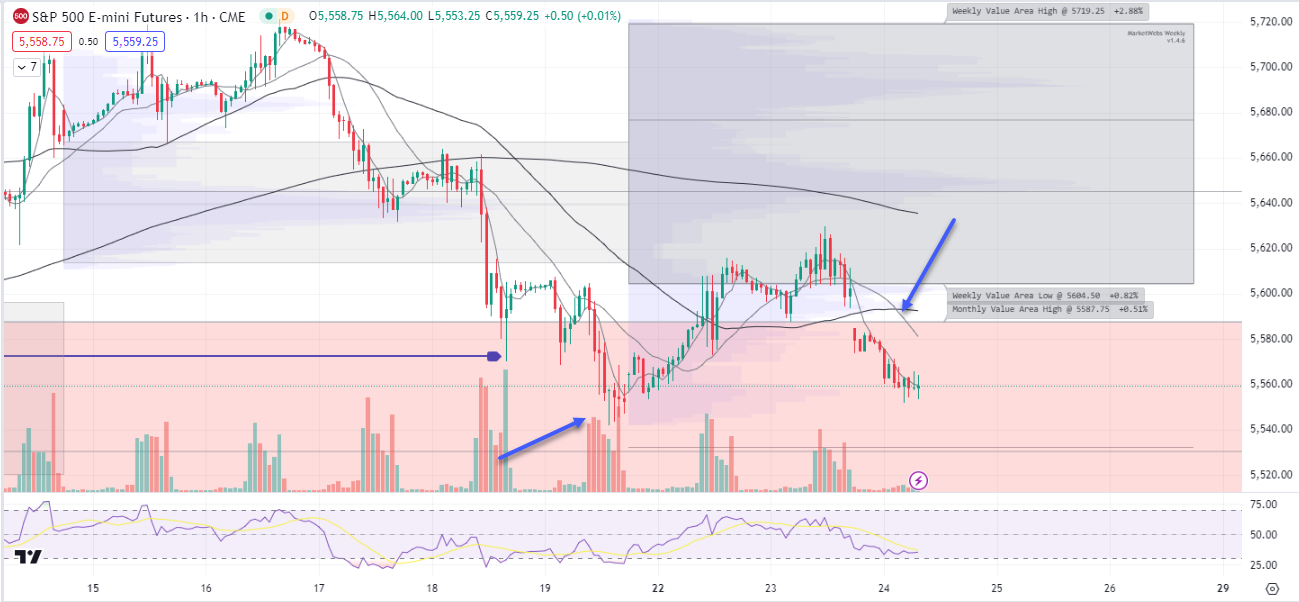
1hr chart: Price back out of this week's Value Area and testing last week's low
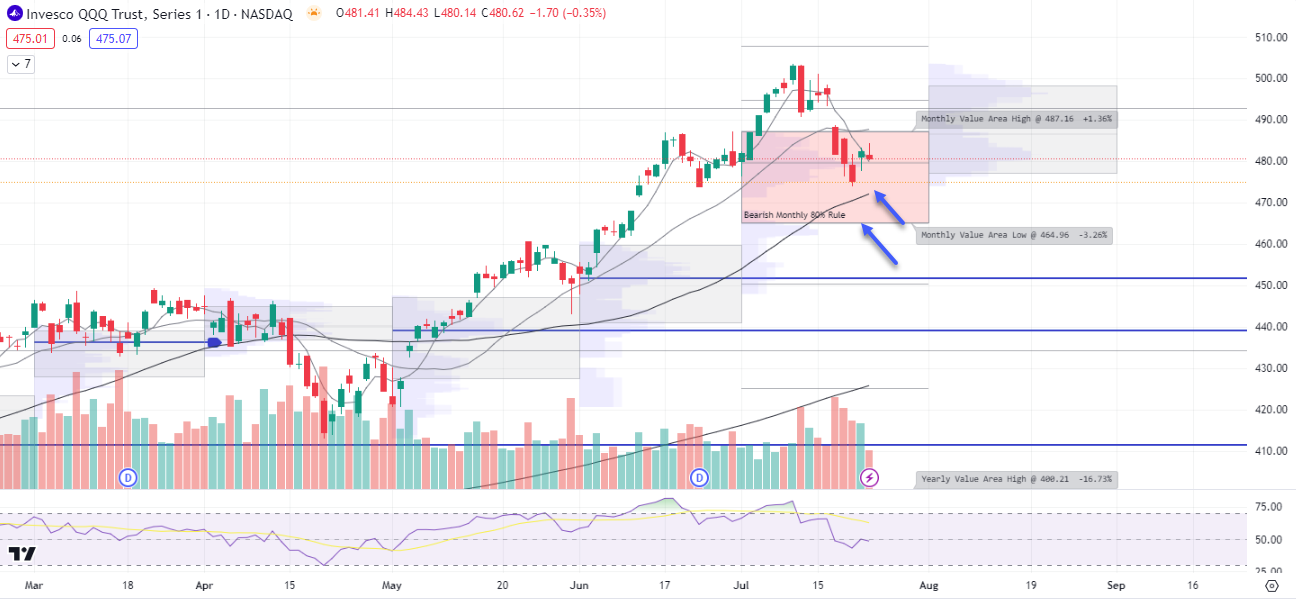
QQQ - NDX 100 ETF - Daily chart: Price getting hit this morning -1.2% and as I have talked about the #bearish 80% rule remains in effect for the month of July for a move down to $464.96 and the 50d MA may act as support.
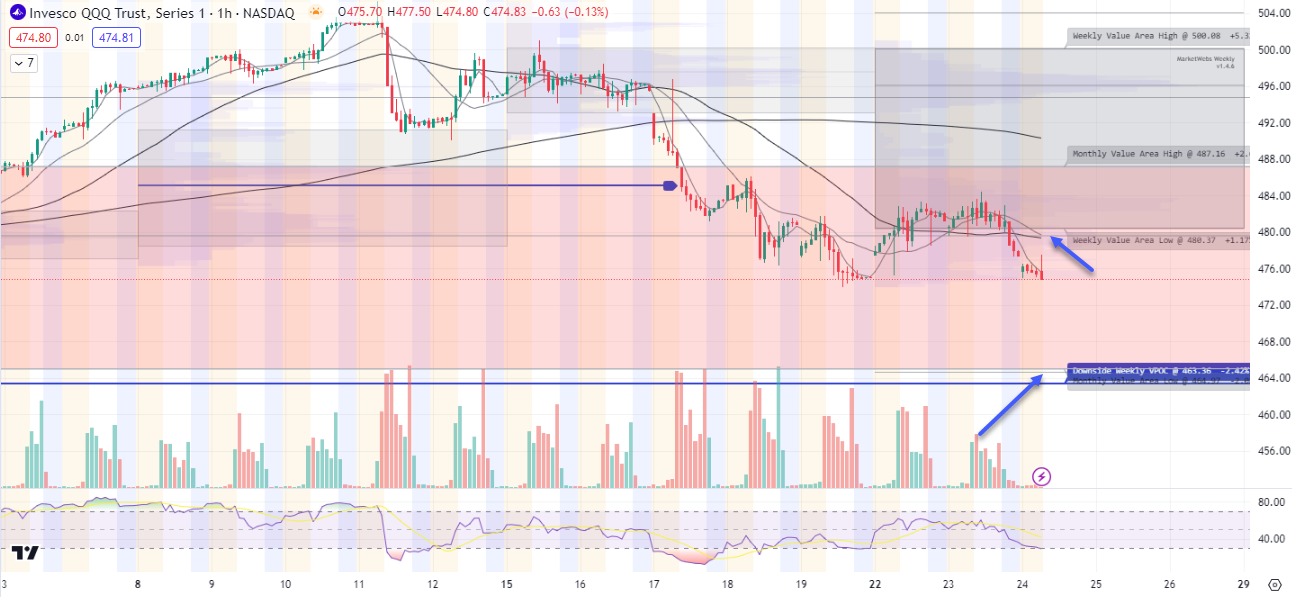
1hr chart: Similar to the S&P, price is also testing last week's lows, if that breaks watch the levels mentioned in Daily chart section
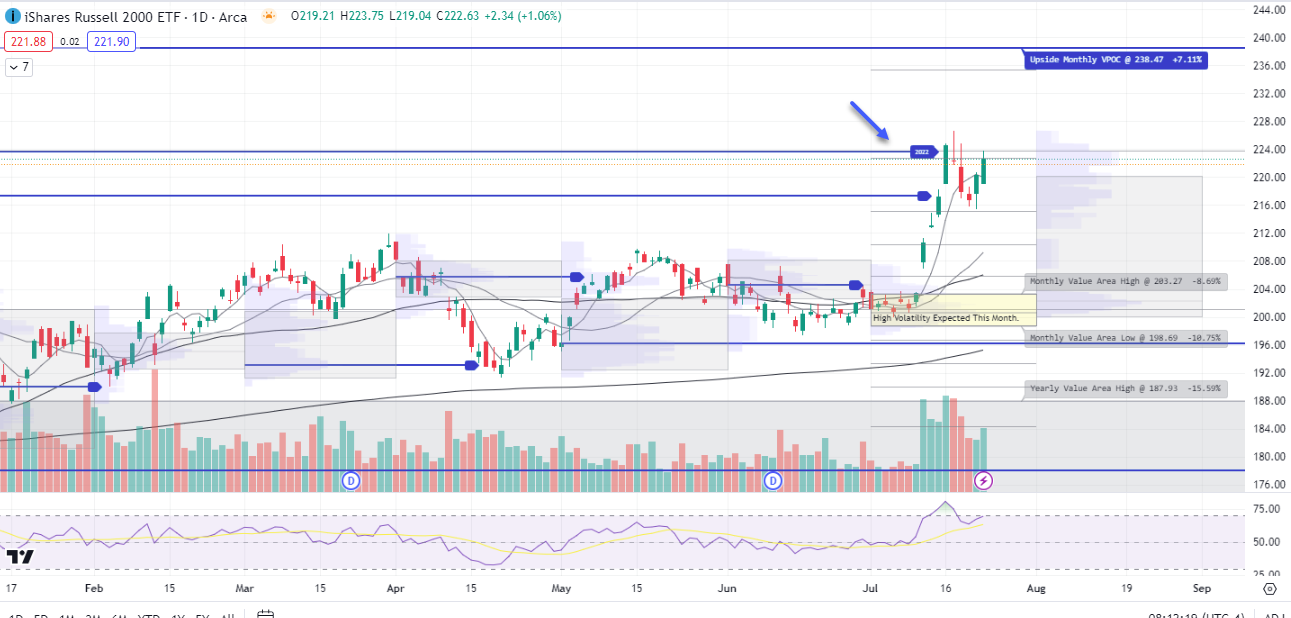
IWM - Russell Small Cap ETF- Daily Chart: Small Caps outperforming this morning, ind. -0.3% and also performing well for week +2.7% so far. Yesterday, price regained its 5d MA (Moving Average).
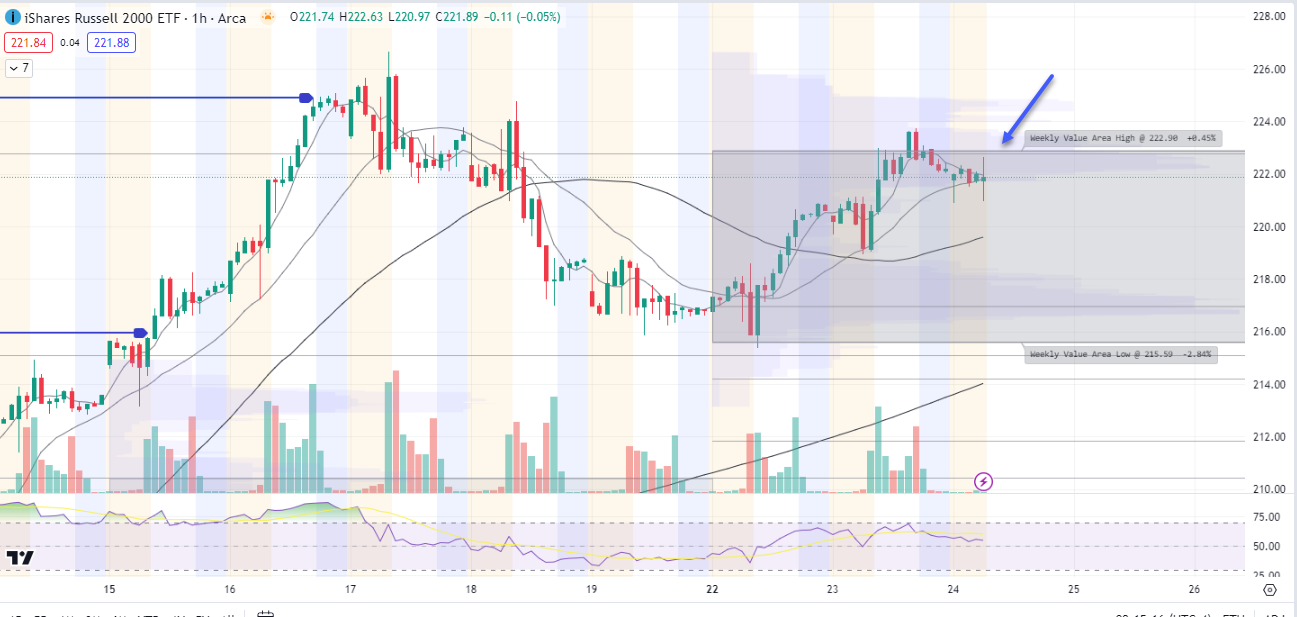
IWM 1hr chart: Yesterday, price tested the top of its Value Area for the week, and level to watch here is $222.90
Here is today’s TTG Proprietary Stock Screen “Out of the Box” using Volume At Price
names trending above their Value Areas (on 3 multiple timeframes & not super extended)
Keep reading with a 7-day free trial
Subscribe to The Tribeca Trade Group to keep reading this post and get 7 days of free access to the full post archives.