

TTG Index Charts & Out of the Box Stock Screen 3/20/24 $BECN
TTG Index Charts & Out of the Box Stock Screen 3/20/24 $BECN
Out of the Box MarketWebs Screen
US Dollar +0.3% / 30yr Bonds +0.2% / Crude -1.0% & Nat Gas -0.1% / Gold -0.2% / Copper -0.8% / BTC -1.0%
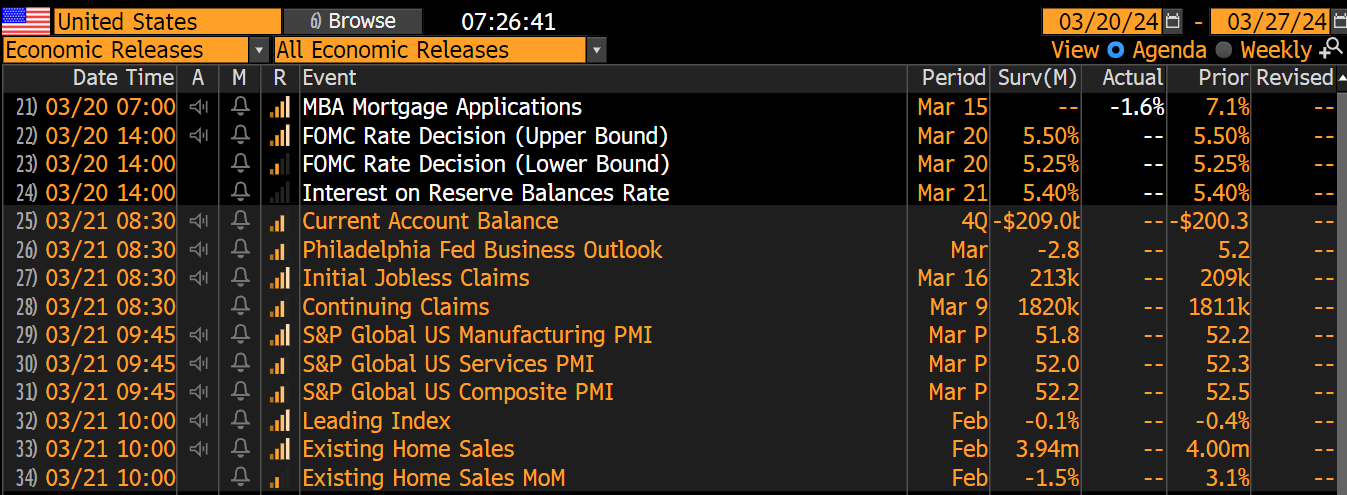
US Upcoming Economics
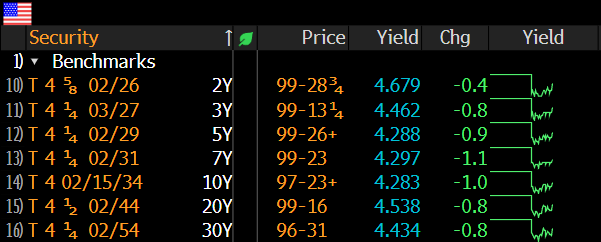
US Bond Yields
Index Updates
At TTG, I use Volume At Price in my chart analysis and I use the MarketWebs Indicator to provide Value Areas & VPOCs which indicate significant support & resistance levels. Learn More Here about Volume At Price and the MarketWebs.
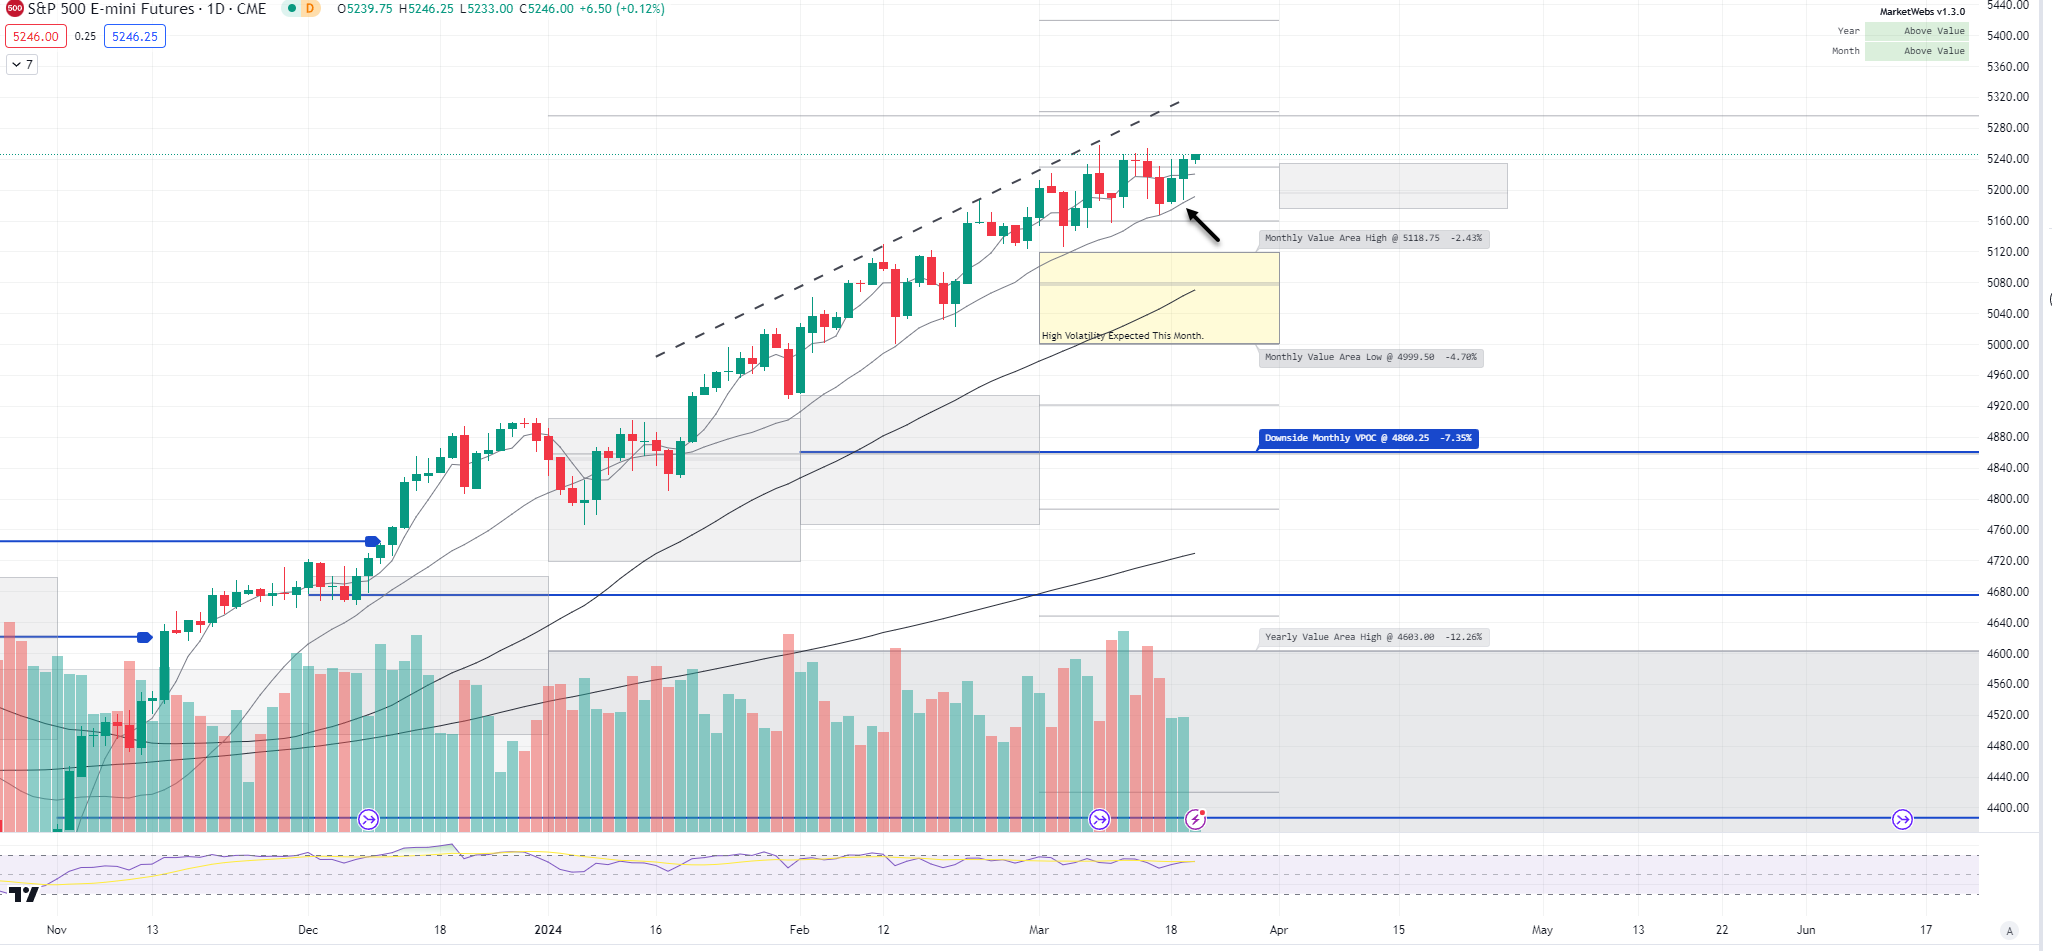
ES_F - SPX Futures - Price ~ flat this morning ahead of the Fed Meeting and yesterday, price held the 20d MA (Moving Average) once again and continues to stay in the uptrend channel
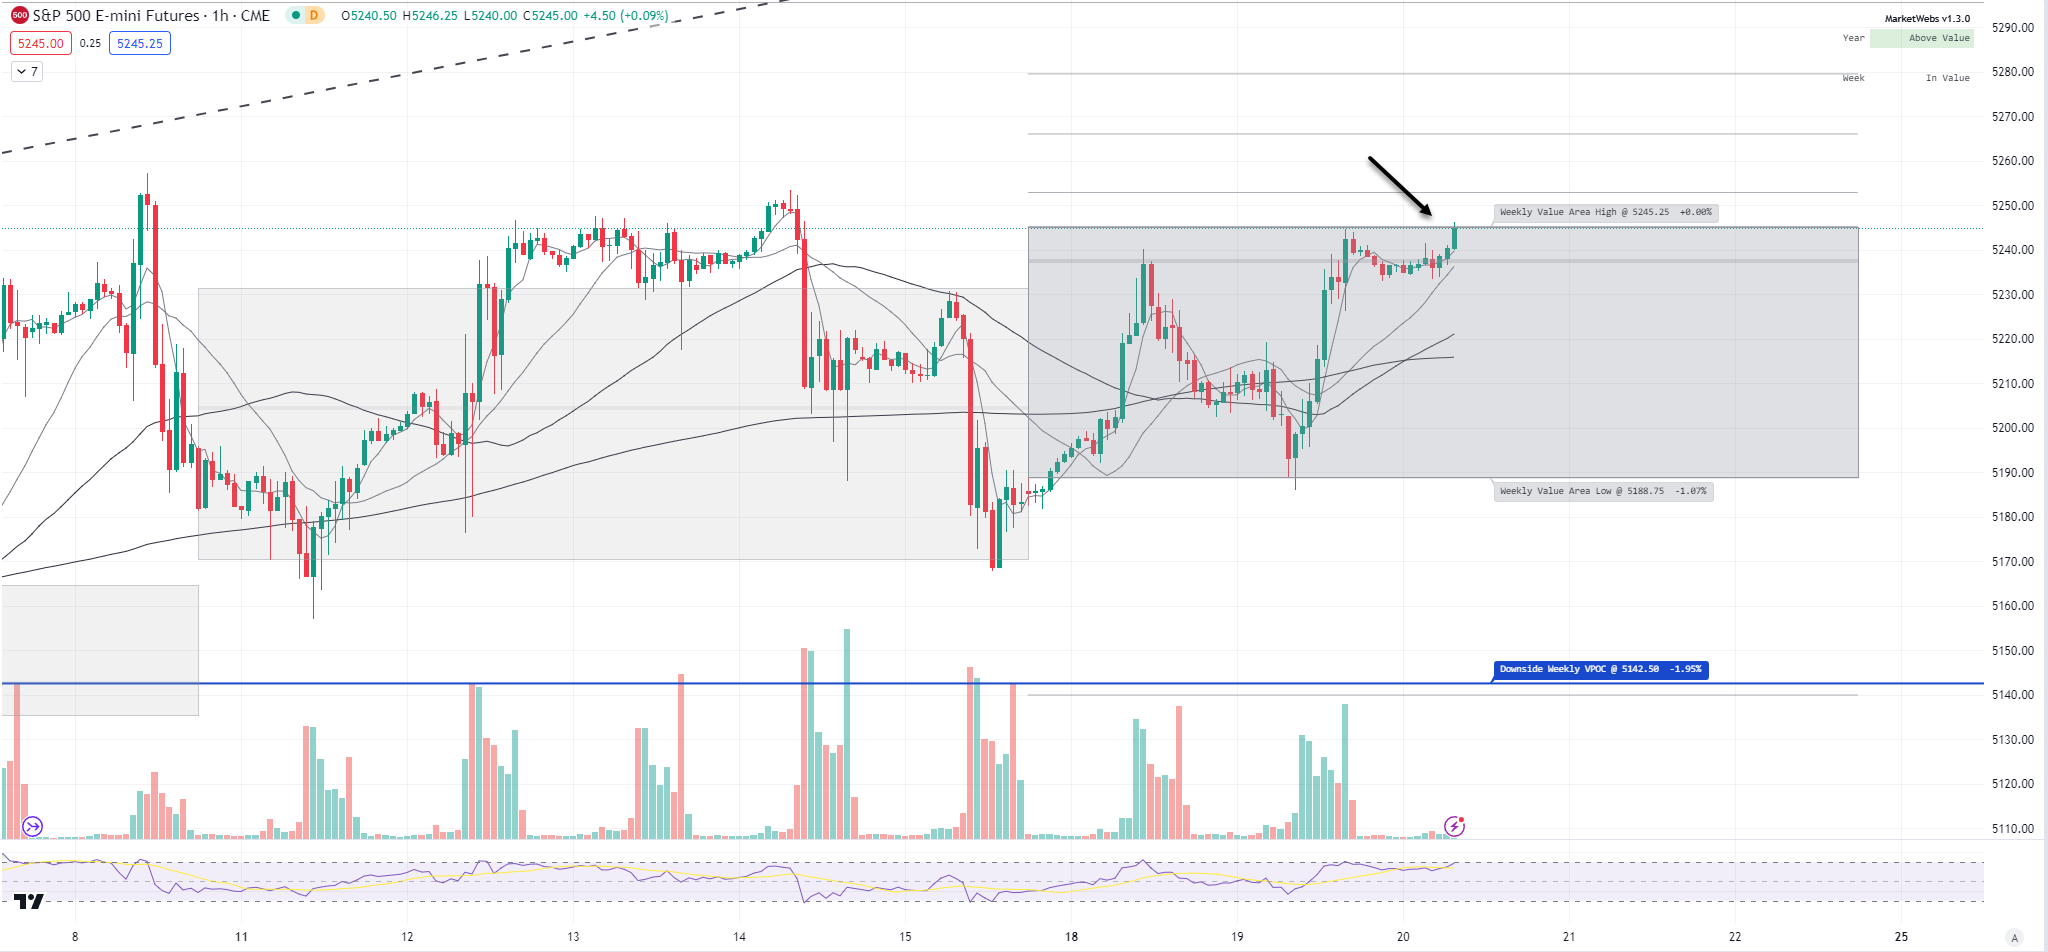
1hr chart: The #Bullish 80% rule is now complete as price traveled from one side of the Value Area to the other, watch 5245.25 resistance
QQQ - NDX 100 ETF - Daily chart: Price ind. +0.2% and price testing the top of the Mar Value Area and will be interesting to see if price can get back above resistance, watch $438.48
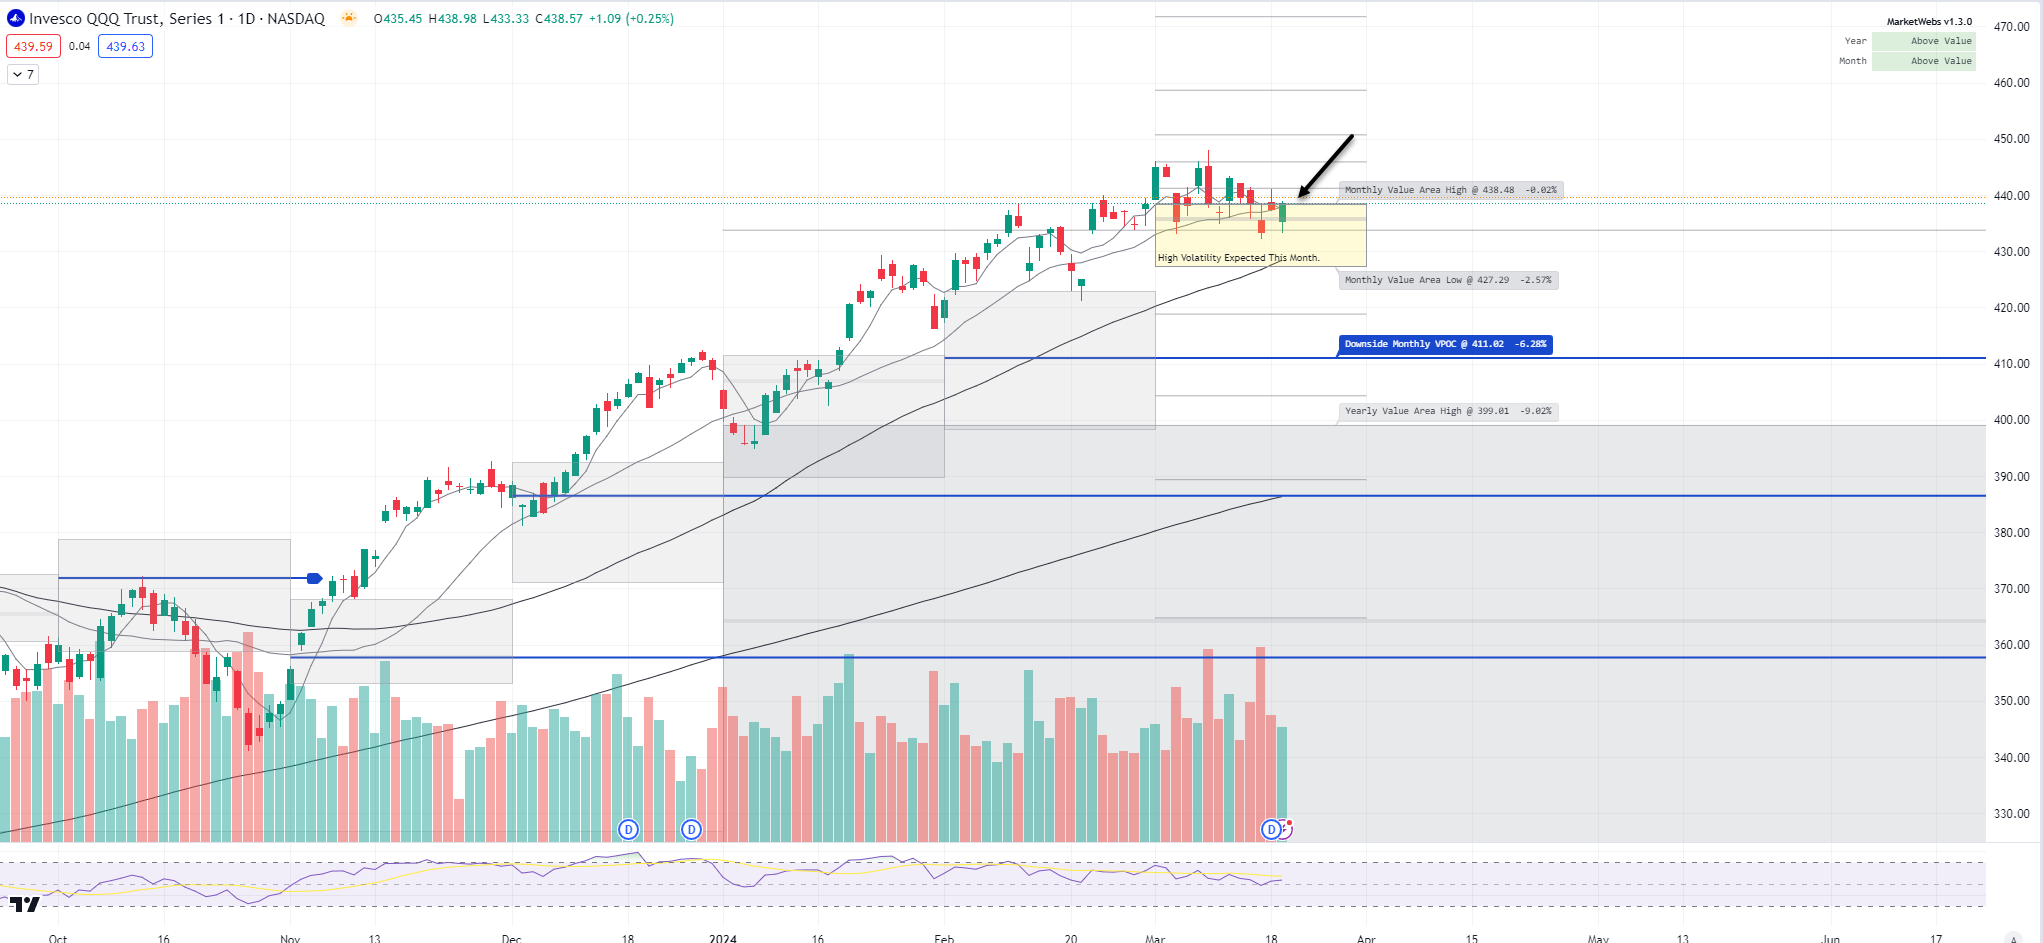
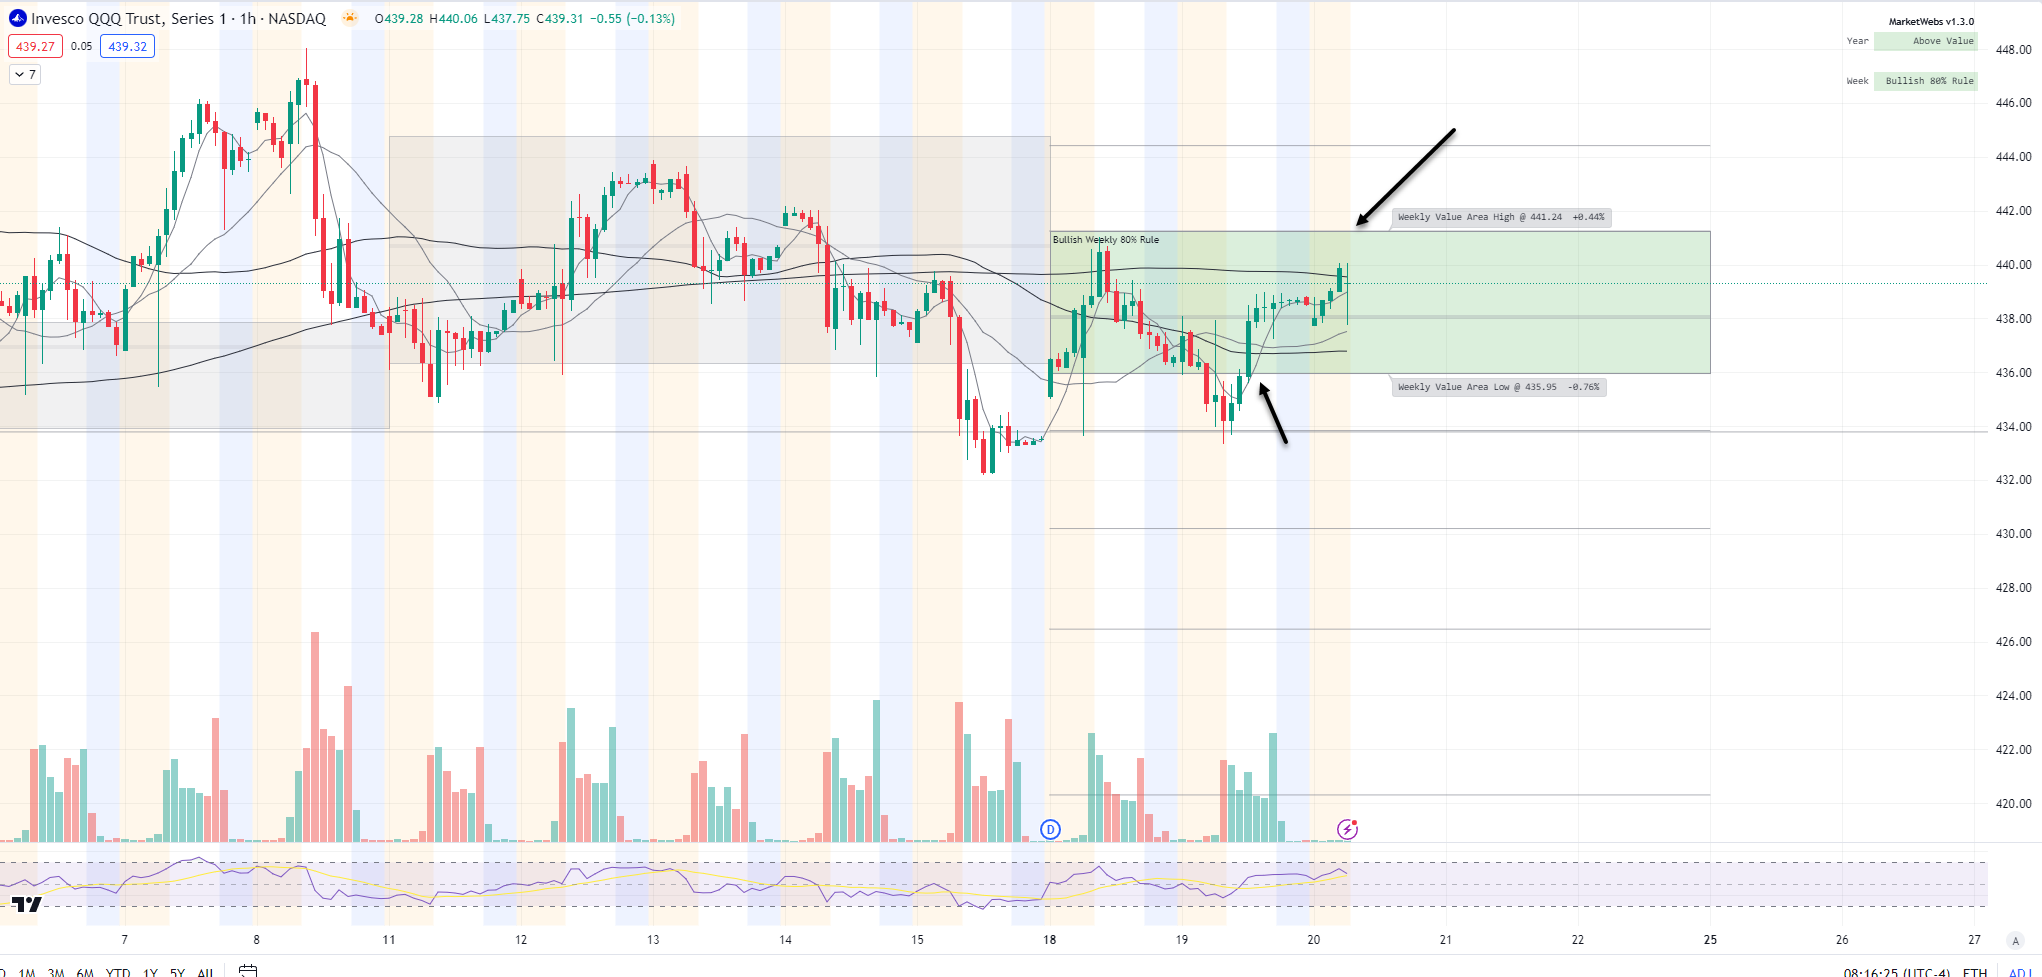
1hr chart: Price remains inside its Value Area for the week, watch $441.24 top of Value
IWM - Russell Small Cap ETF- Price ind. -0.2% and price managed to get back above its Mar Value Area yesterday, support to watch here is $200.79
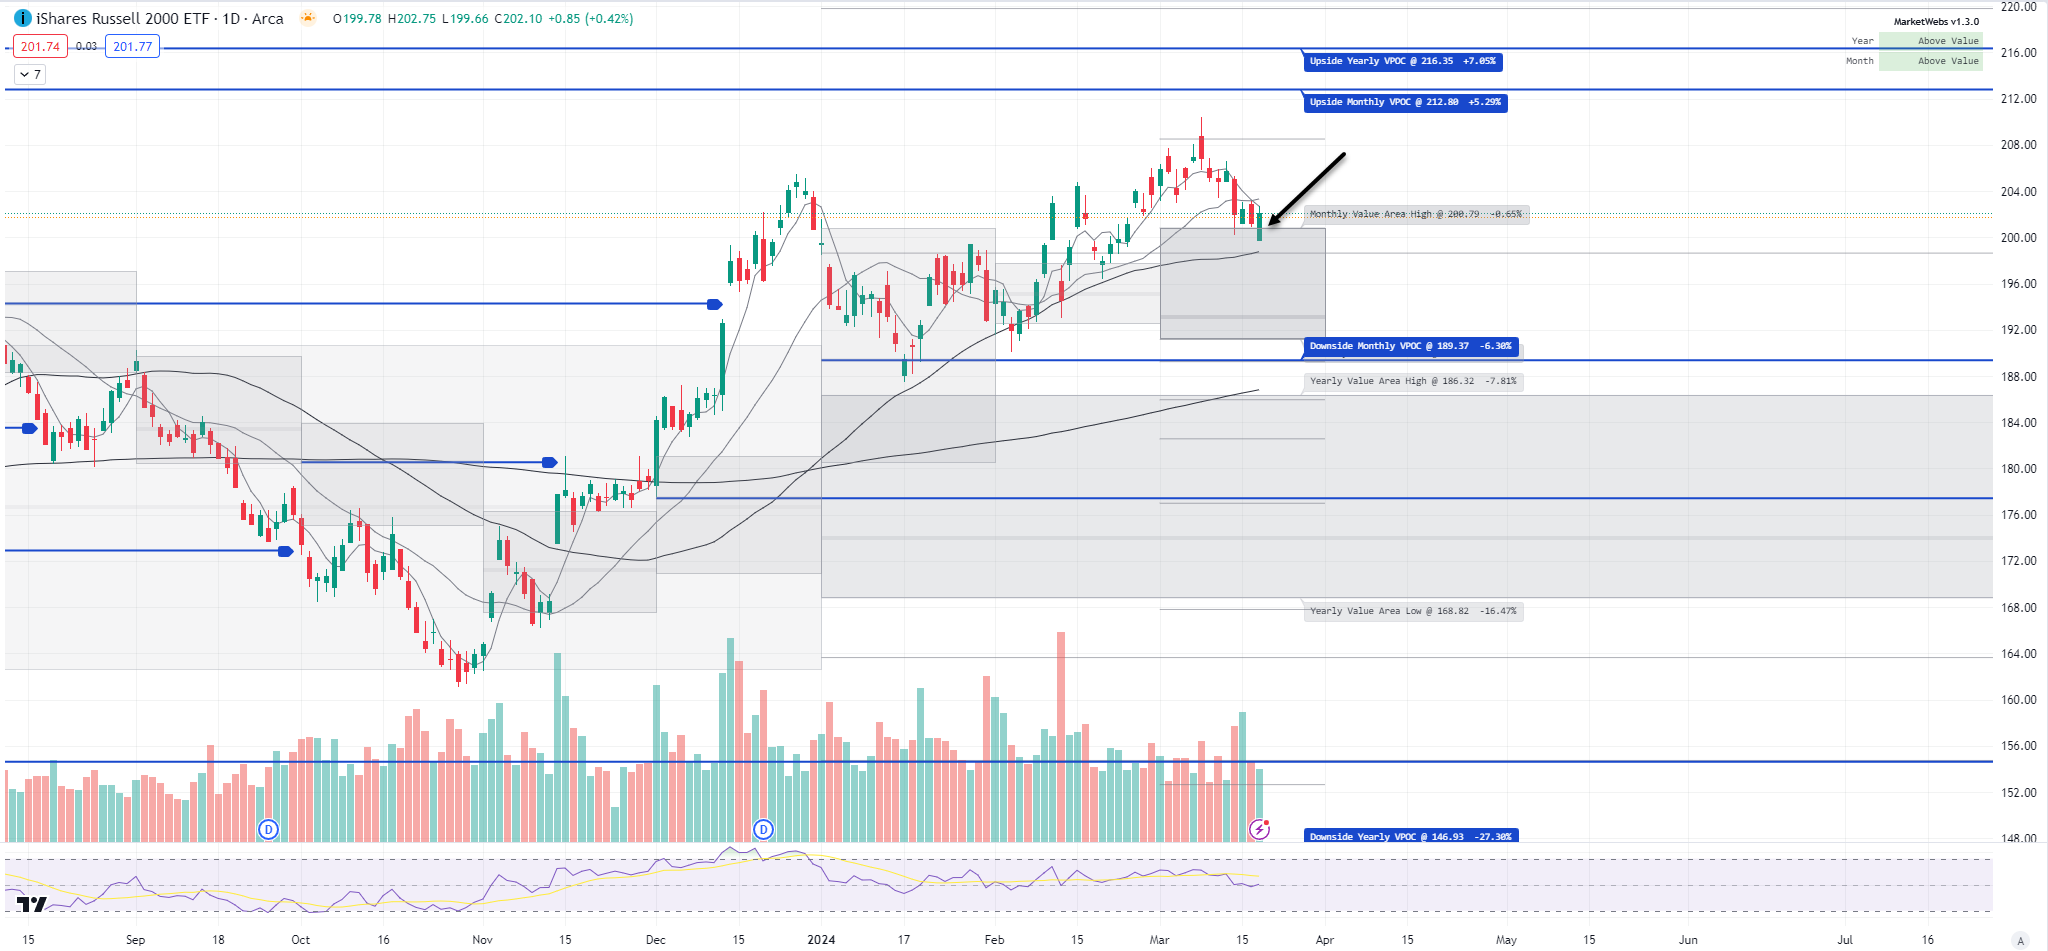
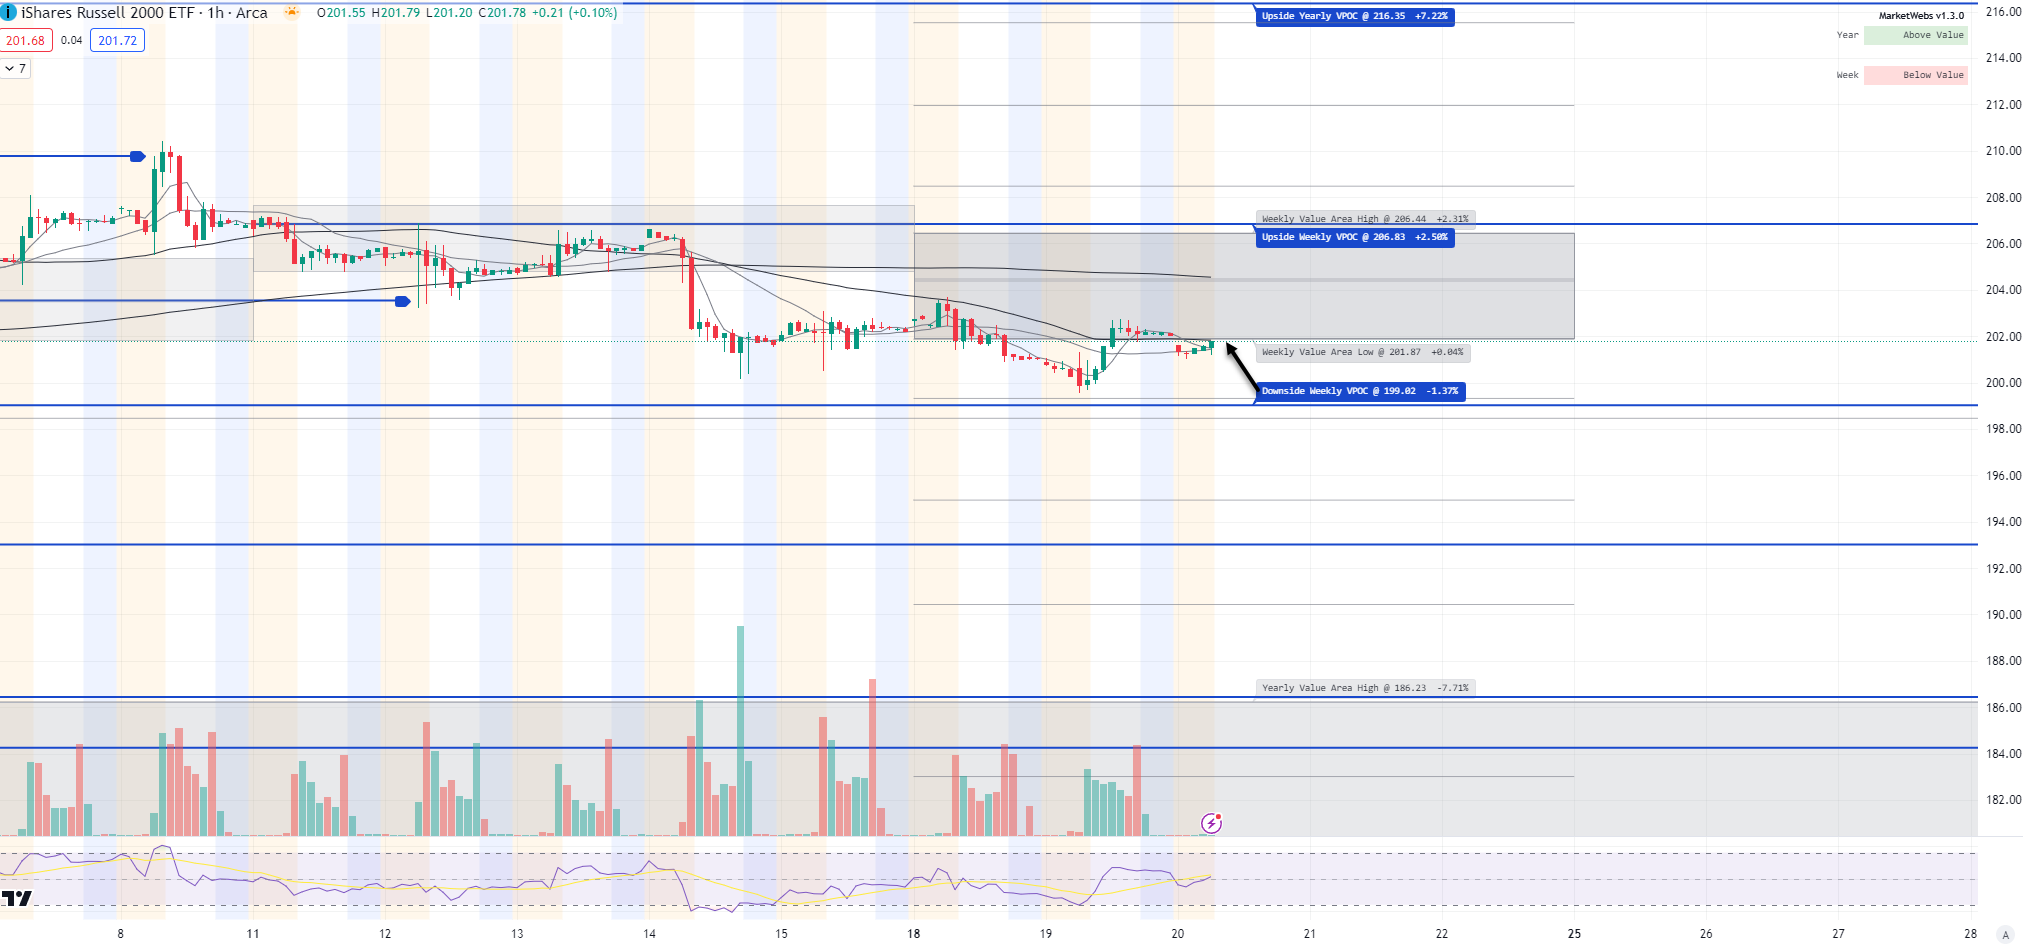
1hr chart: Price trying to get into its Value Area for the week., watch $201.87 resistance
Here is today’s TTG Proprietary Stock Screen “Out of the Box” using Volume At Price
names trending above their Value Areas (on 3 multiple timeframes & not super extended)
Keep reading with a 7-day free trial
Subscribe to The Tribeca Trade Group to keep reading this post and get 7 days of free access to the full post archives.