

TTG Index Charts & Out of the Box Stock Screen 2/12/24 $OKTA
TTG Index Charts & Out of the Box Stock Screen 2/12/24 $OKTA
Out of the Box MarketWebs Screen
US Dollar flat / 30yr Bonds +0.3% / Crude -1.0% & Nat Gas -0.1% / Gold +0.1% / Copper +0.1% / BTC +0.9%
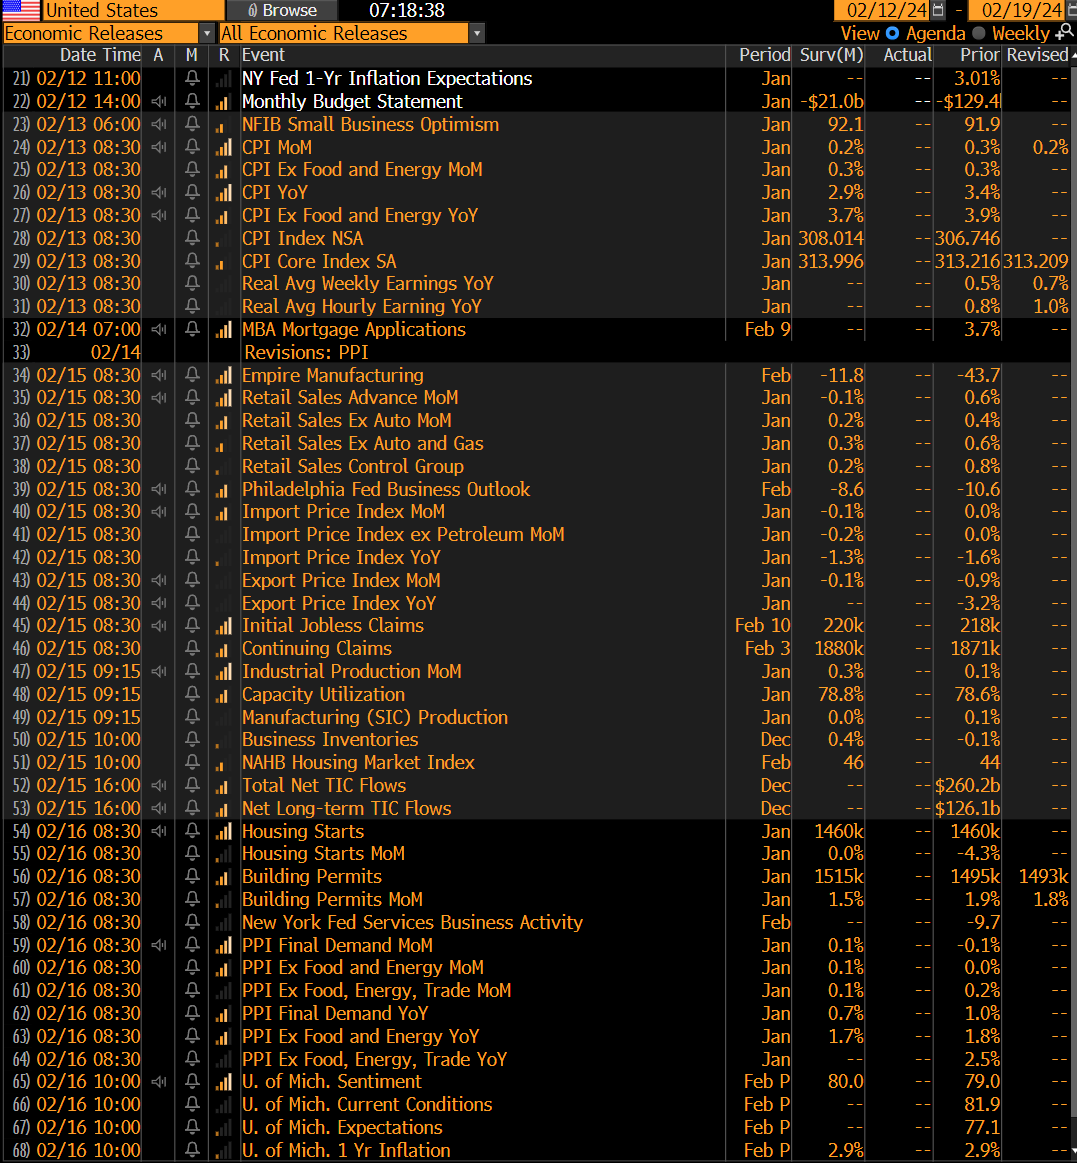
US Upcoming Economics
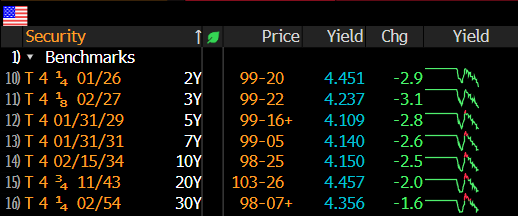
US Bond Yields
Index Updates
At TTG, I use Volume At Price in my chart analysis and I use the MarketWebs Indicator to provide Value Areas & VPOCs which indicate significant support & resistance levels. Learn More Here about Volume At Price and the MarketWebs.
ES_F - SPX Futures - Price flat this morning and continues to grind higher above its 5d MA (Moving Average). Note, this week we have the CPI report pre market tomorrow and this week is monthly options expiration. Both events could cause some short term volatility, but for now price is above its 5d MA and trending +
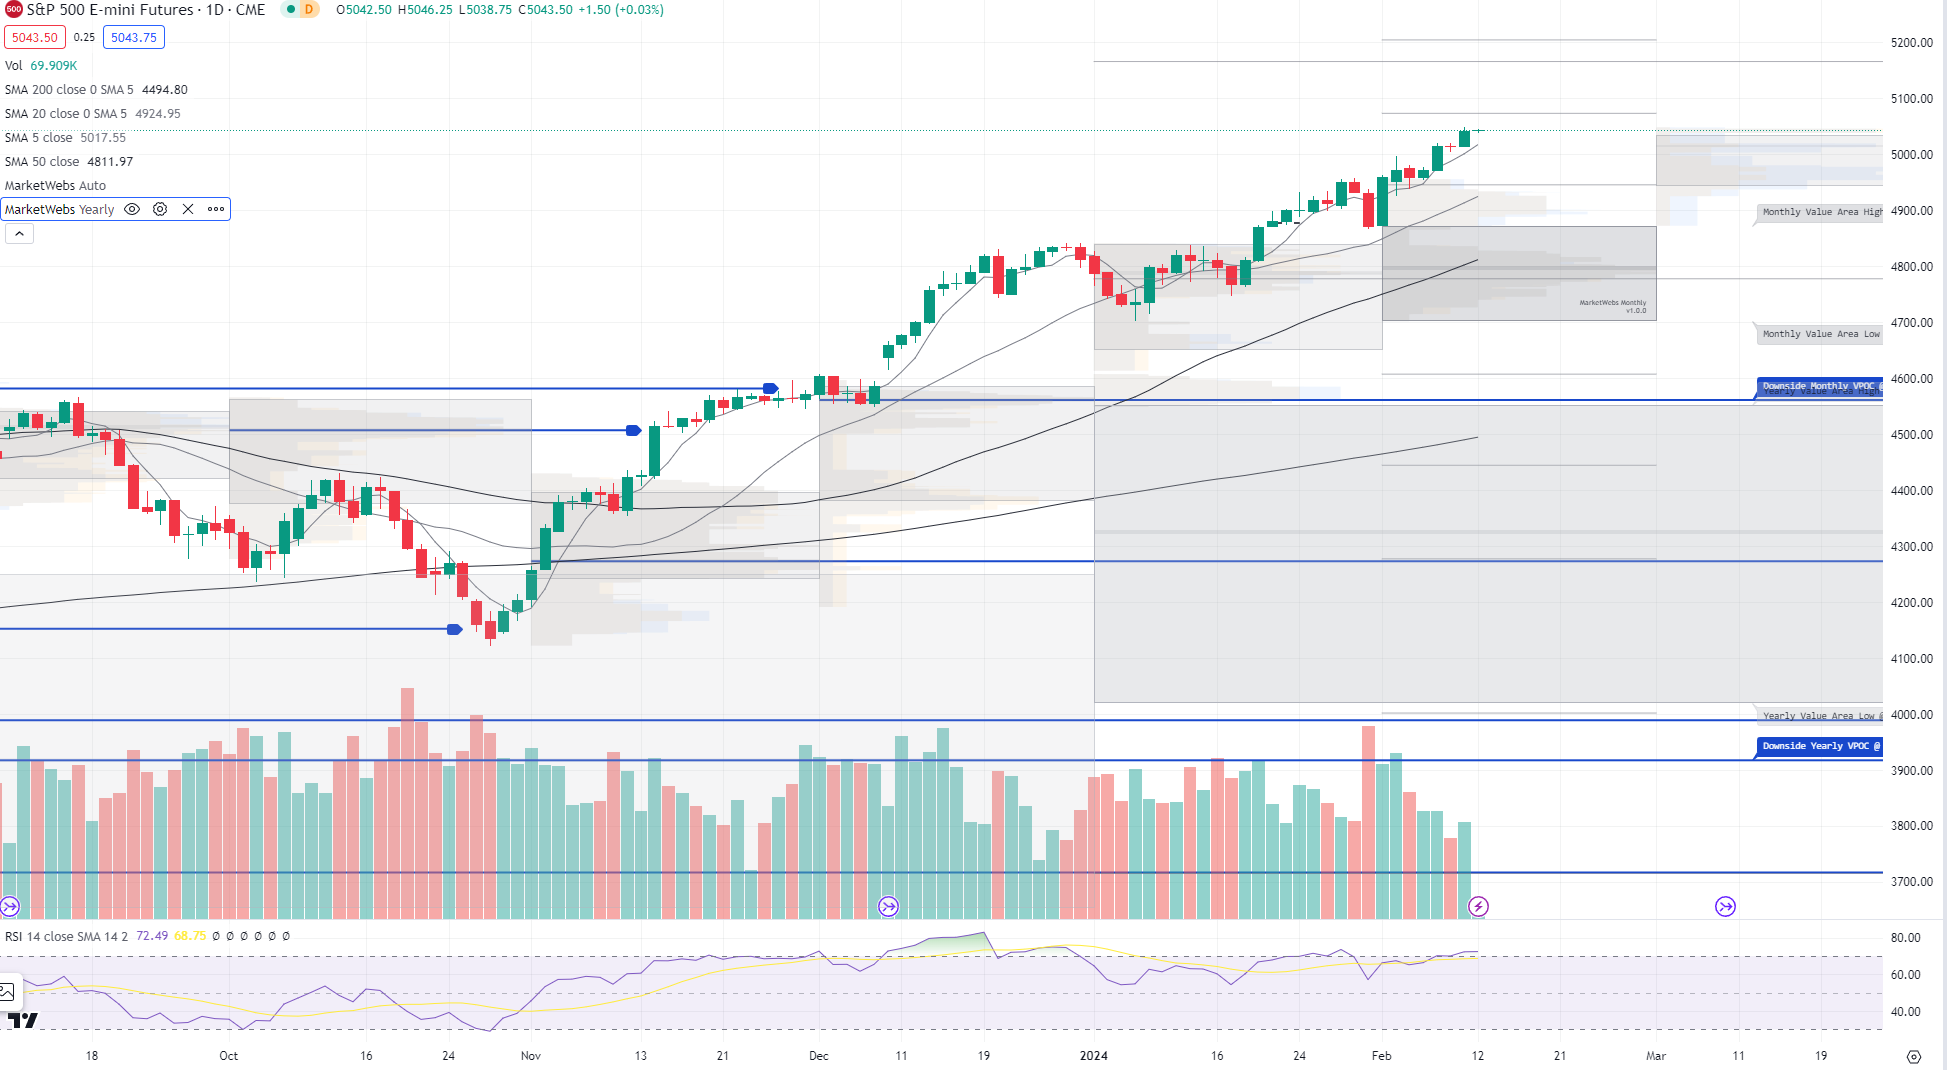
1hr chart: Price starts the new week just inside its Value Area , resistance to watch is 5046.5
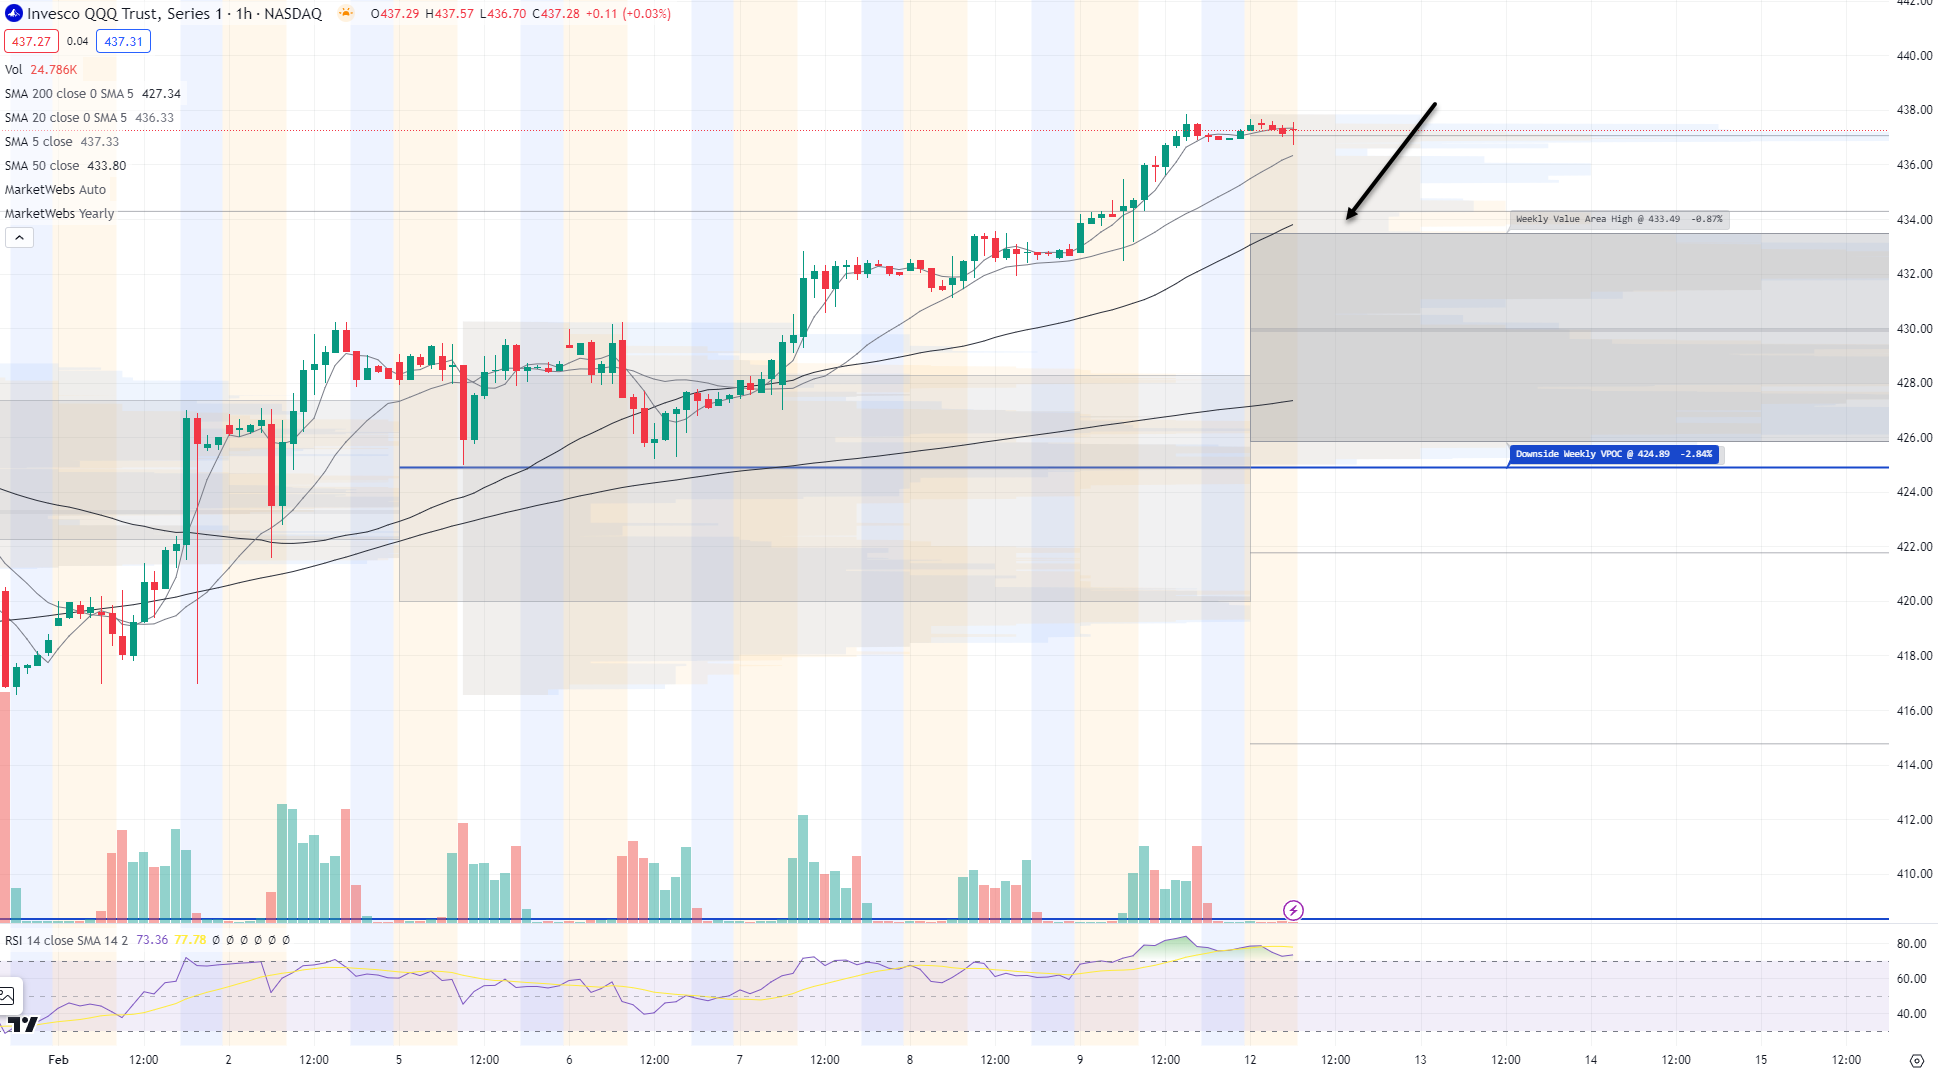
QQQ - NDX 100 ETF - Daily chart: Price also flat to start the week & similar to the SPX is above its 5d MA and the trend is +
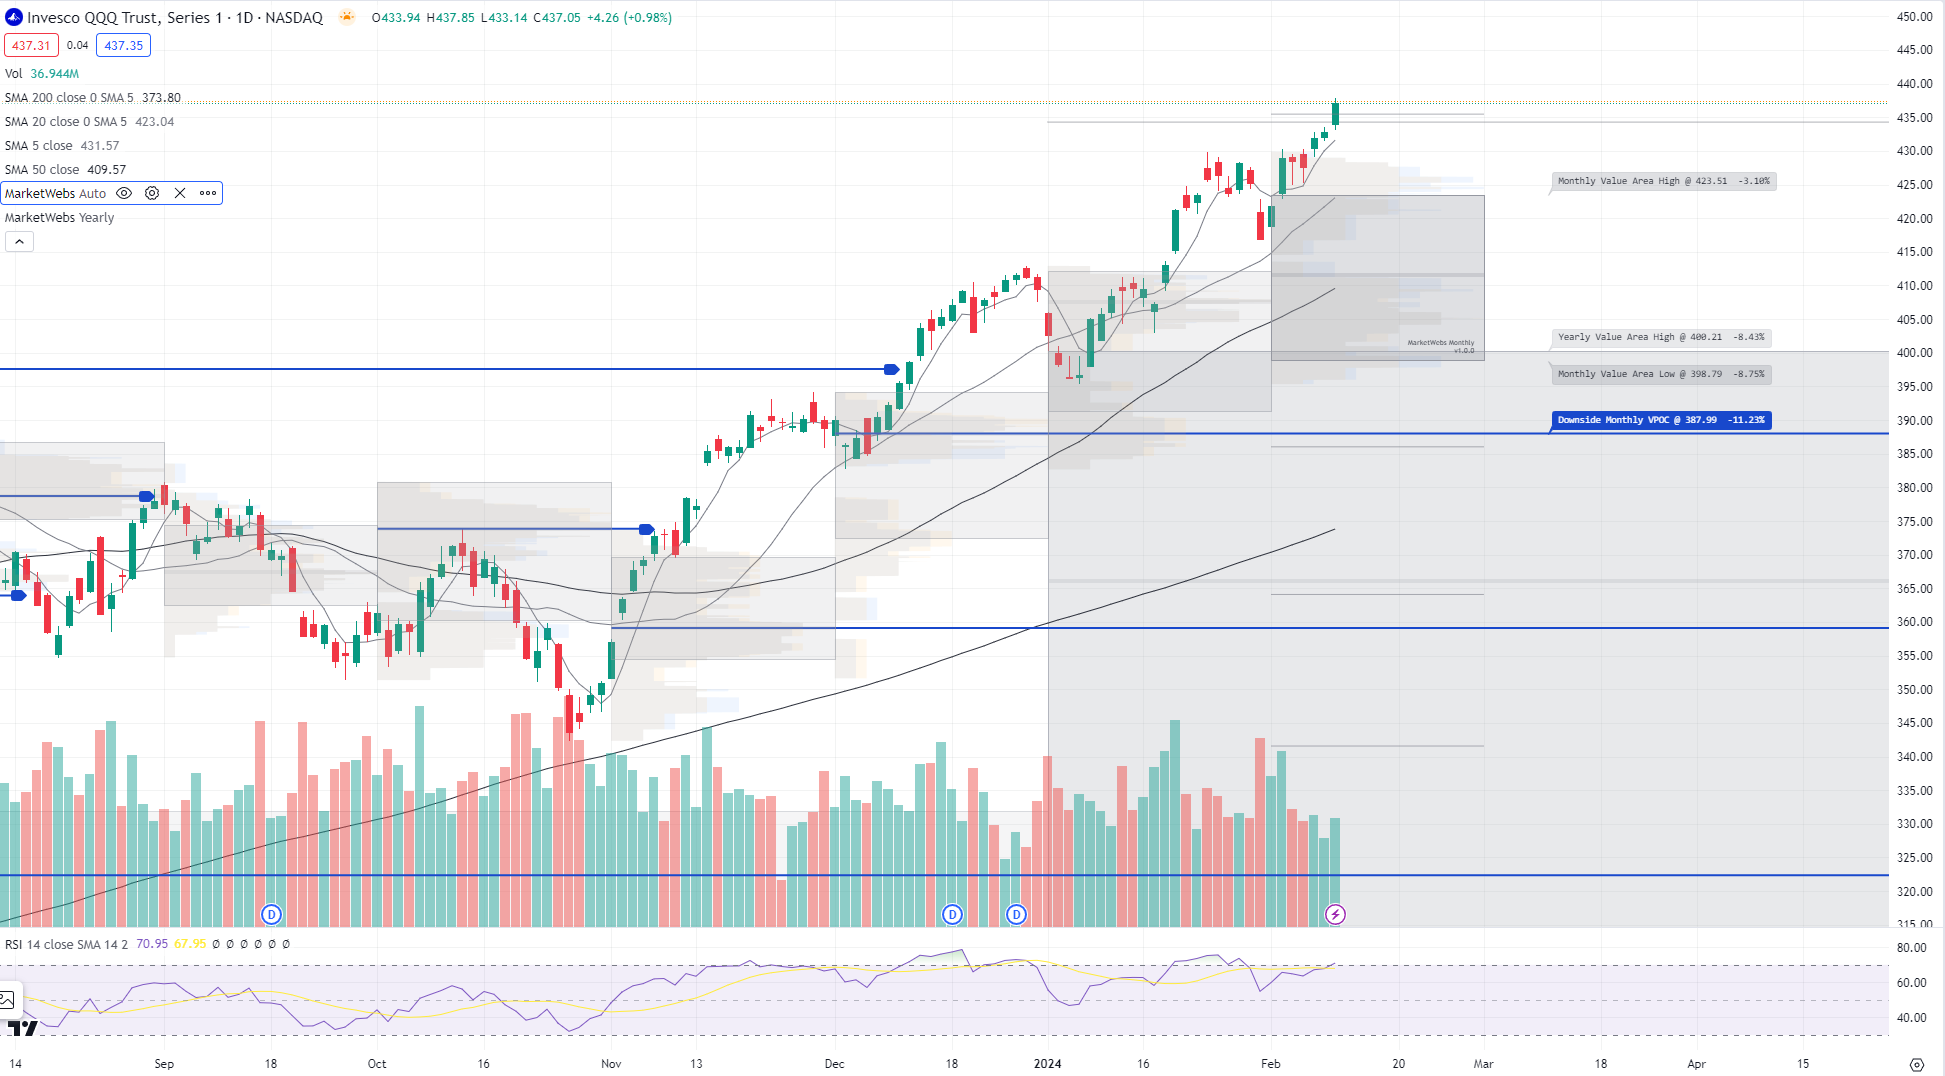
1hr chart: Price starts the week above its new Value Area for the week, support to watch is $433.5
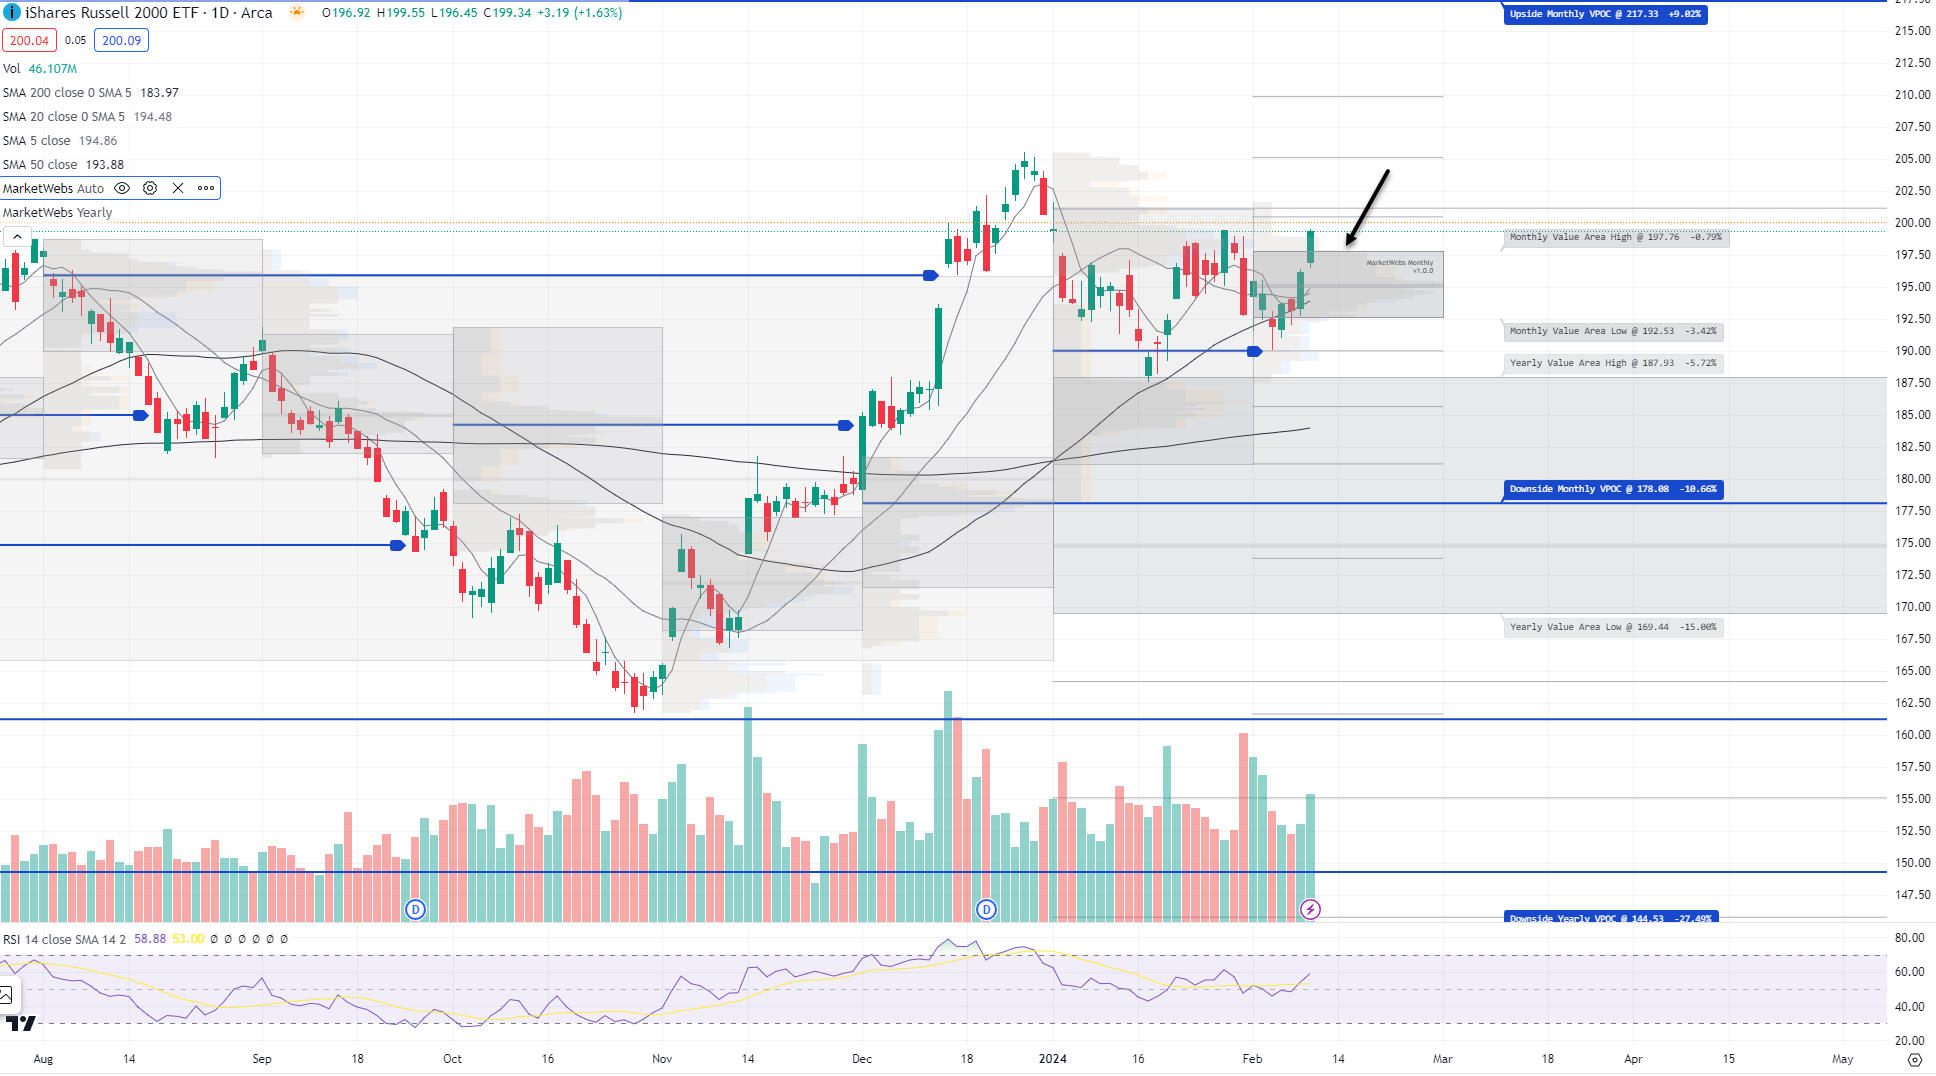
IWM - Russell Small Cap ETF- Price ind +0.3% leading the indices. Note IWM was +2.5% vs SPY +1.4% last week, and made a nice move above its Feb Value Area. Support to watch is now $197.76
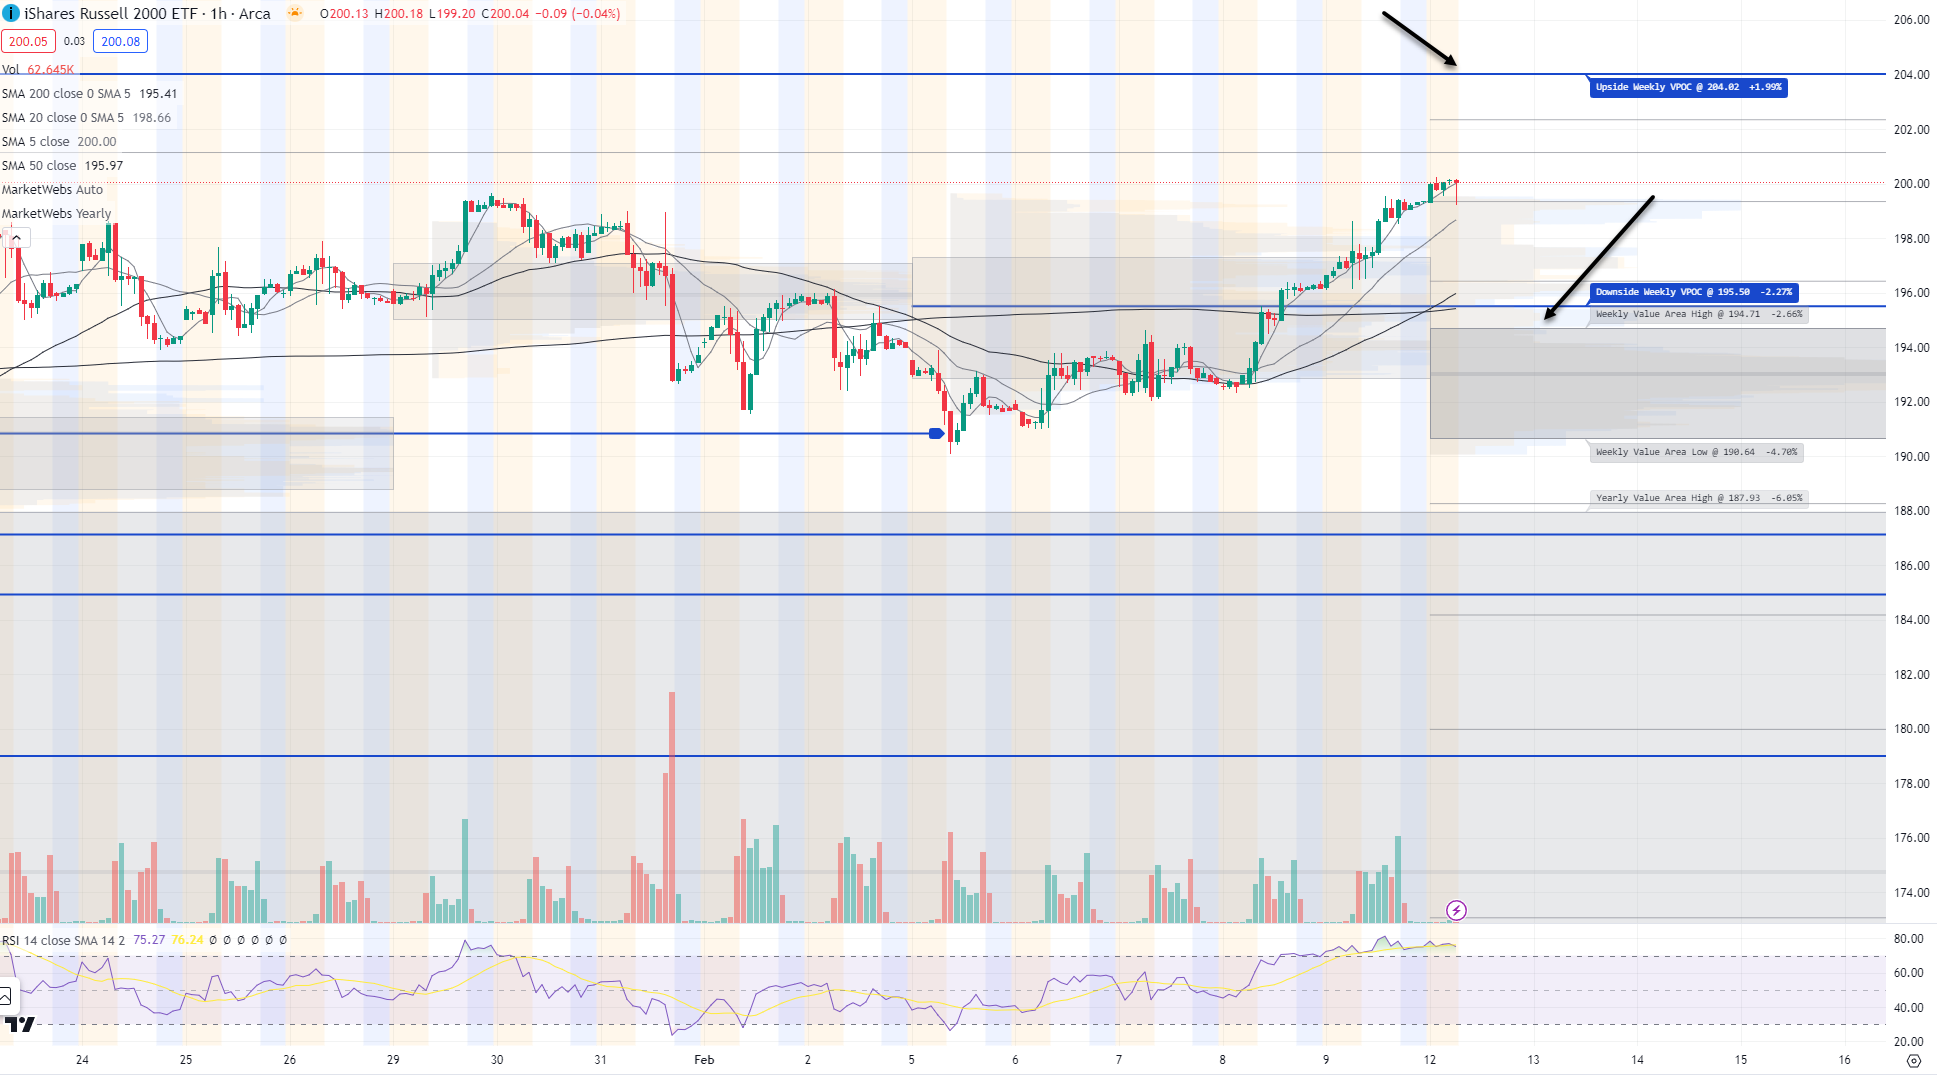
1hr chart: Price starts the week above its Value Area for week, and next upside level to watch is $204 VPOC and support is down at $194.71
Here is today’s TTG Proprietary Stock Screen “Out of the Box” using Volume At Price
names trending above their Value Areas (on 3 multiple timeframes & not super extended)
Keep reading with a 7-day free trial
Subscribe to The Tribeca Trade Group to keep reading this post and get 7 days of free access to the full post archives.