

TTG Index Charts & Out of the Box Stock Screen 01/05/24 $TW
TTG Index Charts & Out of the Box Stock Screen 01/05/24 $TW
Out of the Box MarketWebs Screen
US Dollar +0.3% / 30yr Bonds -0.8% / Crude +1.3% & Nat Gas -2.8% / Gold -0.1% / Copper -0.3% / BTC -0.5%
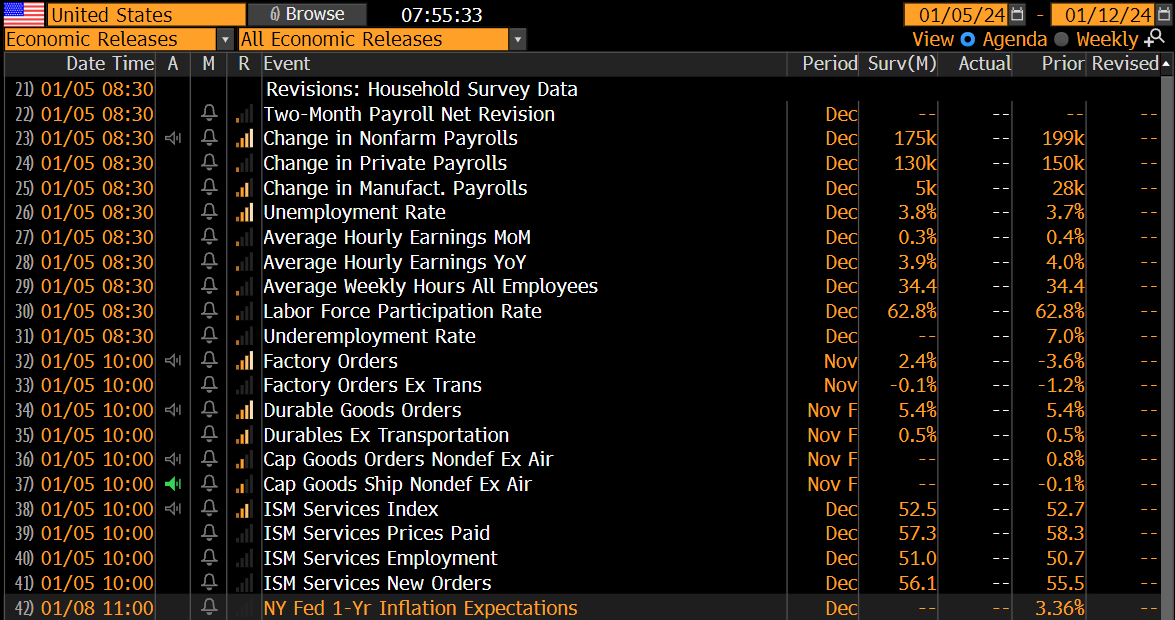
US Upcoming Economics
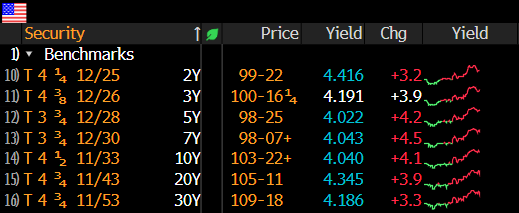
US Bond Yields
Index Updates
At TTG, I use Volume At Price in my chart analysis and I use the MarketWebs Indicator to provide Value Areas & VPOCs which indicate significant support & resistance levels. Learn More Here about Volume At Price and the MarketWebs.
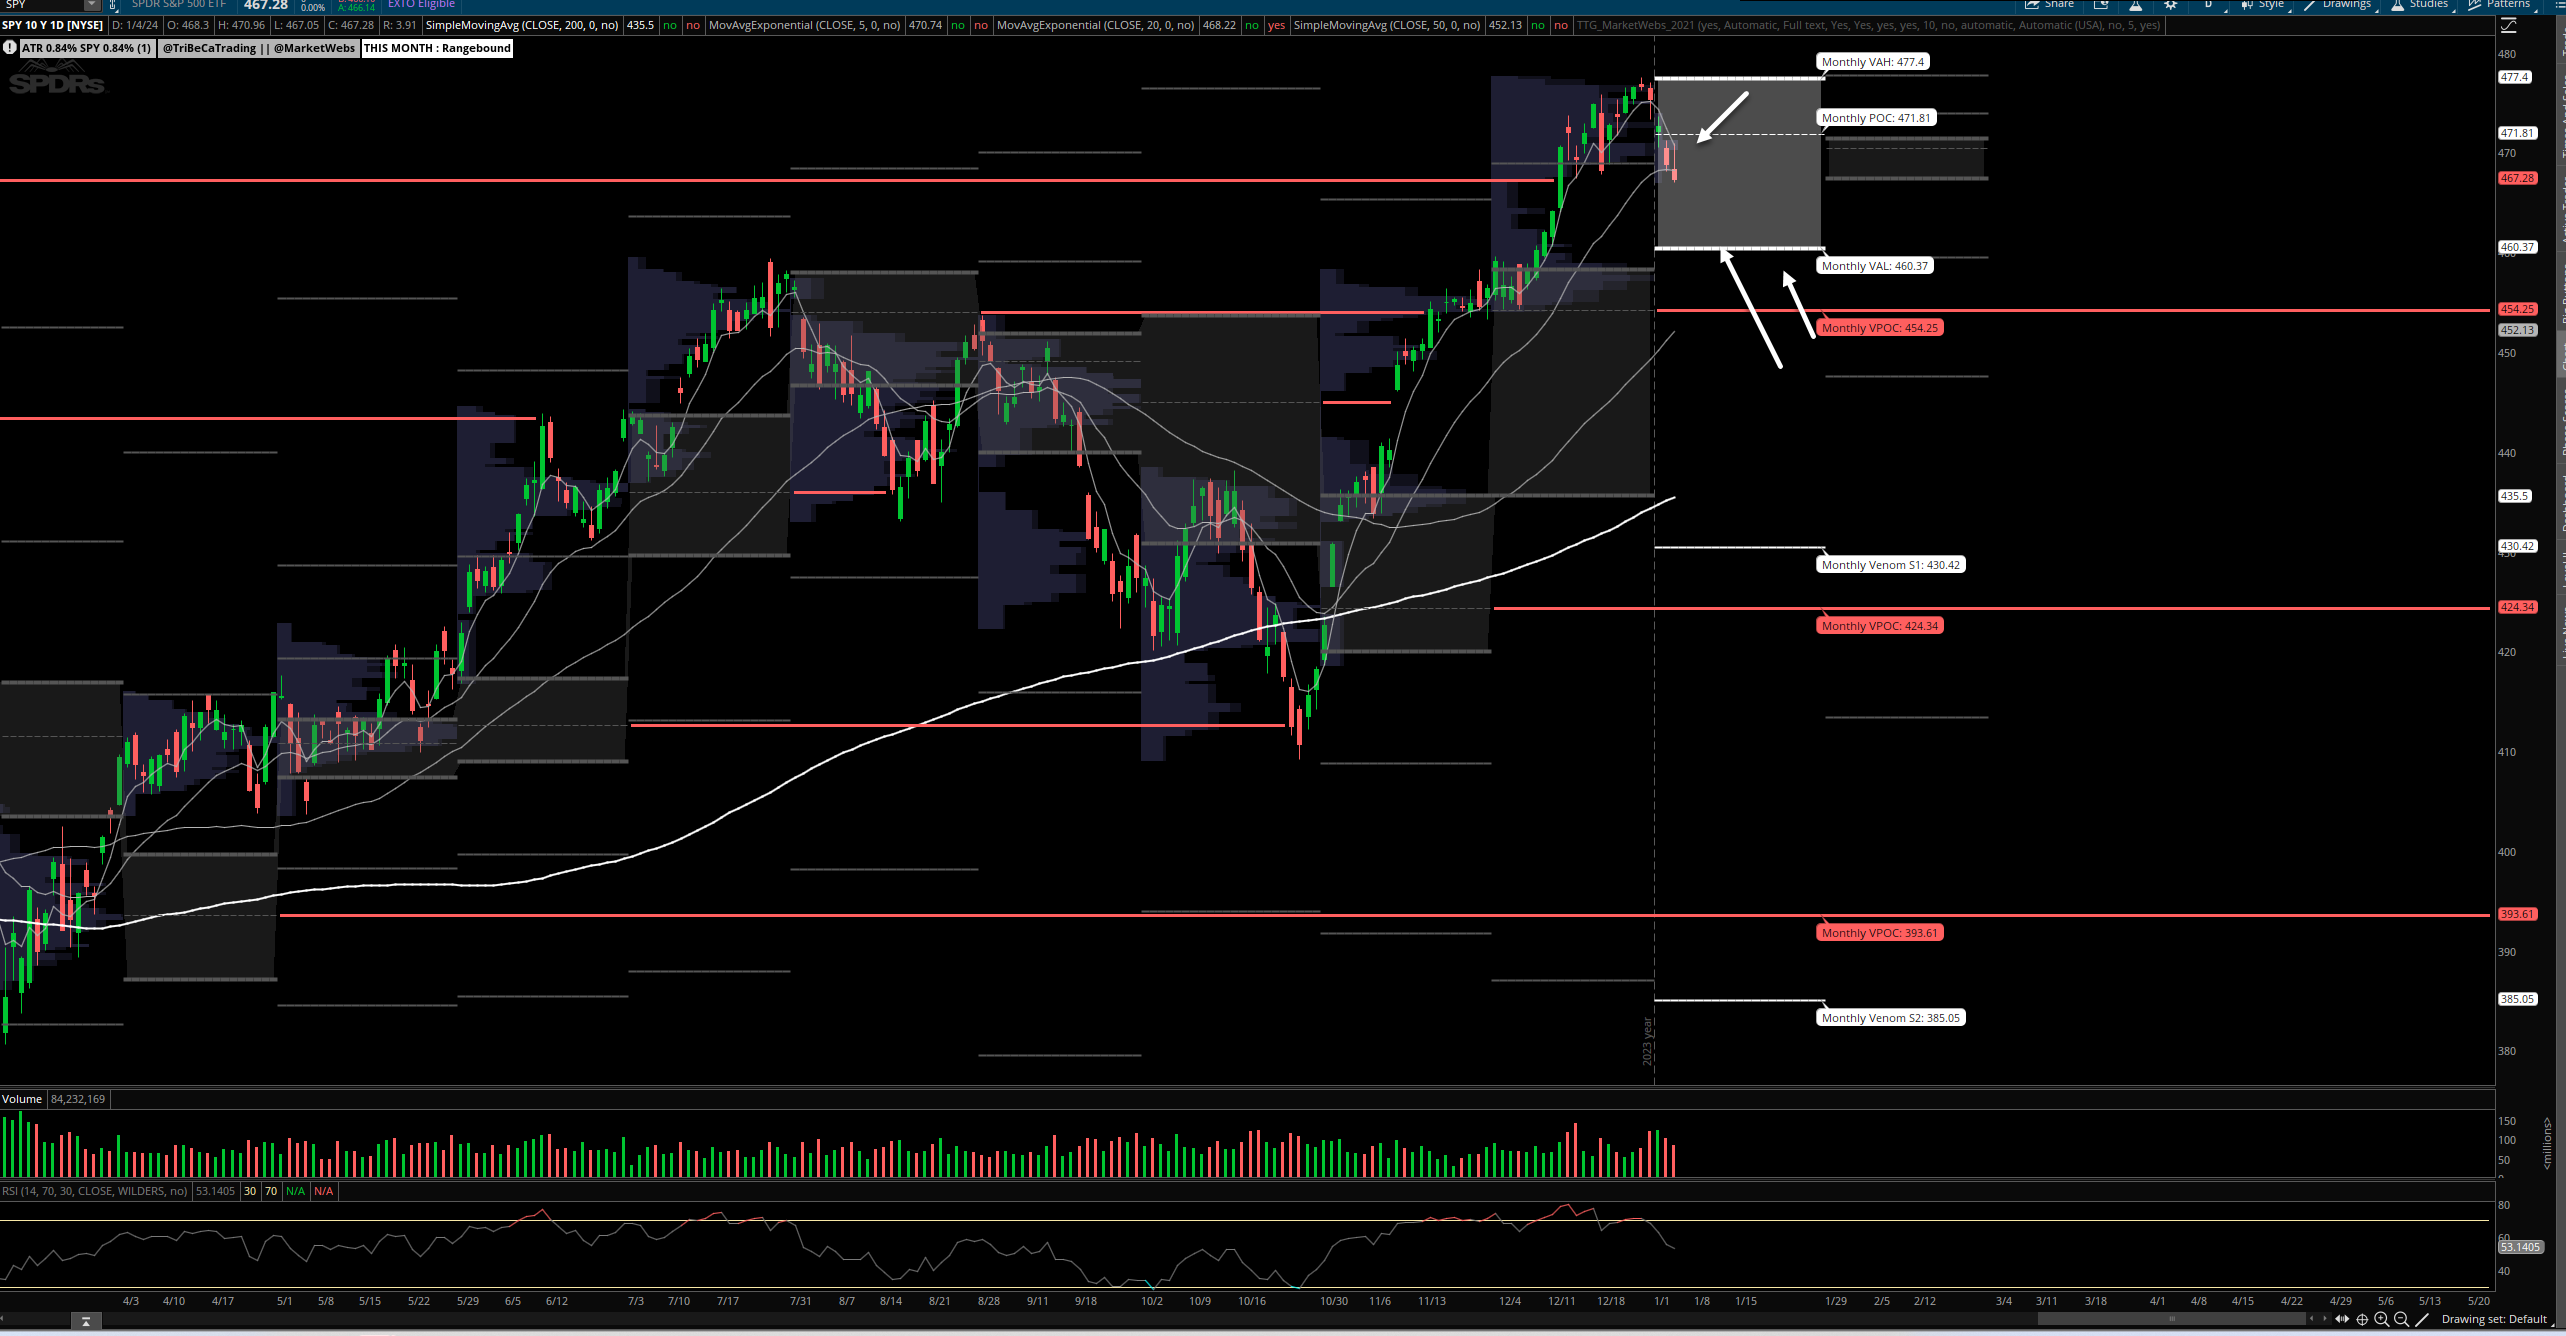
SPY- S&P ETF - Price continues to slip. SPY ind -0.3% ahead of monthly Jobs data and is moving below its 20d MA and towards next support $460.23 bottom of Jan Value Area
Note the Dollar is stronger again along with rates higher indicating “Risk Off” to start the day but we have a big day of economics ahead
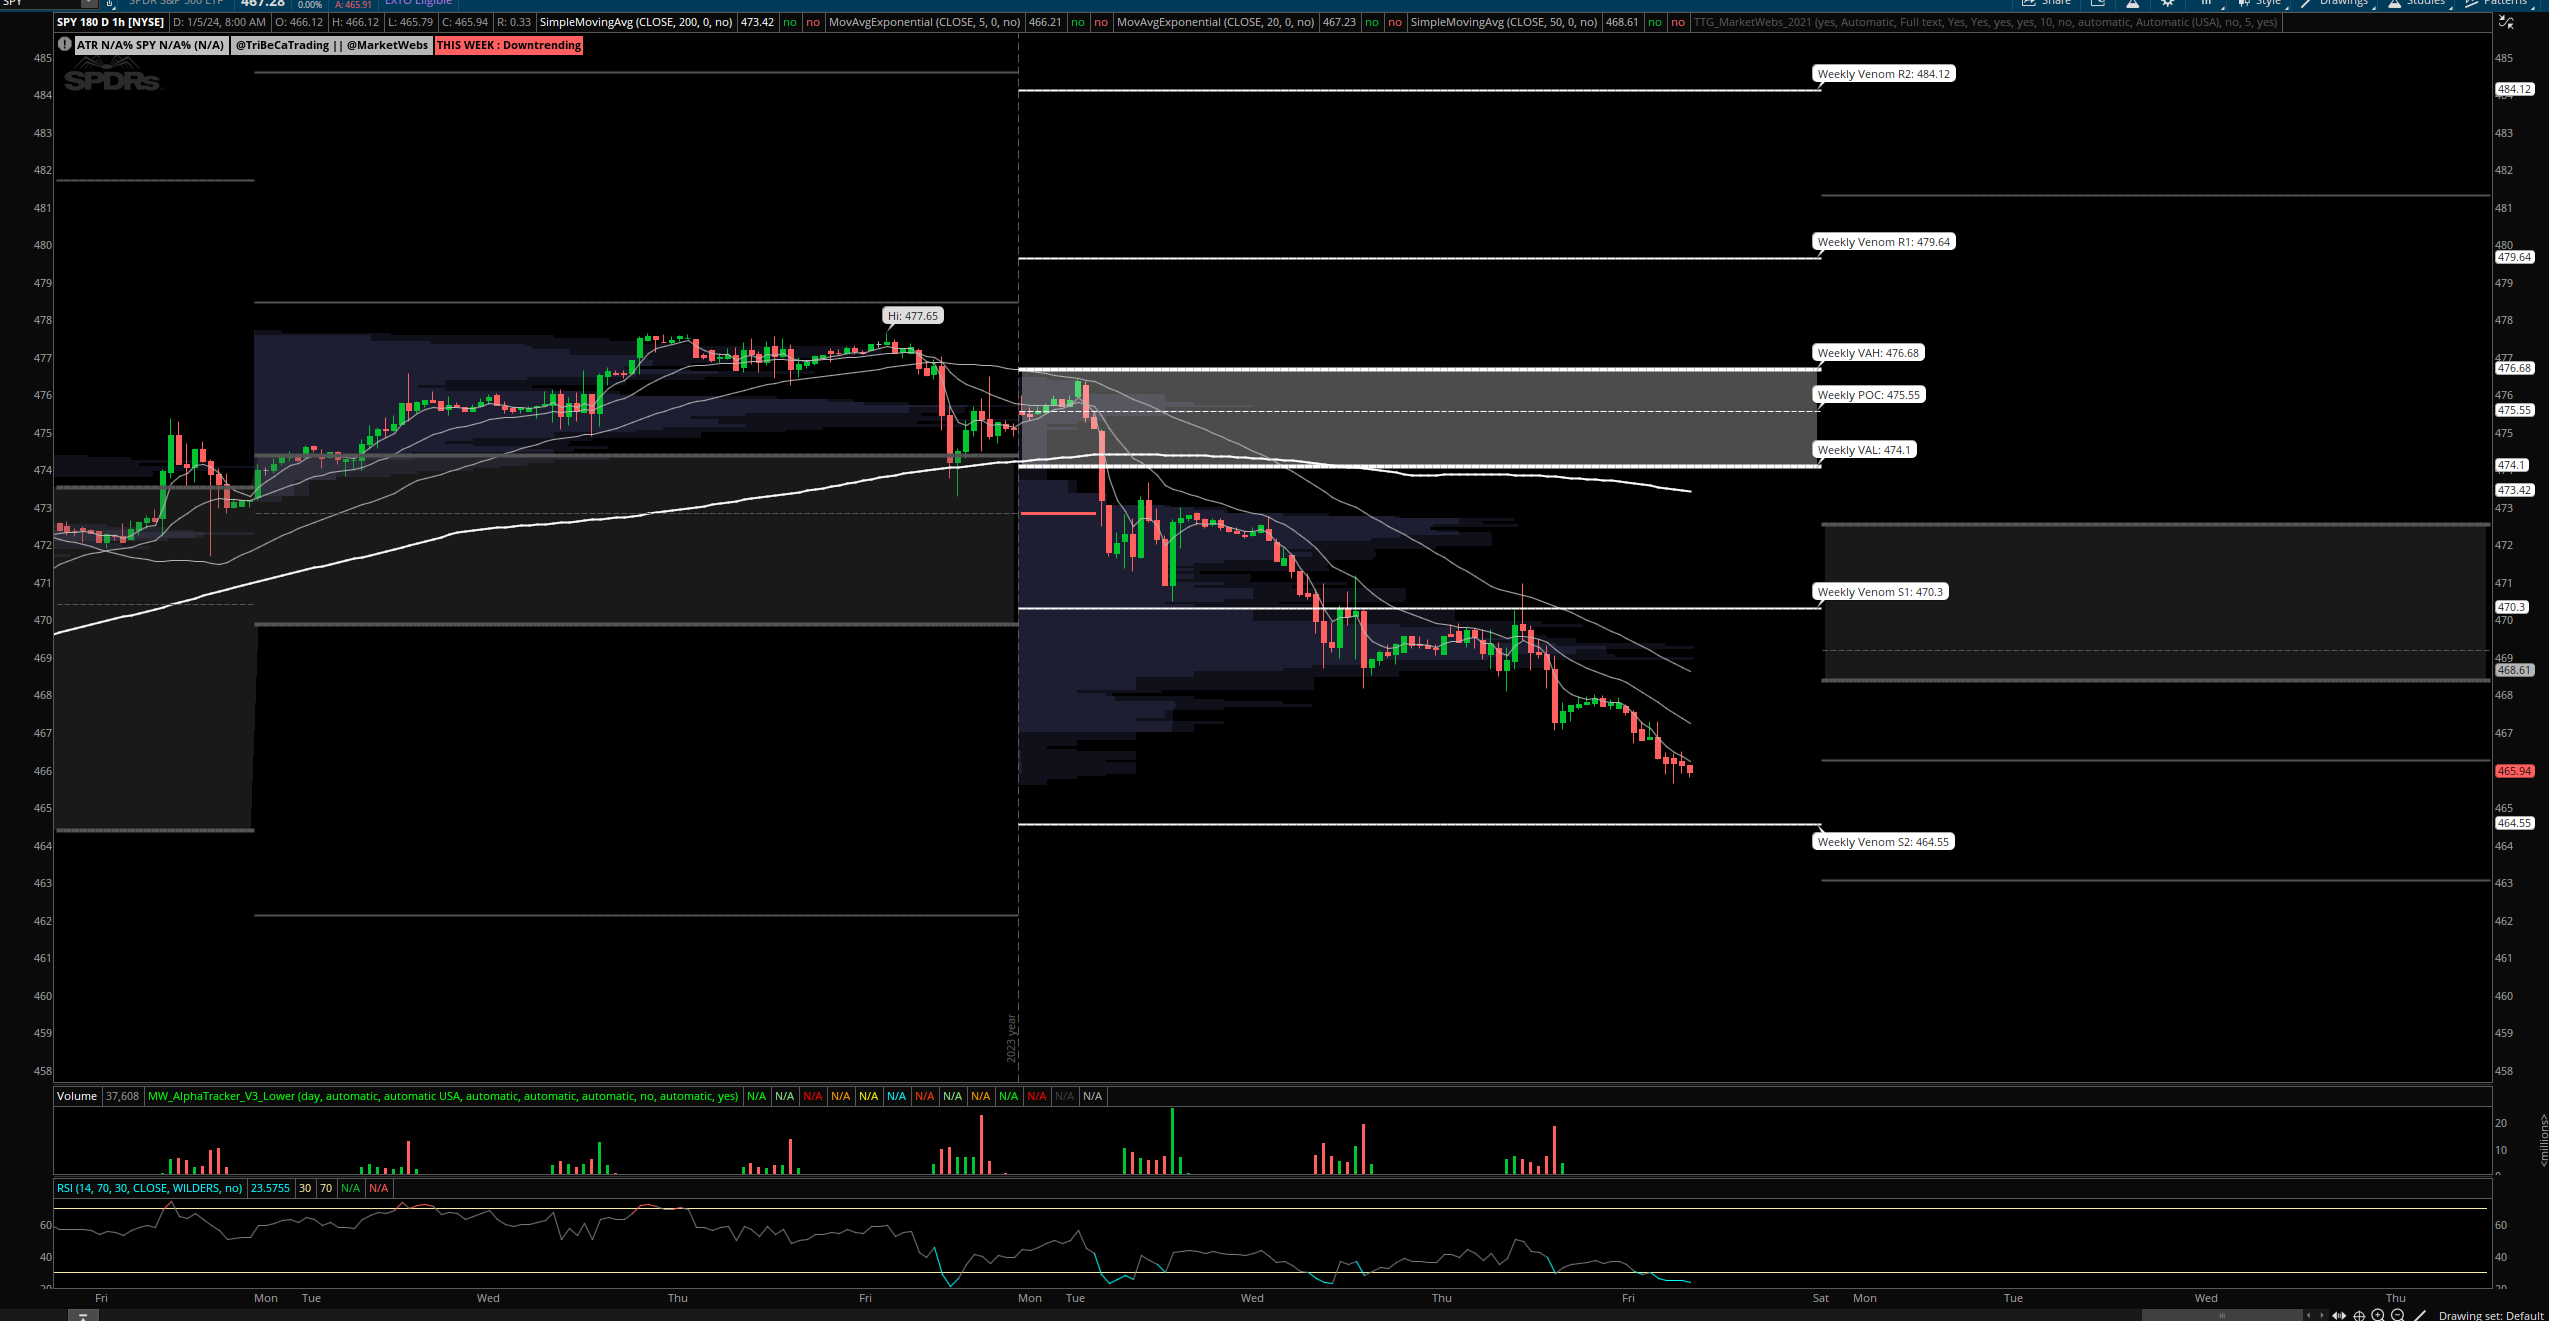
1hr chart: Not much new to report here, price continues to trend lower...
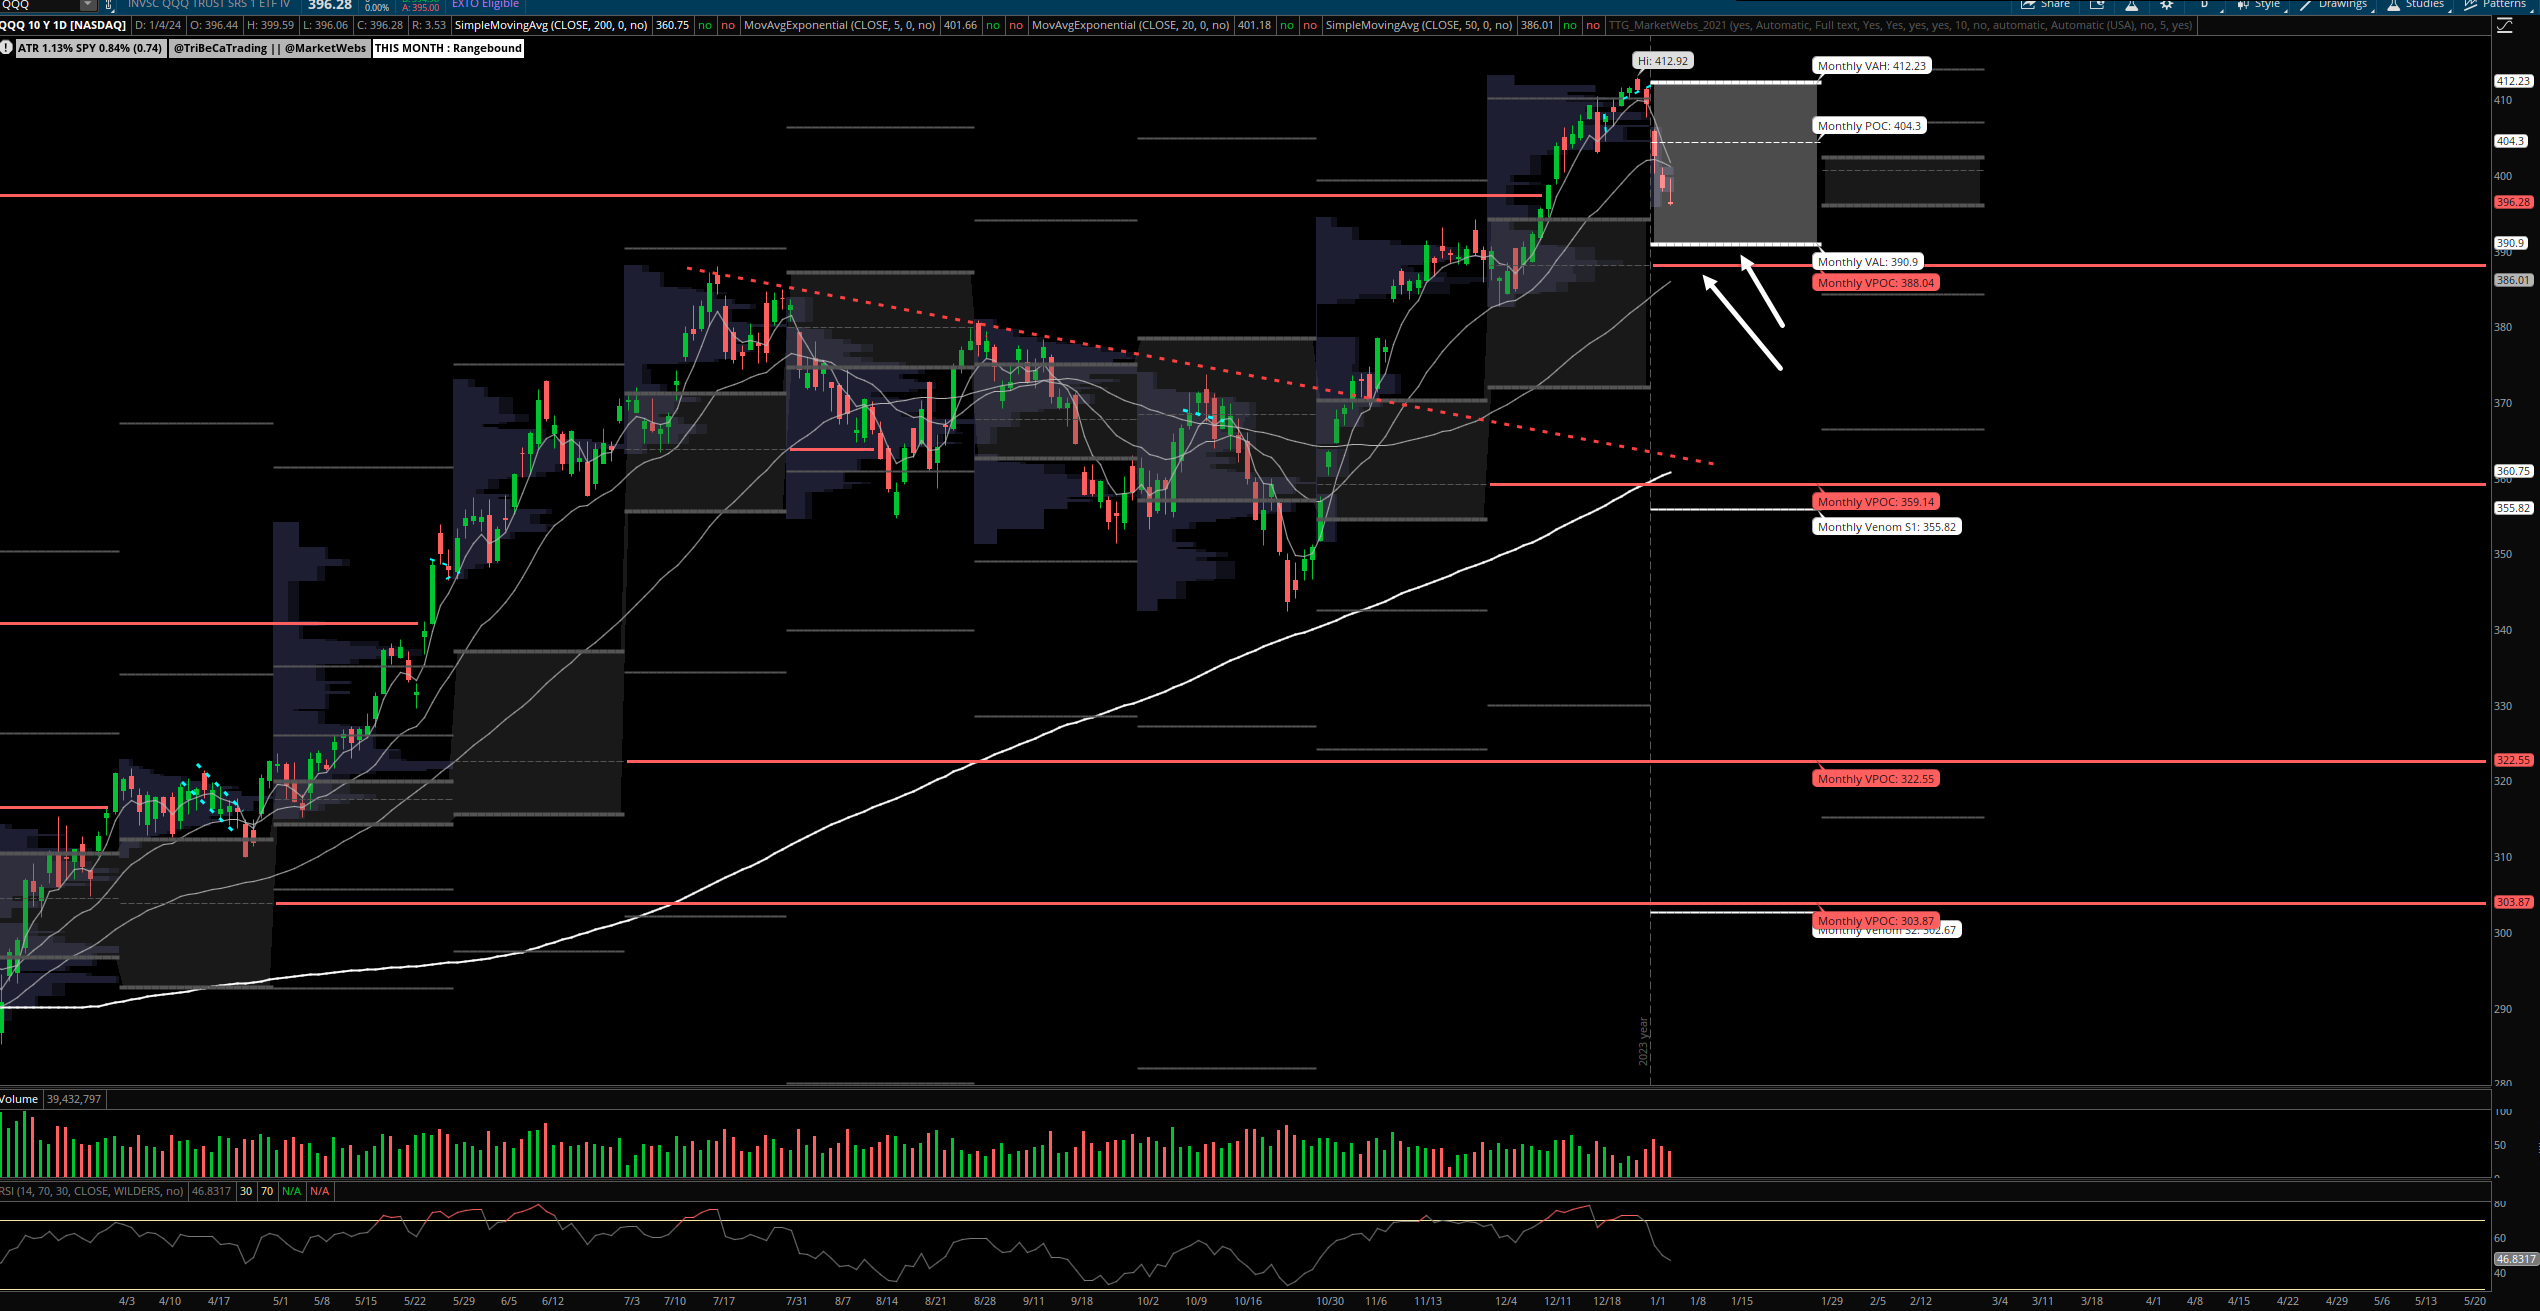
QQQ - NDX 100 ETF - Daily chart: Price also slipping lower this morning and moving towards the bottom of Jan Value Area $390.9 & VPOC (red line) $388.04 which ultimately could be where we see some price stability
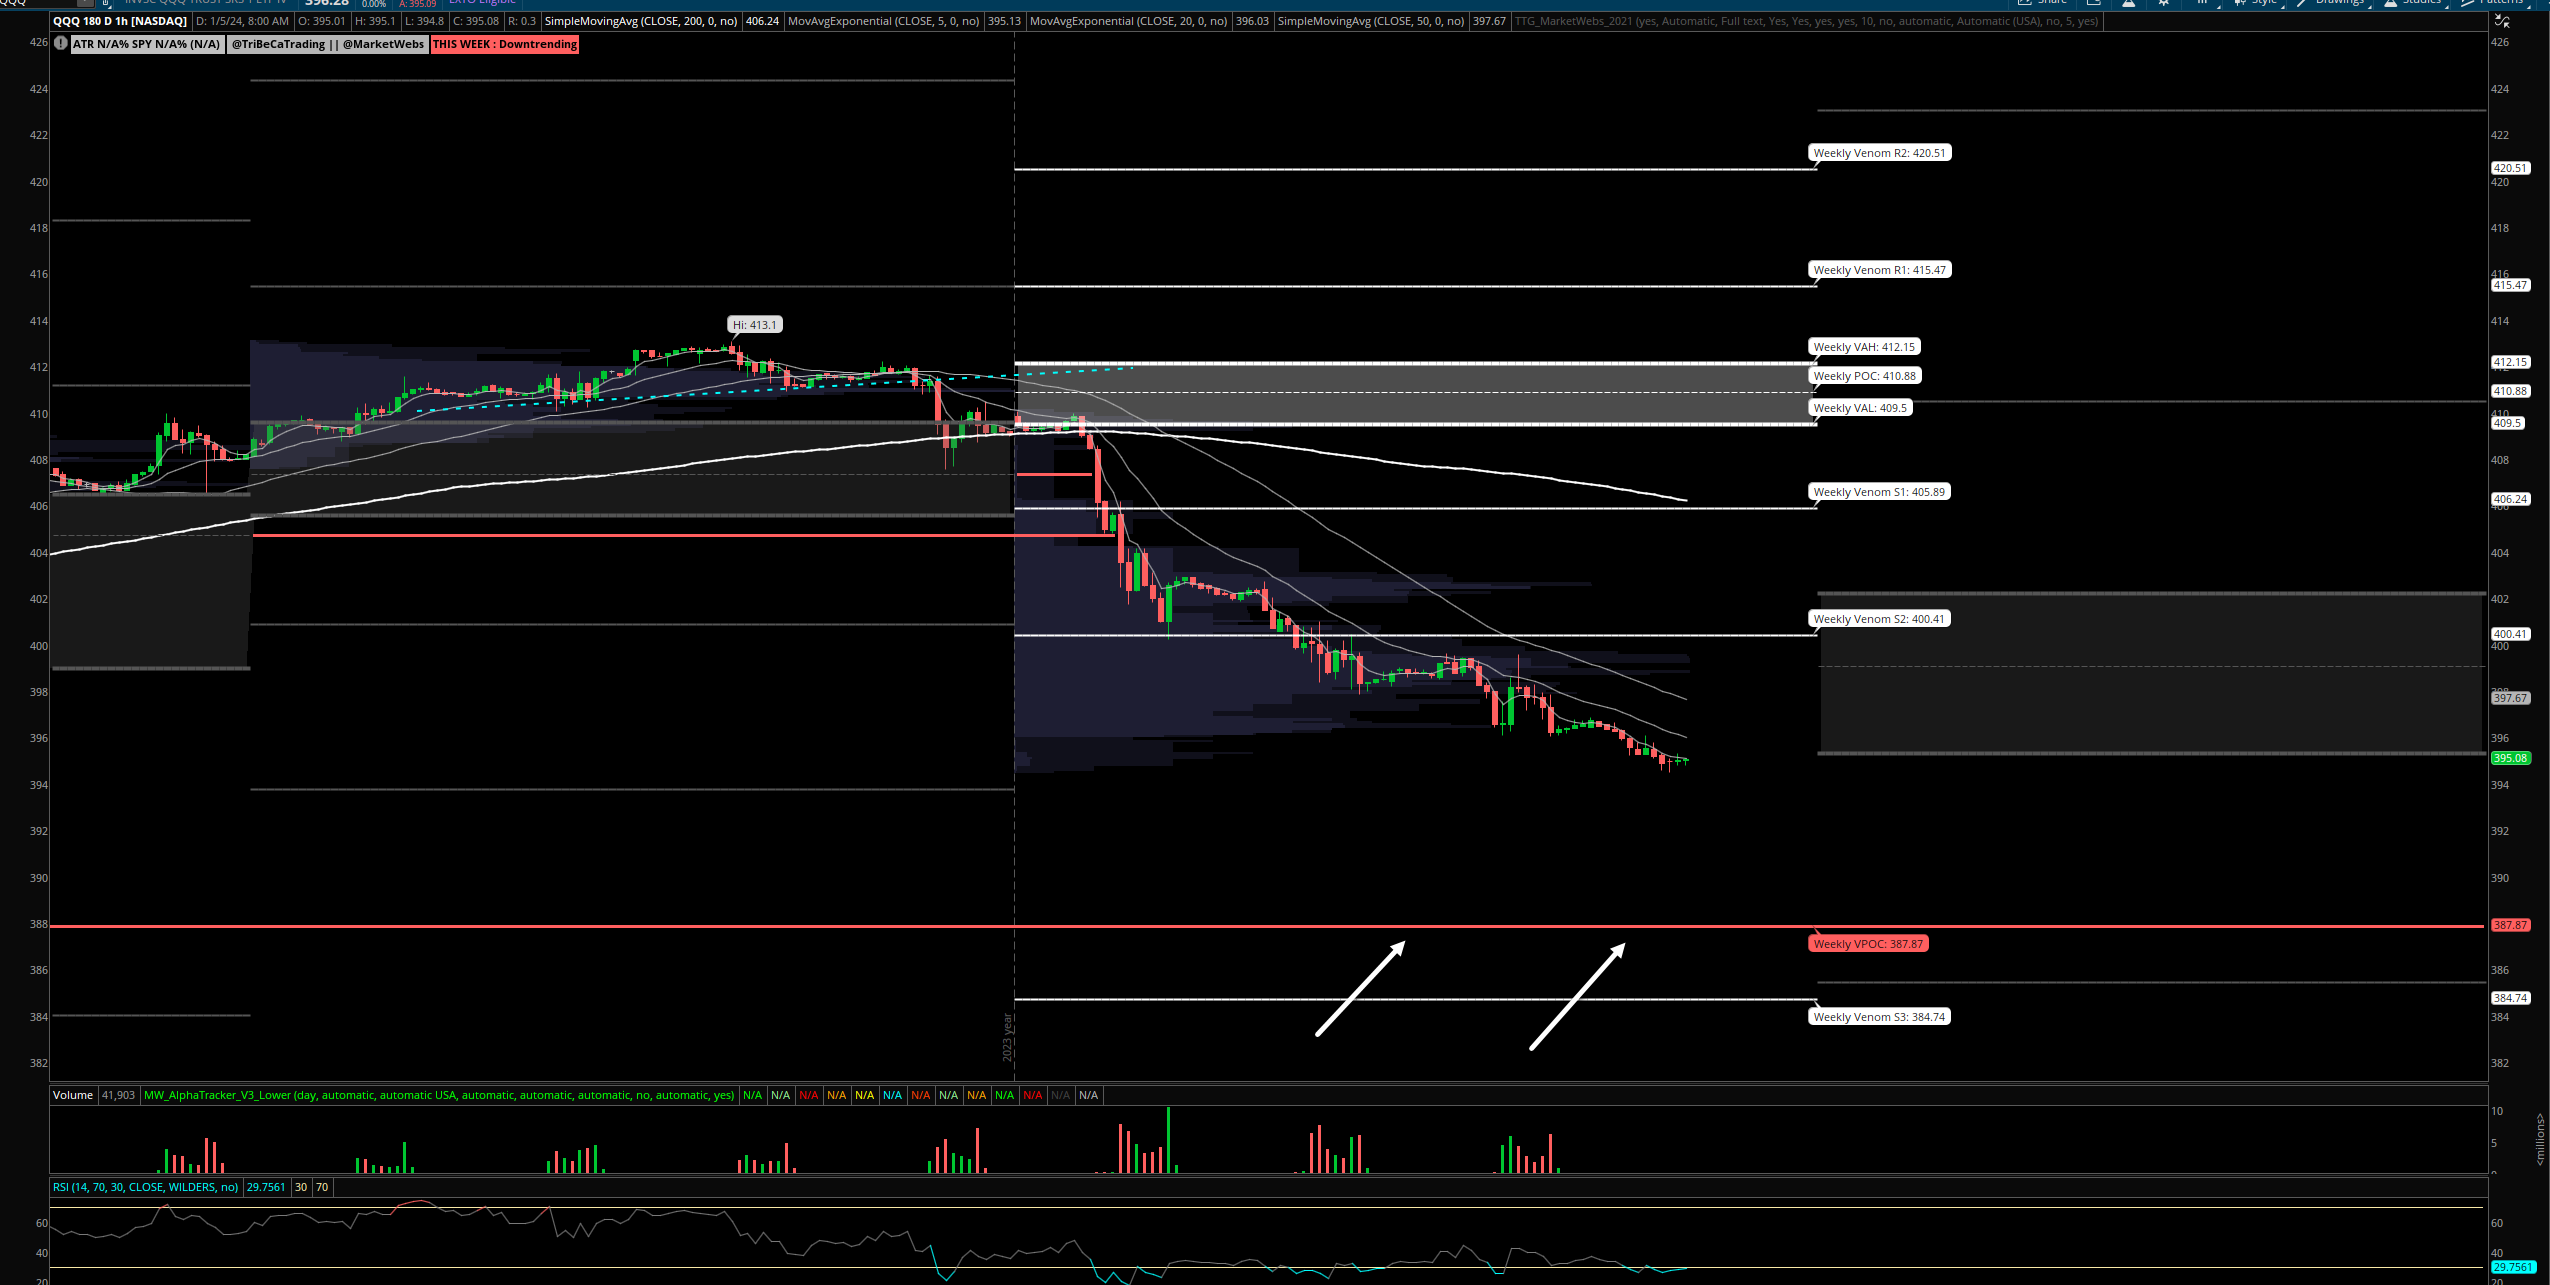
1hr chart: Price continues to trend lower with no major support nearby - until VPOC $387.87
IWM - Russell Small Cap ETF- Daily Chart: Price ind -0.5% and there is now a gap fill , note not much support nearby, will have to see if jobs report provides some change in direction

1hr chart: Similar to other indices price continues to trend lower

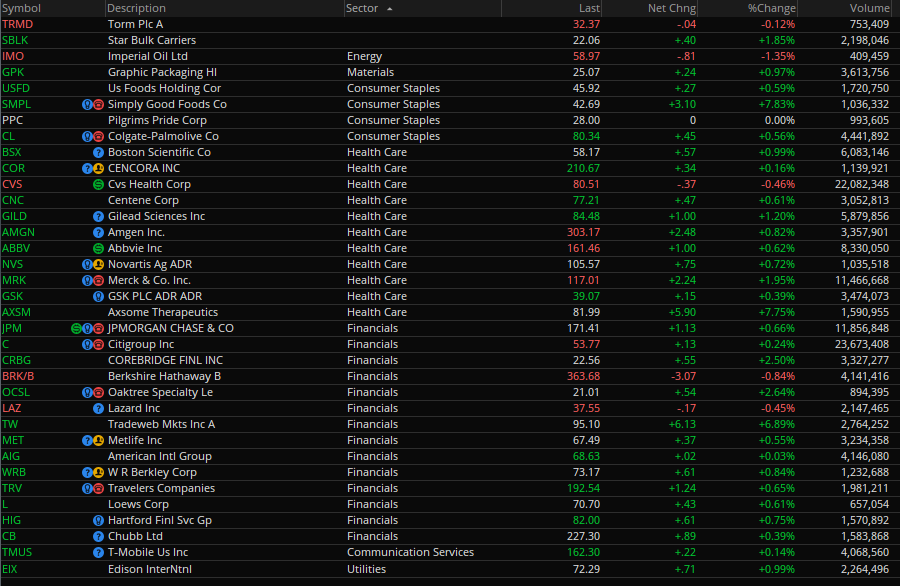
Here is today’s TTG Proprietary Stock Screen “Out of the Box” using Volume At Price
names trending above their Value Areas (on 3 multiple timeframes & not super extended)
Keep reading with a 7-day free trial
Subscribe to The Tribeca Trade Group to keep reading this post and get 7 days of free access to the full post archives.