

TTG Index Charts & Out of the Box Stock Screen 7/25/24
TTG Index Charts & Out of the Box Stock Screen 7/25/24
Out of the Box MarketWebs Screen
US Dollar -0.1% / 30yr Bonds +0.9% / Crude -1.9% & Nat Gas -0.2% / Gold -2.0% / Copper -0.9% / BTC -2.3%
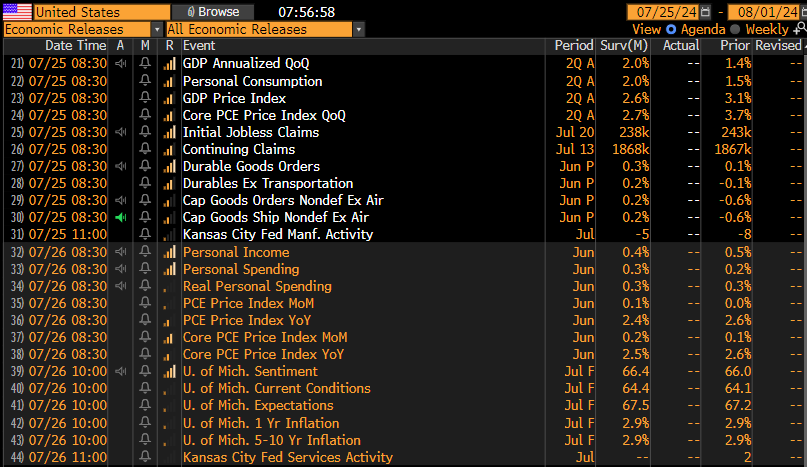
US Upcoming Economics
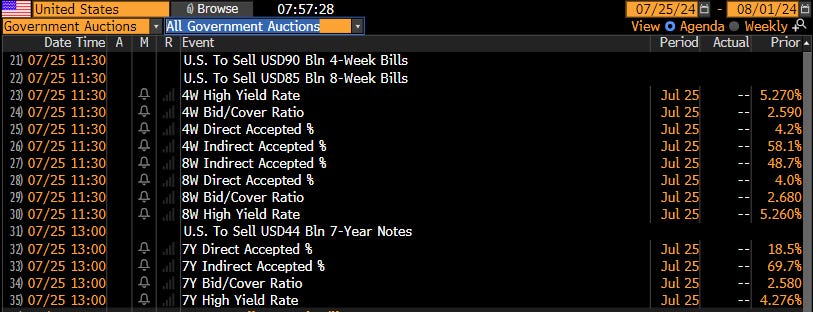
Bond Auctions
Index Updates
At TTG, I use Volume At Price in my chart analysis and I use the MarketWebs Indicator to provide Value Areas & VPOCs which indicate significant support & resistance levels. Learn More Here about Volume At Price and the MarketWebs.

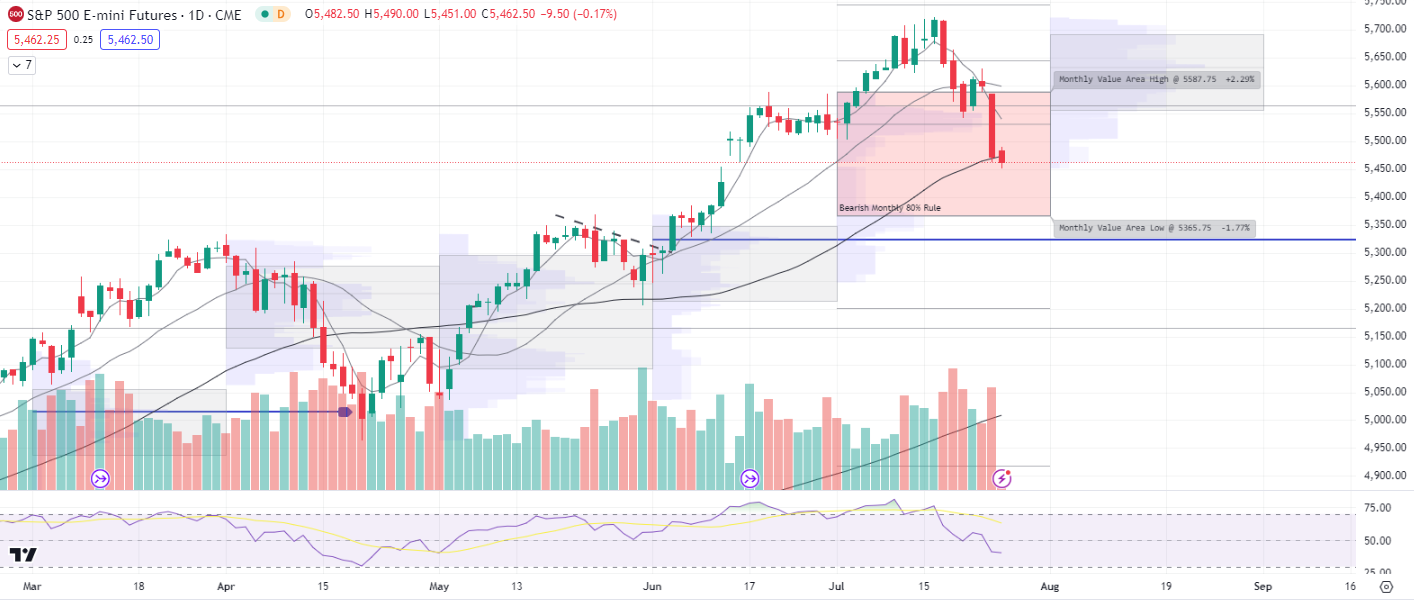
ES_F - SPX Futures - Daily chart: Prices continuing to trend lower this morning -0.3% after a big down day yesterday, SPY -2.3%. Price is now deep into its July Value Area and the #bearish 80% rule is in effect looking for a move down to the bottom of the July Value Area, 5365.75. Also, note, price is below its 50d MA
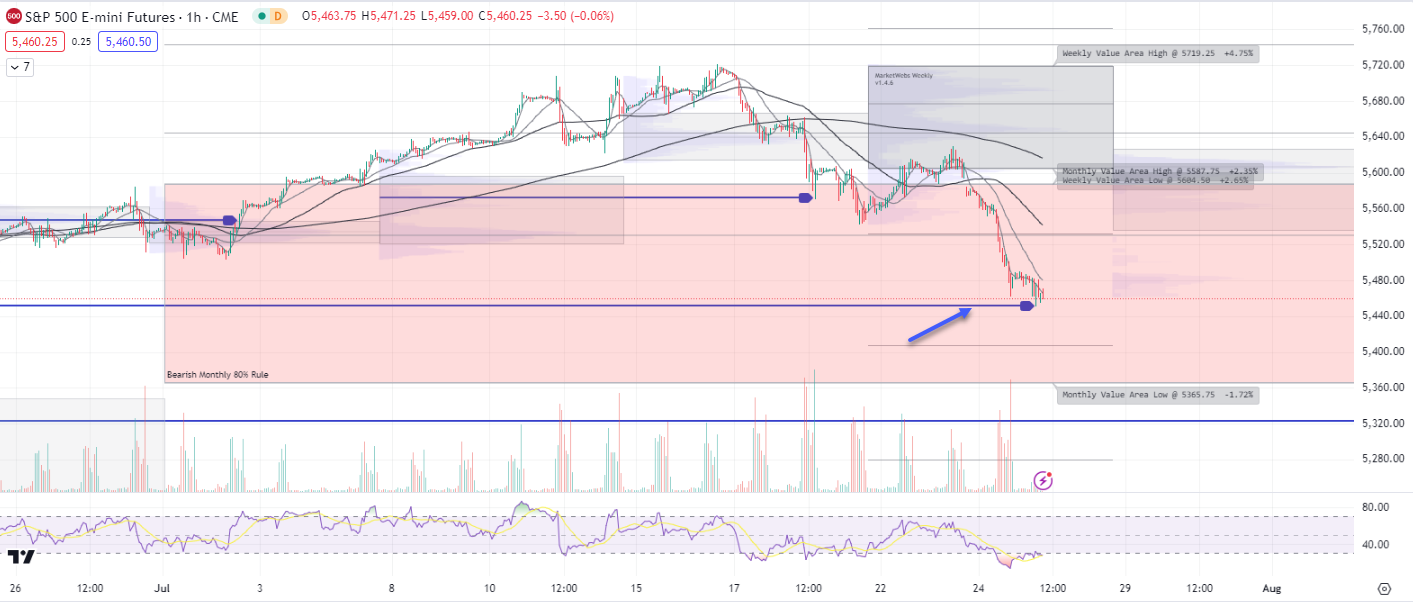
1hr chart: Price took out a downside VPOC (blue line), possible short-term bounce area
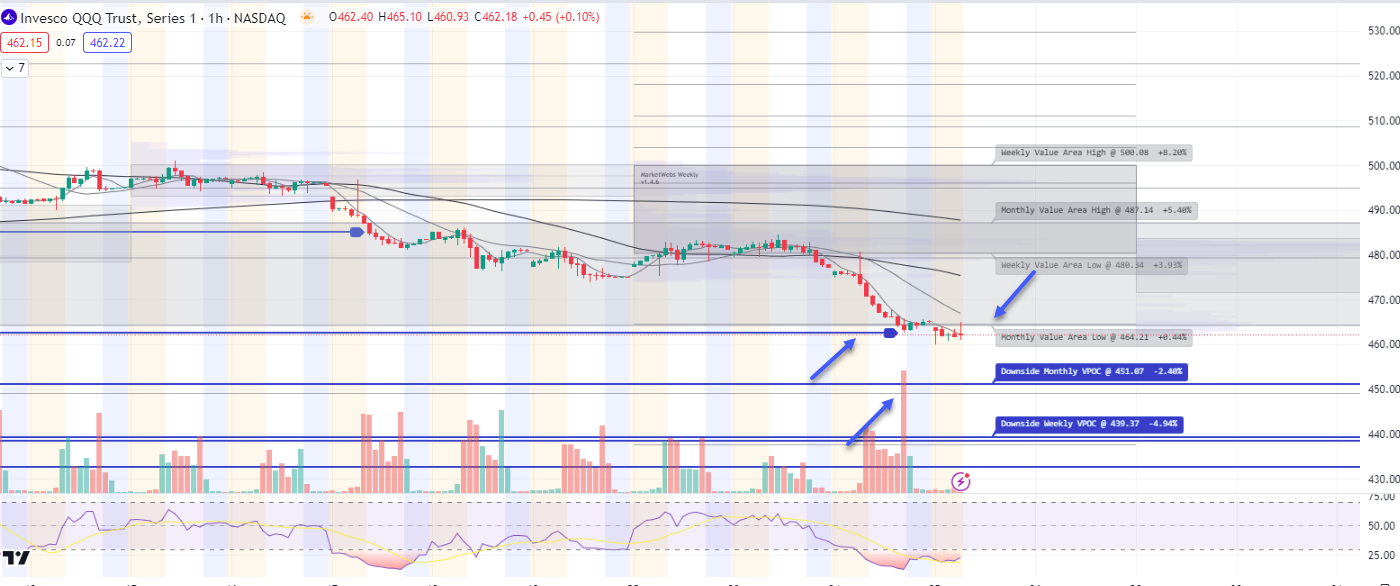
QQQ - NDX 100 ETF - Daily chart: Price completed the #bearish 80% rule yesterday and now down to the bottom of the July Value Area, watch $464.25 and if this does not hold today, then next lower level is $451.5 VPOC

1hr chart: Price took out a downside VPOC which is a possible bounce area, if that does not hold watch next blue line down (VPOC)
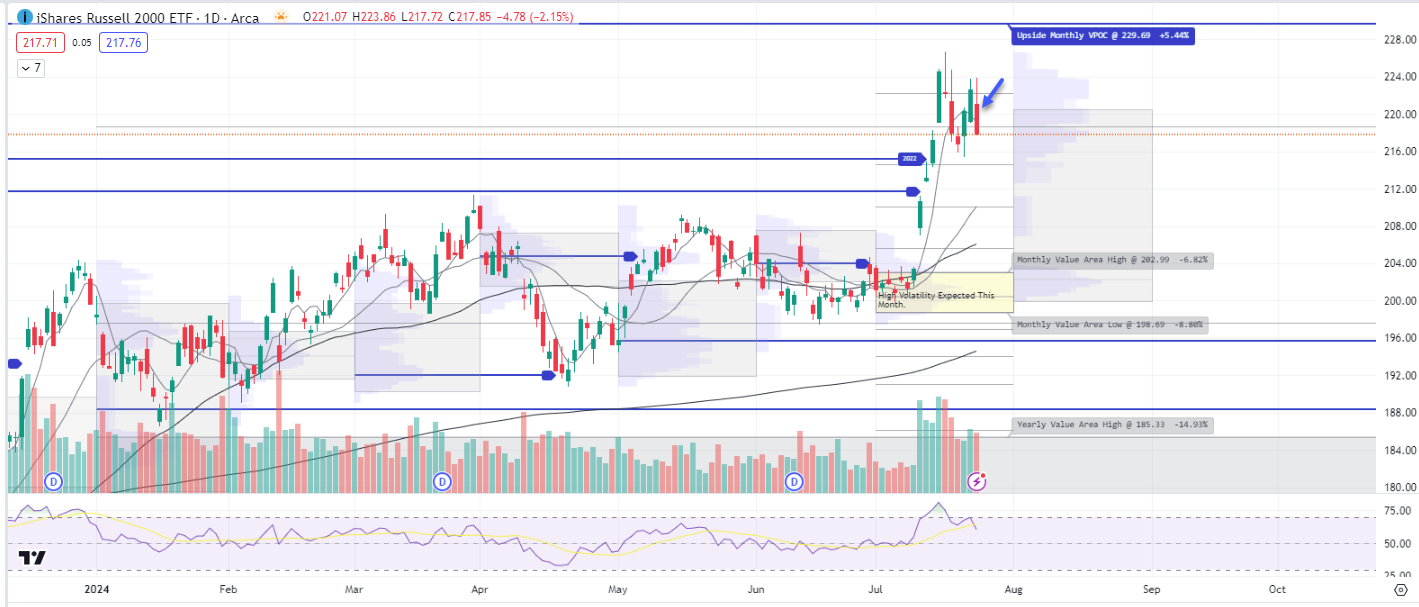
IWM - Russell Small Cap ETF- Daily Chart: Small Caps succumbed to the overall market volatility yesterday, -2.2% and slipped back below its 5d MA. That continues to be an area to watch in the move higher over last 2 weeks.
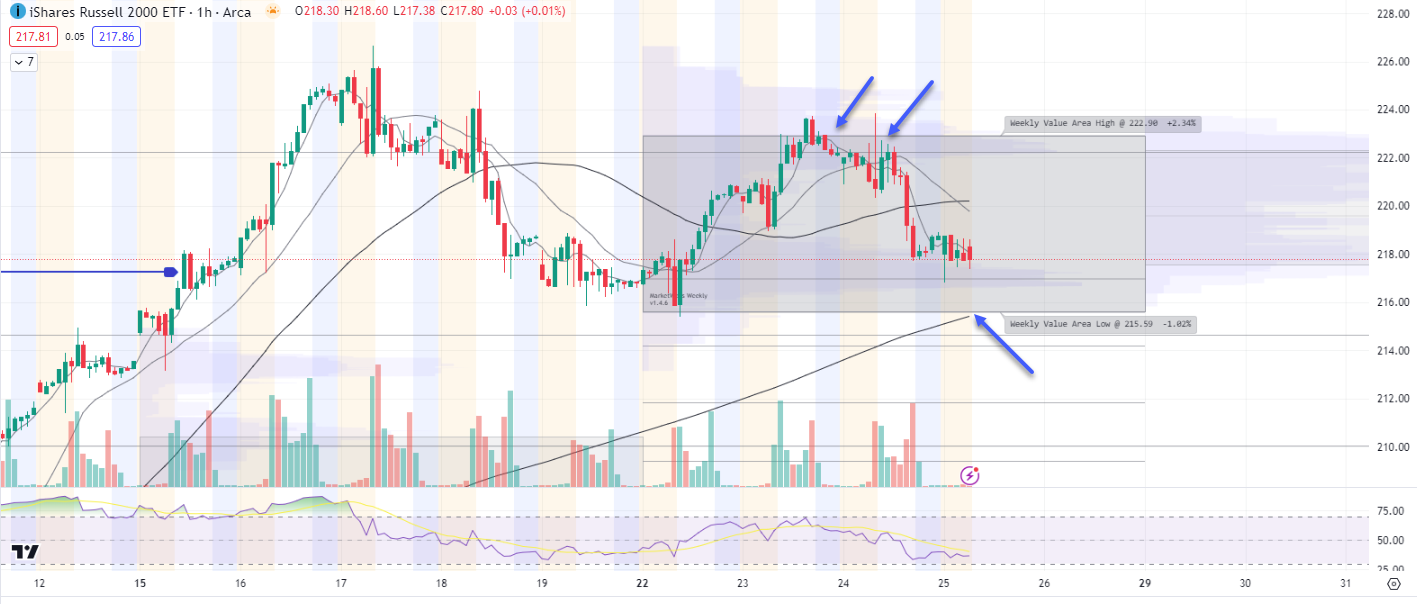
IWM 1hr chart: Price got rejected at the top of this week's Value Area, $229.90 resistance , support is $215.59
Here is today’s TTG Proprietary Stock Screen “Out of the Box” using Volume At Price
names trending above their Value Areas (on 3 multiple timeframes & not super extended)
Keep reading with a 7-day free trial
Subscribe to The Tribeca Trade Group to keep reading this post and get 7 days of free access to the full post archives.