

TTG Index Charts & Out of the Box Stock Screen 01/24/24 $BRK/B $ENTG
TTG Index Charts & Out of the Box Stock Screen 01/24/24 $BRK/B $ENTG
Out of the Box MarketWebs Screen
US Dollar -0.6 / 30yr Bonds +0.6% / Crude +2.3% & Nat Gas +2.0% / Gold +0.5% / Copper +0.8% / BTC +2.1%
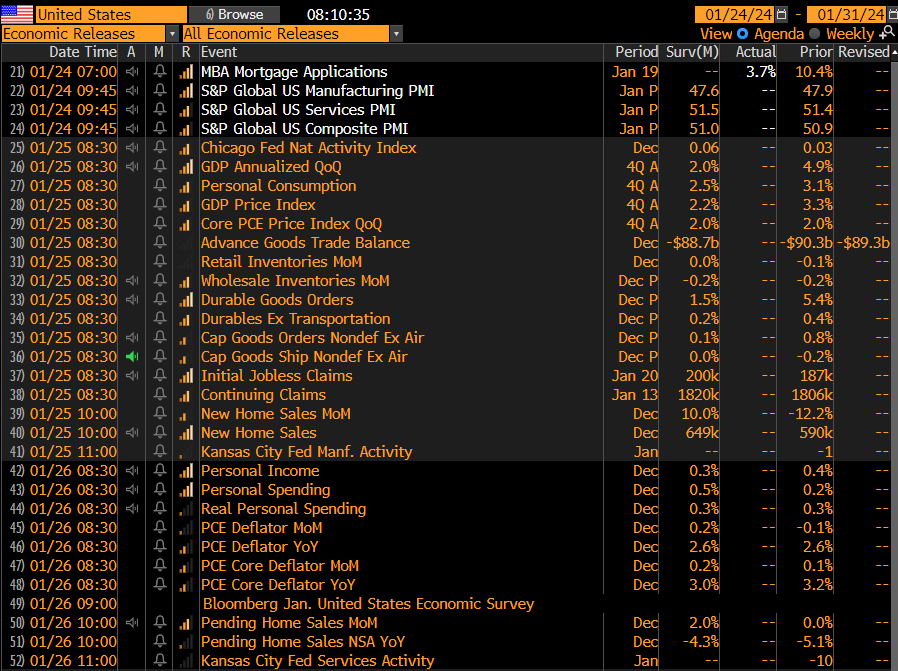
US Upcoming Economics
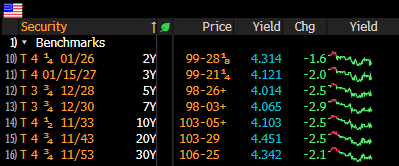
US Bond Yields
Index Updates
At TTG, I use Volume At Price in my chart analysis and I use the MarketWebs Indicator to provide Value Areas & VPOCs which indicate significant support & resistance levels. Learn More Here about Volume At Price and the MarketWebs.
$ES_F- S&P Futures - Price continuing to trend above its Jan Value Area support remains 4841 top of Value Area
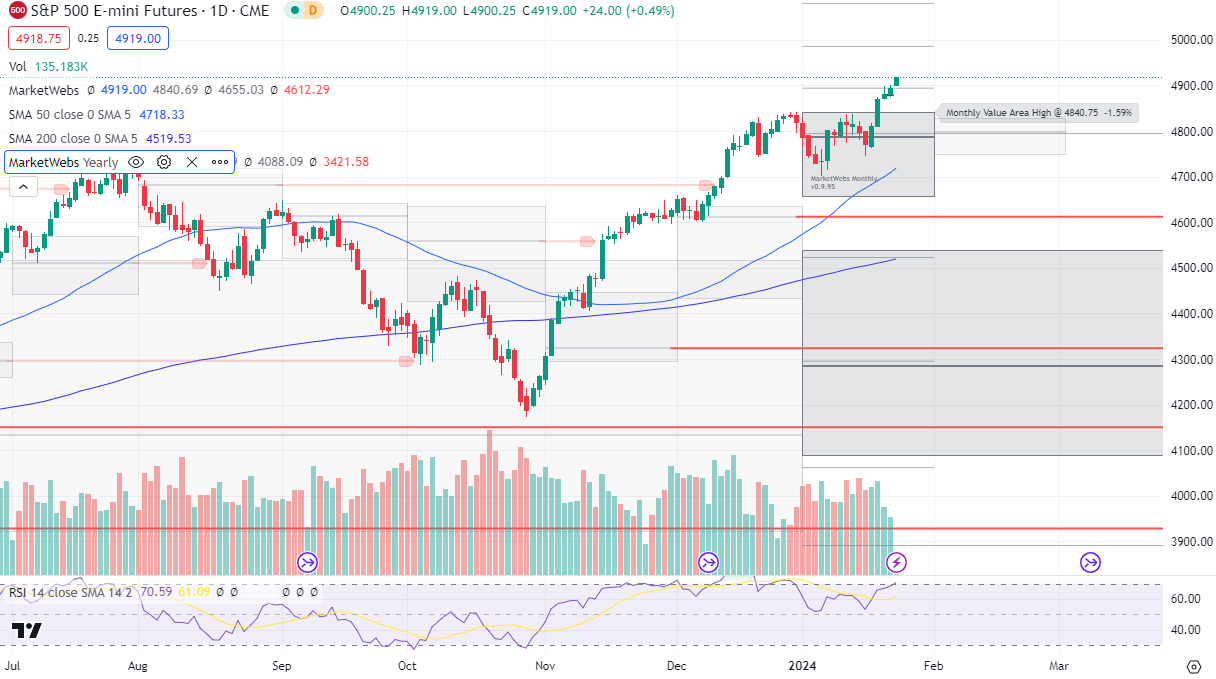
1hr chart: After some sideways consolidation, price has resolved higher and resuming to trend +

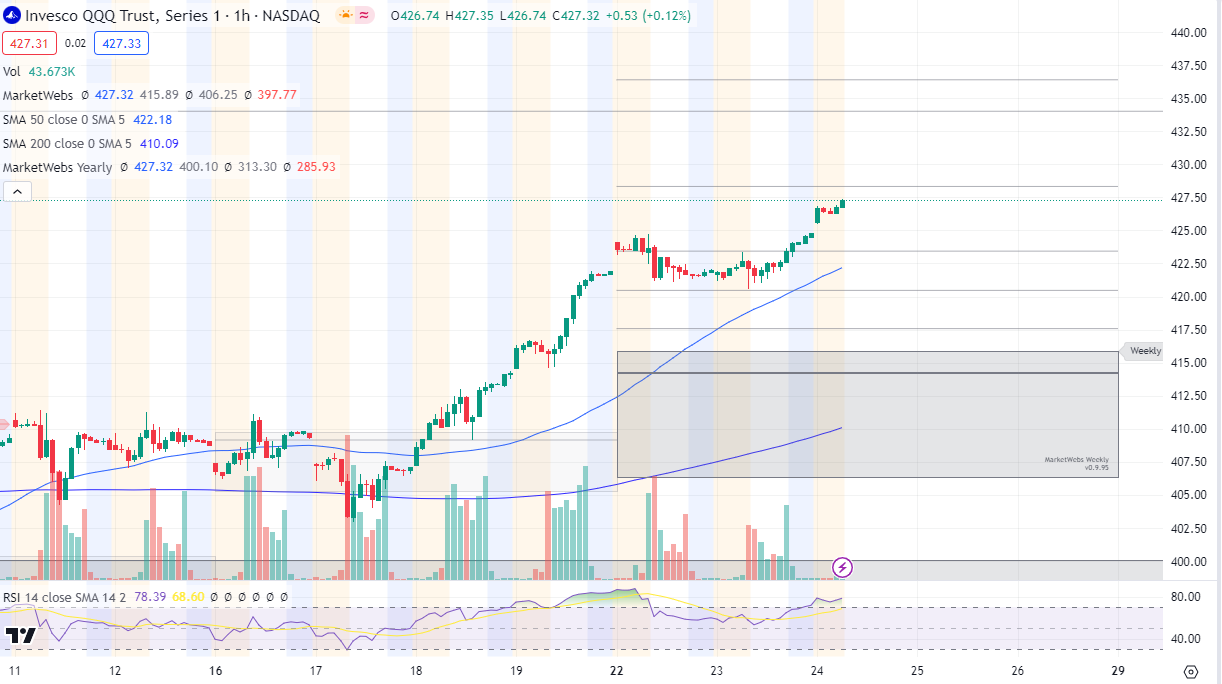
QQQ - NDX 100 ETF - Daily chart: Price ind. +0.8% after strong earnings results from NVDA ASML NVDA ISRG & price continues to trend above its Jan Value Area
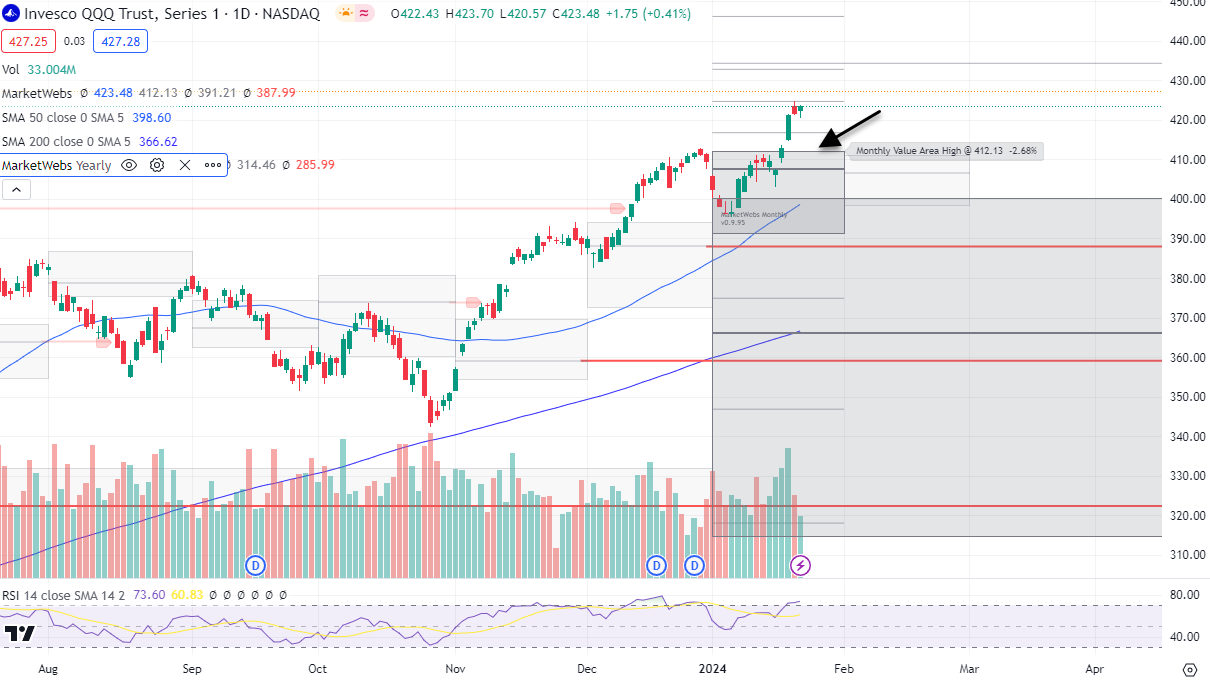
1hr chart: After some consolidation yesterday, price rallied into the close yesterday and is continuing to trend +
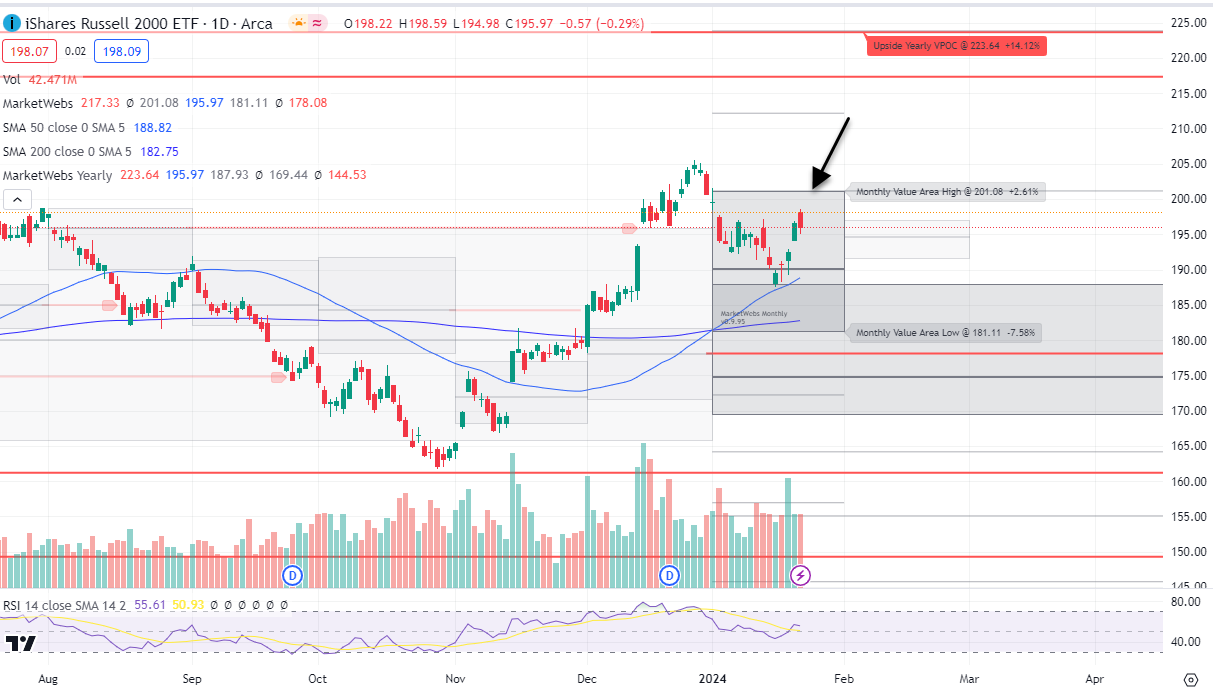
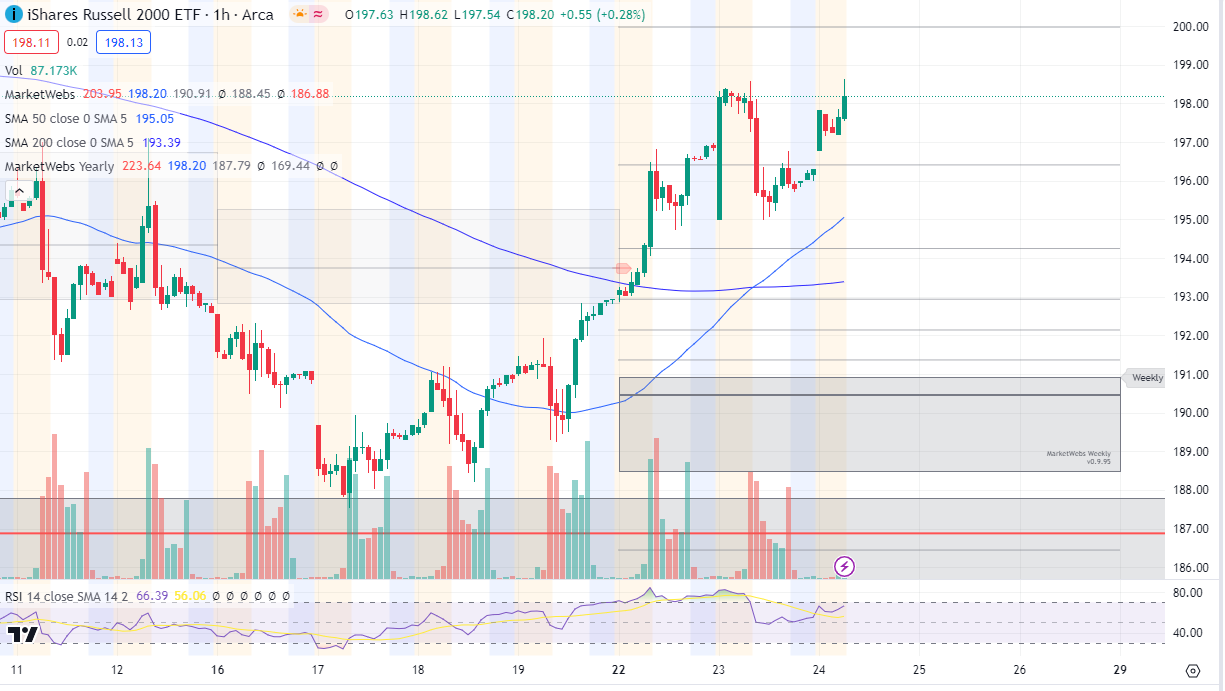
IWM - Russell Small Cap ETF- Price ind. +1.1% this morning , Bonds helping the move with rates moving lower. Resistance to watch 201.08 top of Jan Value Area
1hr chart: More volatility that the other indices and moving back to last week's high which will be a decent test for the Small Caps
Here is today’s TTG Proprietary Stock Screen “Out of the Box” using Volume At Price
names trending above their Value Areas (on 3 multiple timeframes & not super extended)
Keep reading with a 7-day free trial
Subscribe to The Tribeca Trade Group to keep reading this post and get 7 days of free access to the full post archives.