US Dollar -0.3% / 30yr Bonds +0.1% / Crude -1.7% & Nat Gas +1.6% / Gold flat / Copper -0.3% / Cryptos are higher BTC +1.5%
US Upcoming Economics
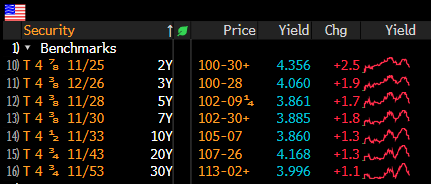
US Bond Yields
Index Updates
At TTG, I use Volume At Price in my chart analysis and I use the MarketWebs Indicator to provide Value Areas & VPOCs which indicate significant support & resistance levels. Learn More Here about Volume At Price and the MarketWebs.
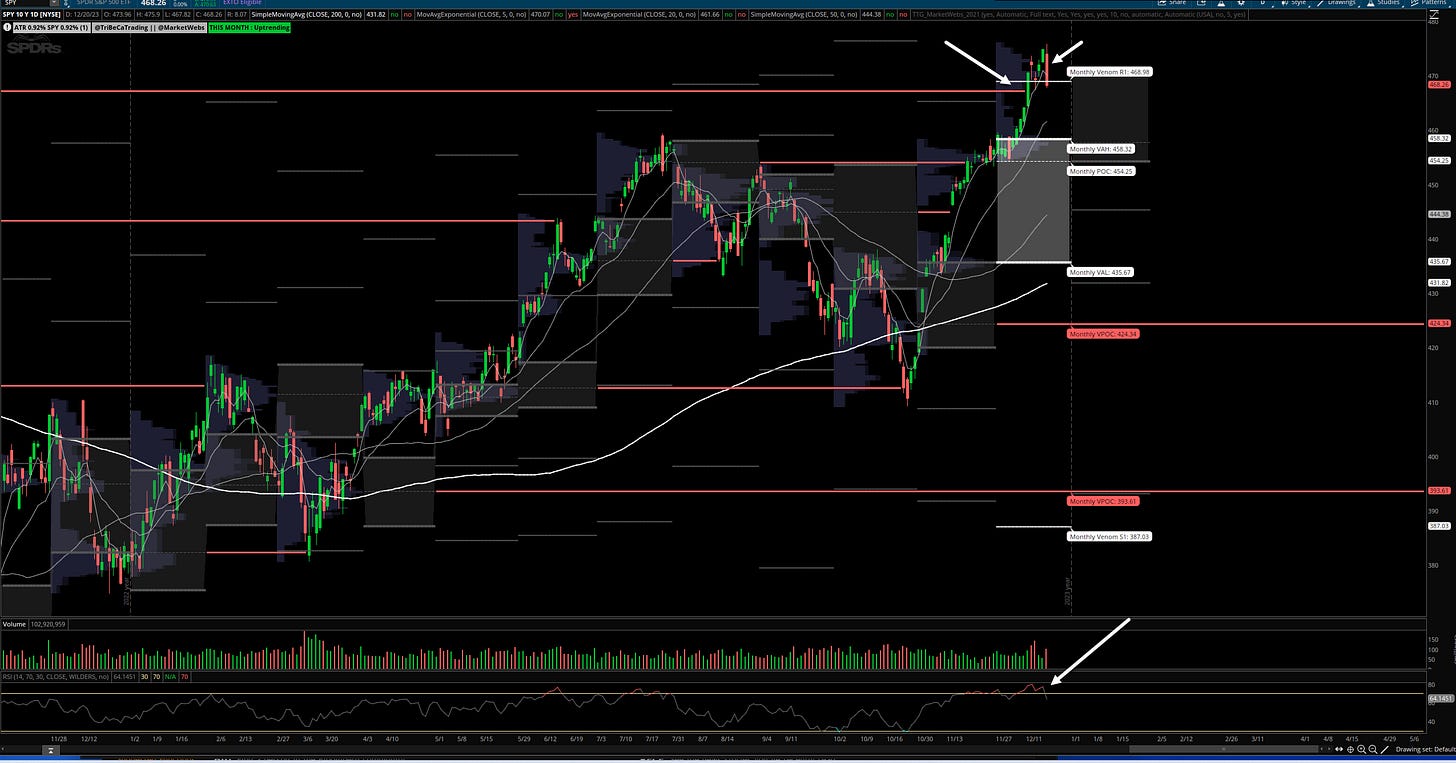
SPY- S&P ETF - Daily chart: Well that's one way to get off of overbought levels! The RSI was close to 80 yesterday, and yesterday was a product of when markets are super bought and when everyone aims to take profits at the same time and there is holiday (low) liquidity. In addition to selling, speculators took advantage by playing a downside move and the result is a dramatic reversal.
So, what to watch going forward? Price lost its 5d MA yesterday and I am watching to see if that can be reclaimed along with the 1hr Value Area (see next)
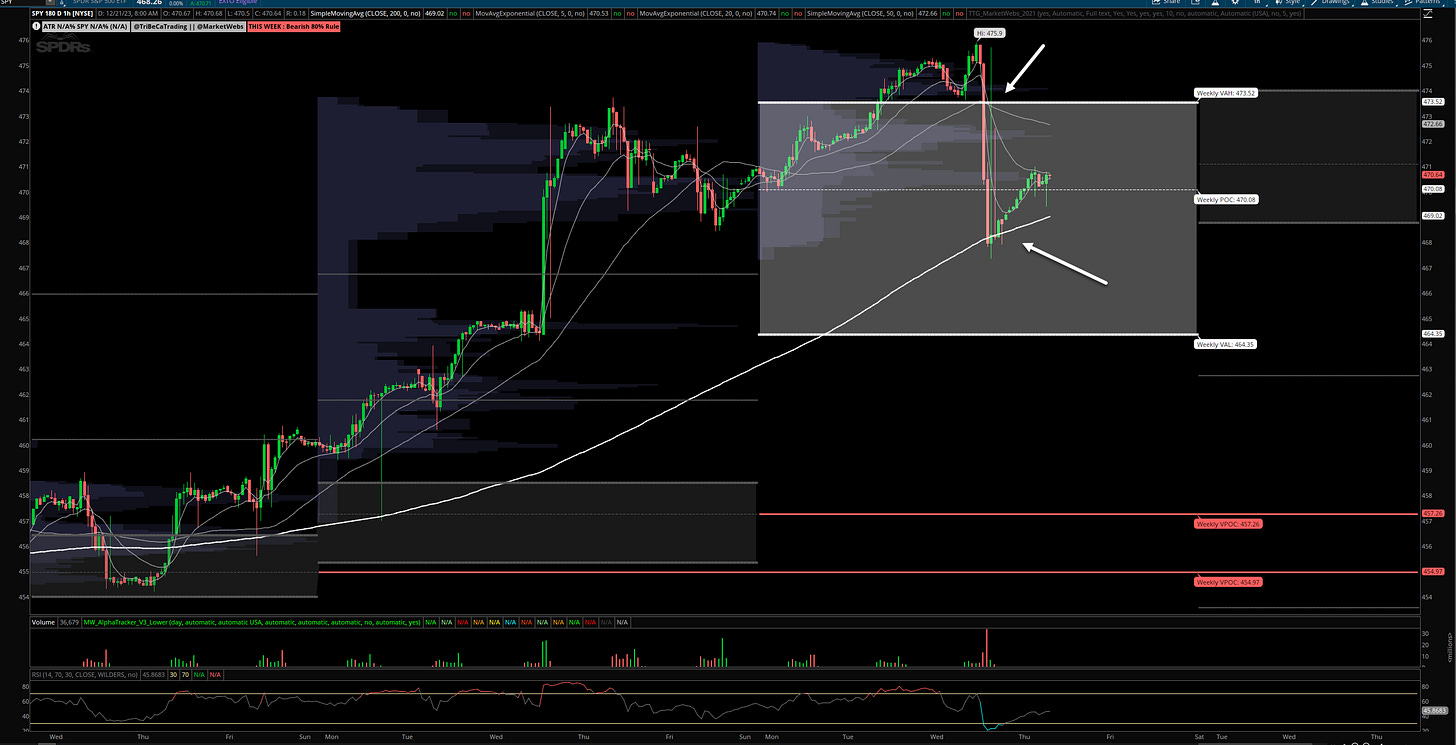
1hr chart: Price fell into its Value Area for the week and that was the level that I mentioned to watch yesterday, $473.52 - so what was support is now resistance and remains a good level to watch. In addition, watch that 200 period MA (thick white line) & if that is breached that I would target $464.35 for a bearish 80% rule to play out.
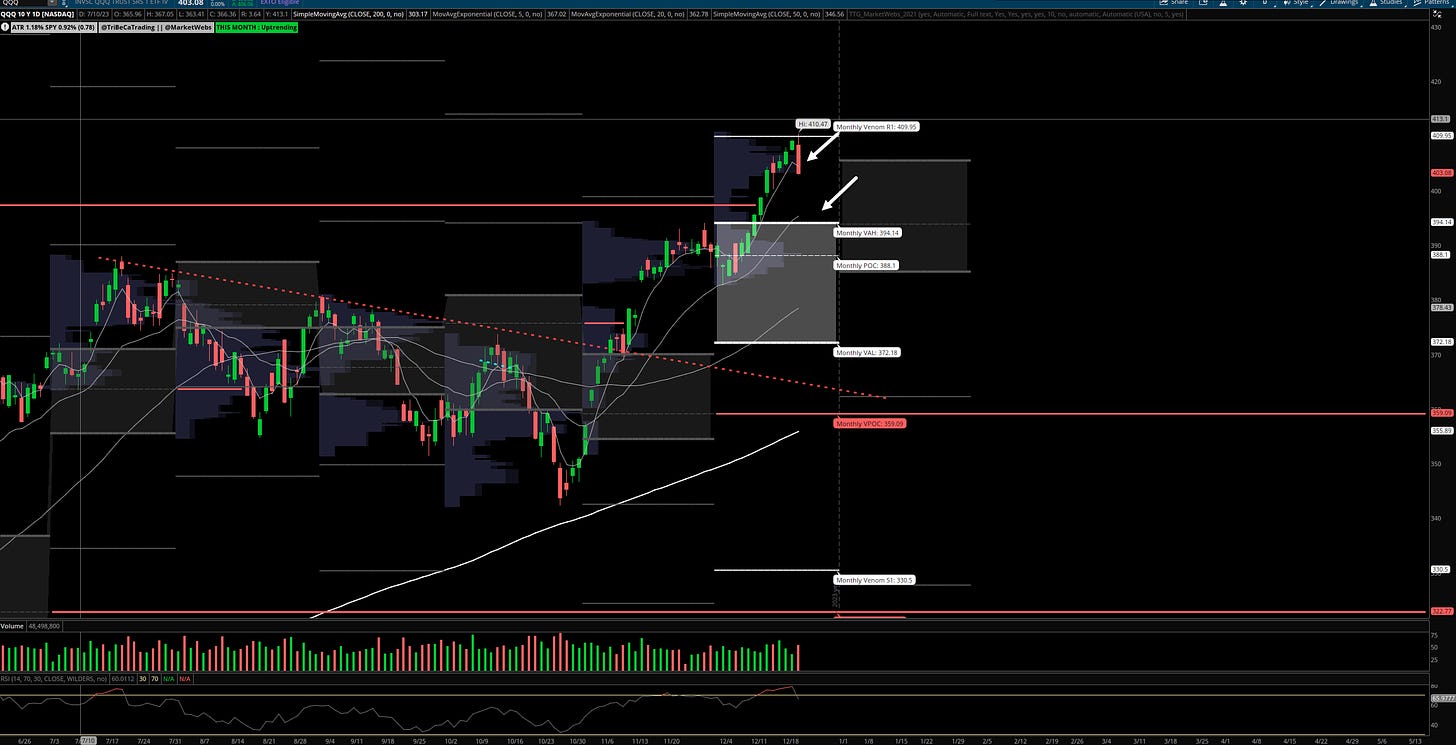
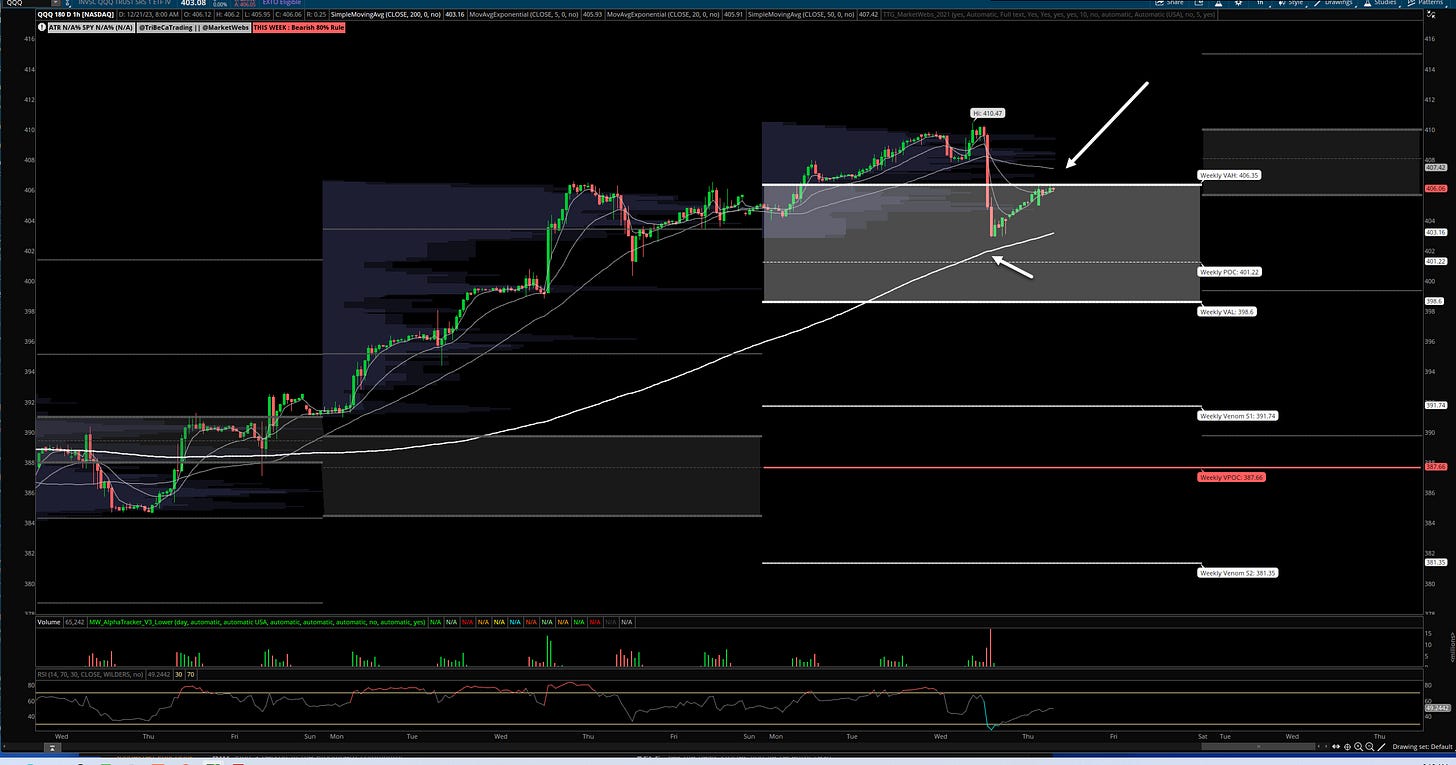
QQQ - NDX 100 ETF - Daily chart: Price also lost its 5d MA yesterday and that is what I am watching today, coming days to see if price can reclaim its short term MA as price is decently above its Dec Value Area
1hr chart: A great level to watch today, $406.35 - and makes it easy to make a decision in my opinion - for me, if price is > $406.35 can be long and if not, then I am more neutral.
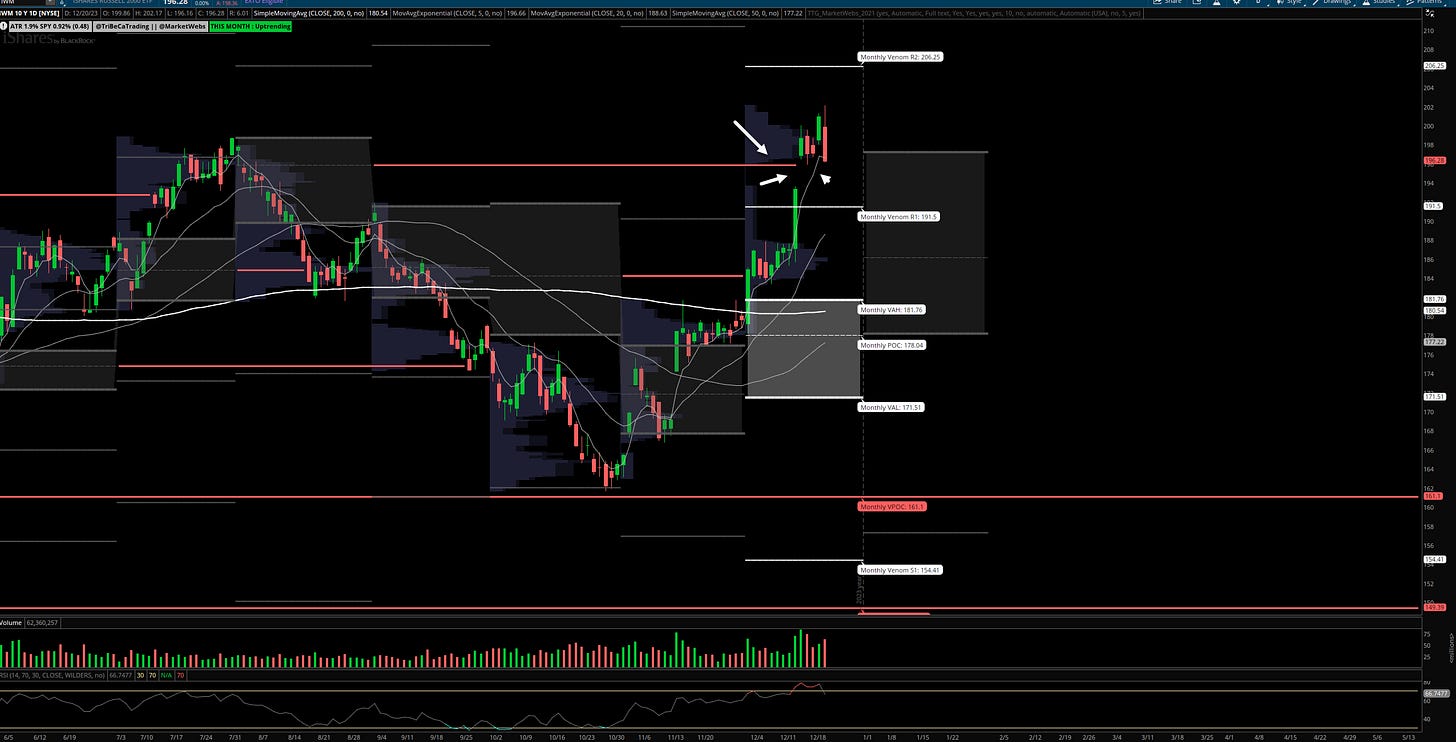
IWM- Russell Small Cap ETF- Daily Chart: Price also slipped back below its 5d MA and is similar to the other indices discussed, I am watching to see if that can be reclaimed. if not, watch for a gap fill from last week's Wed to Thurs move. / 1hr chart:
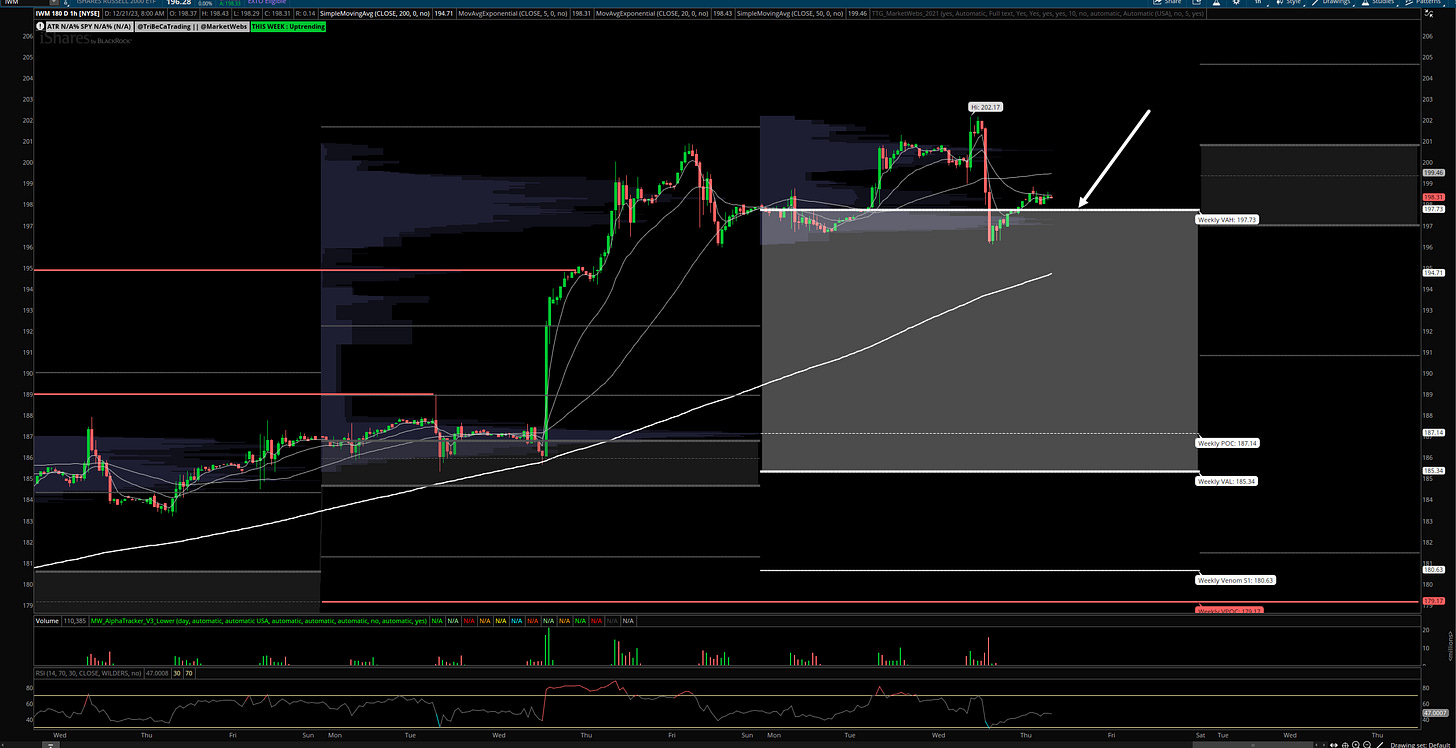
1hr chart: Notable is that price is still above its Value Area for the week, watch $197.73 here and is a level that can be long against for a trade & stop just below that level.
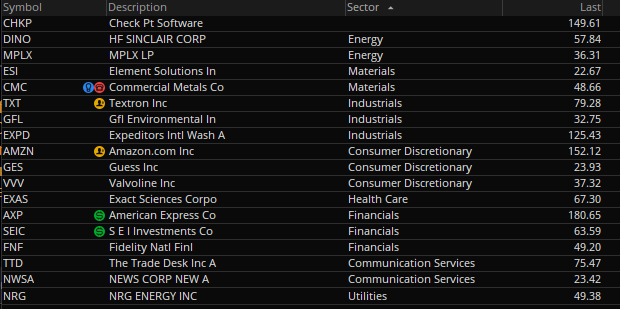
Here is today’s TTG Proprietary Stock Screen “Out of the Box” using Volume At Price
names trending above their Value Areas (on 3 multiple timeframes & not super extended)
Charts
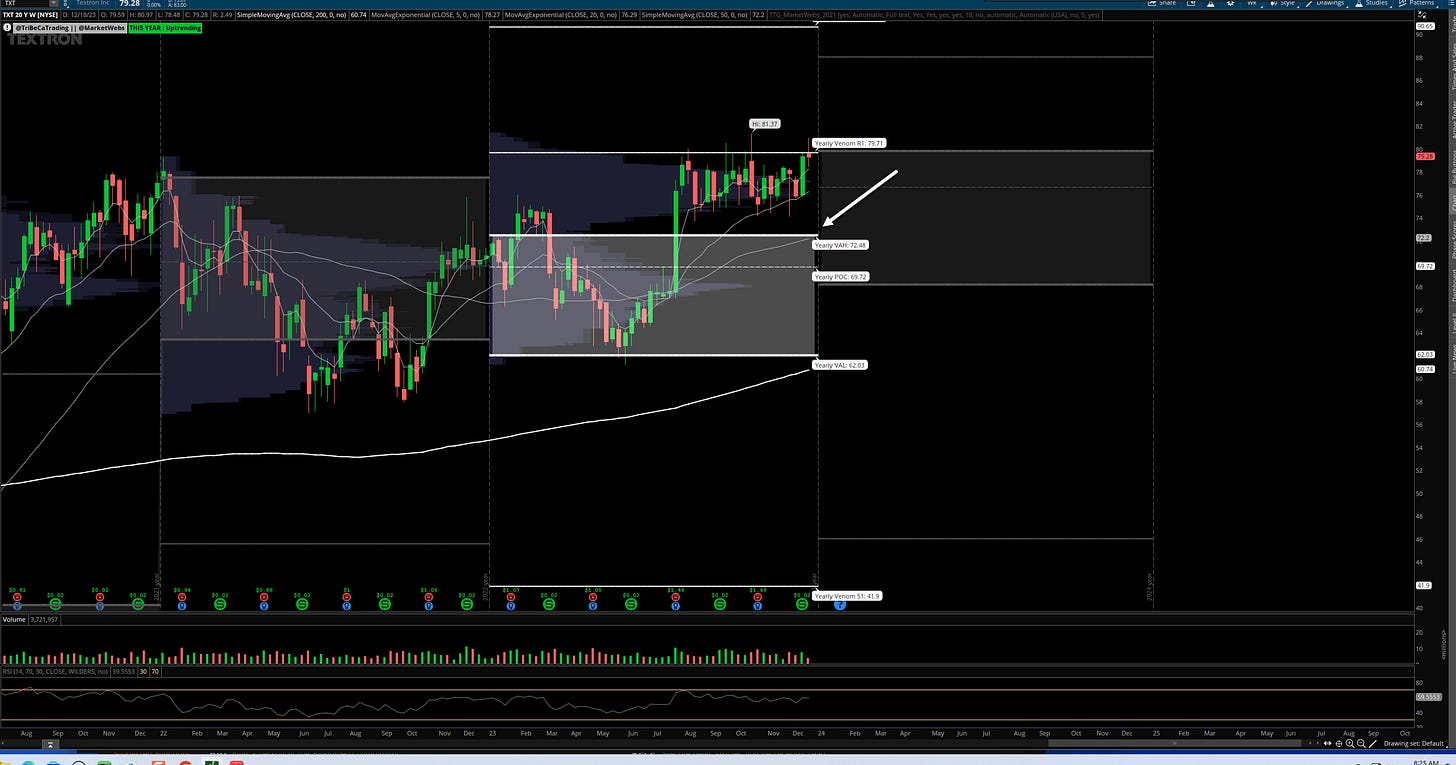
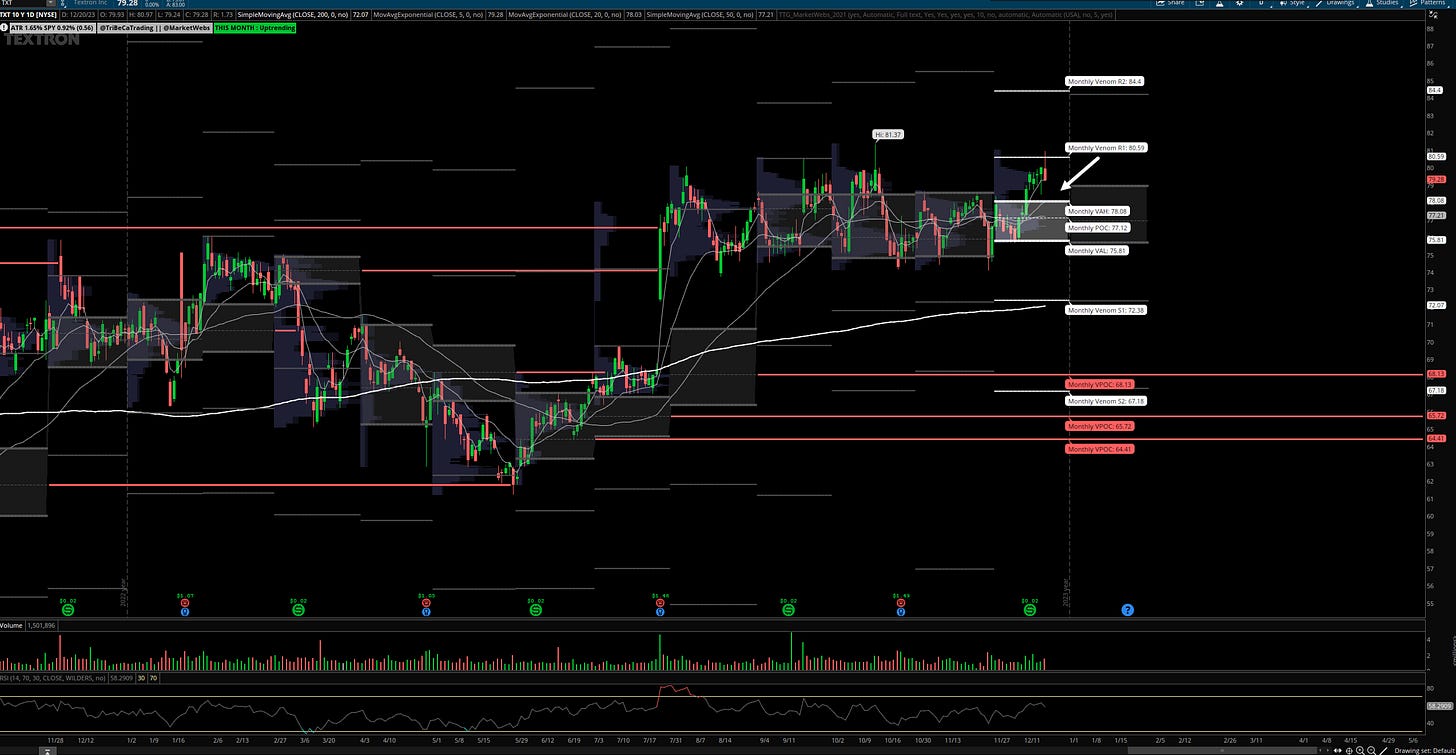
TXT Weekly, Daily chart
Textron Inc. operates as a multi-industry company with operations in aircraft, defense, industrial products, and finance. The Company provides airplanes, helicopters, weapons, and automotive products. Textron's finance division offers asset based lending, aviation, distribution, golf, and resort finance, as well as structured capital.(Bloomberg)
- Using the TTG MarketWebs, stop price $78
Copyright © Tribeca Trade Group. All of the information in this newsletter is for entertainment and educational purposes only and is not to be construed as investment or trading advice. None of the information in this newsletter is guaranteed to be accurate, complete, useful or timely. IMPORTANT NOTICES AND DISCLAIMERS TriBeCa Trade Group is not an investment advisor and is not registered with the U.S. Securities and Exchange Commission or the Financial Industry Regulatory Authority. Further, owners, employees, agents or representatives of TriBeCa Trade Group are not acting as investment advisors and might not be registered with the U.S. Securities Authority


