

TTG Index Charts & Out of the Box Stock Screen 3/6/24 $BLK
TTG Index Charts & Out of the Box Stock Screen 3/6/24 $BLK
Out of the Box MarketWebs Screen
US Dollar -0.2 / 30yr Bonds -0.1% / Crude +1.1% & Nat Gas -0.1% / Gold flat / Copper +0.3% / BTC +6.5%
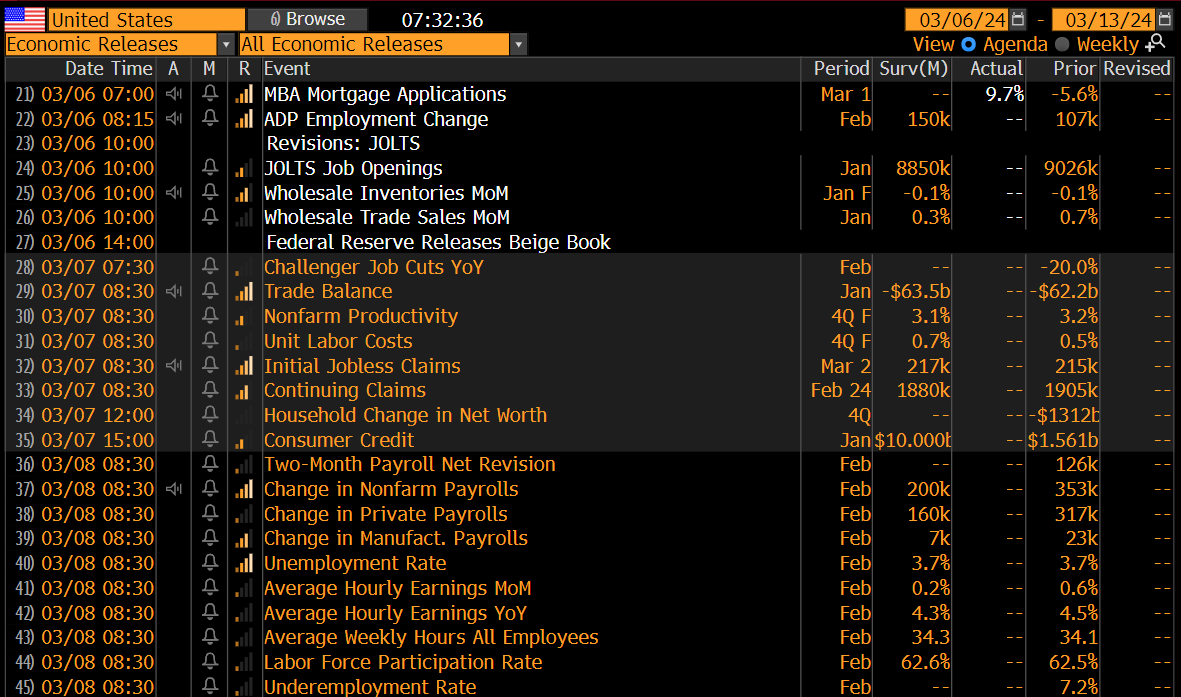
US Upcoming Economics
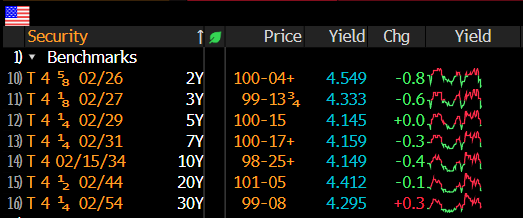
US Bond Yields
Index Updates
At TTG, I use Volume At Price in my chart analysis and I use the MarketWebs Indicator to provide Value Areas & VPOCs which indicate significant support & resistance levels. Learn More Here about Volume At Price and the MarketWebs.
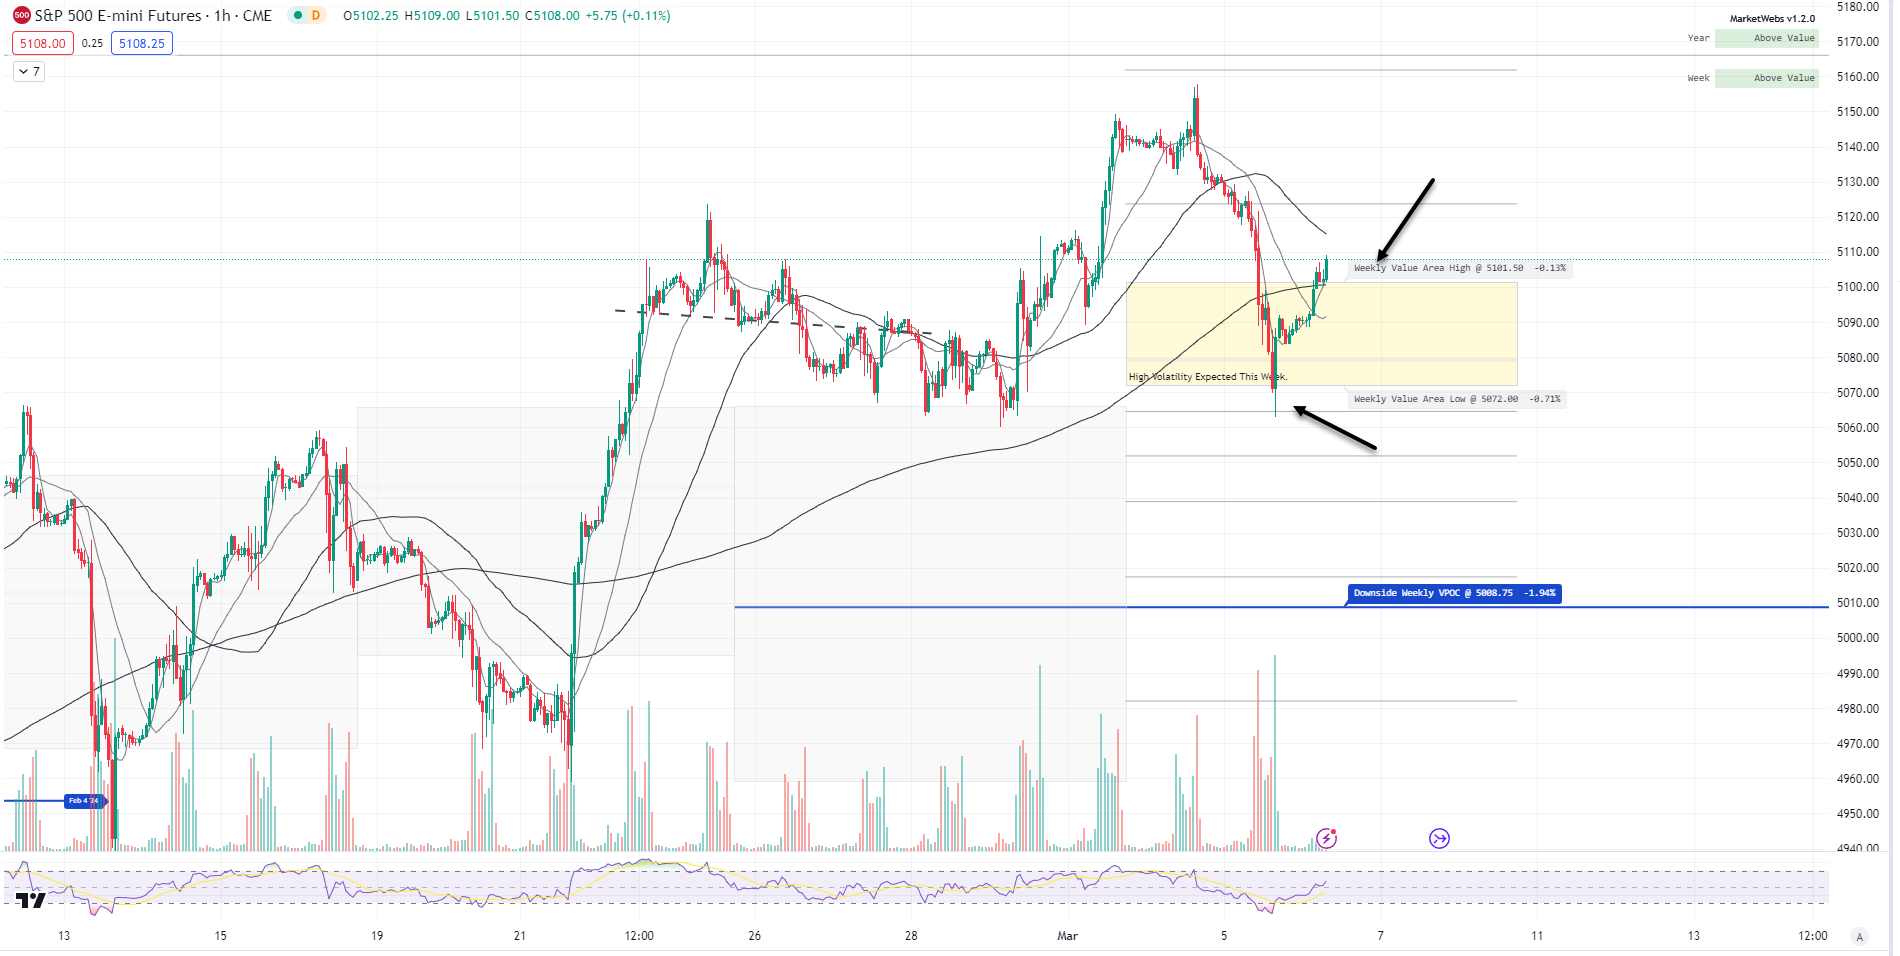
ES_F - SPX Futures - Price ind. +0.5% nice bounce this morning and price holding above the Mar Value Area, support to watch 5058.5. Note Powell starts his 2 day testimony in front of Congress at 10am est.

1hr chart: After testing the bottom of this week's Value Area yesterday, price held support and bounced & now is back above its Value Area for the week , support to keep an eye on is 5101
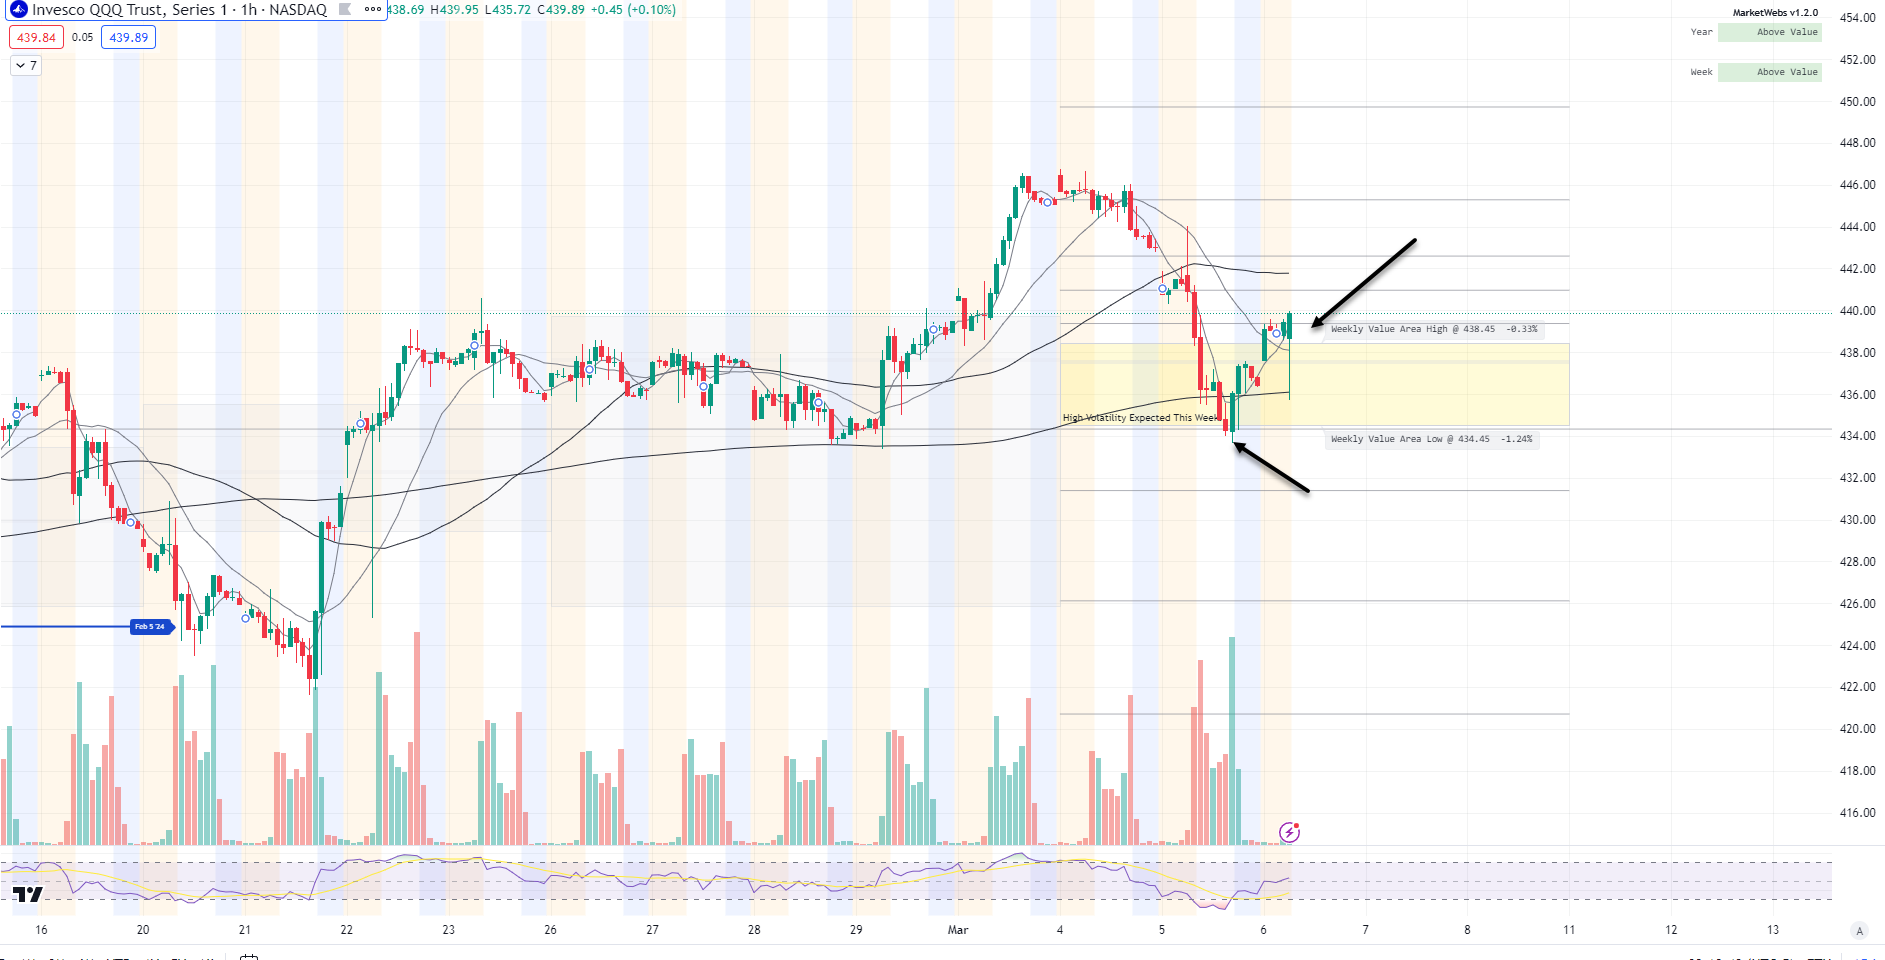
QQQ - NDX 100 ETF - Daily chart: Price ind. +0.9% big bounce this morning and that might get price back above its Mar Value Area, level to watch here is $439
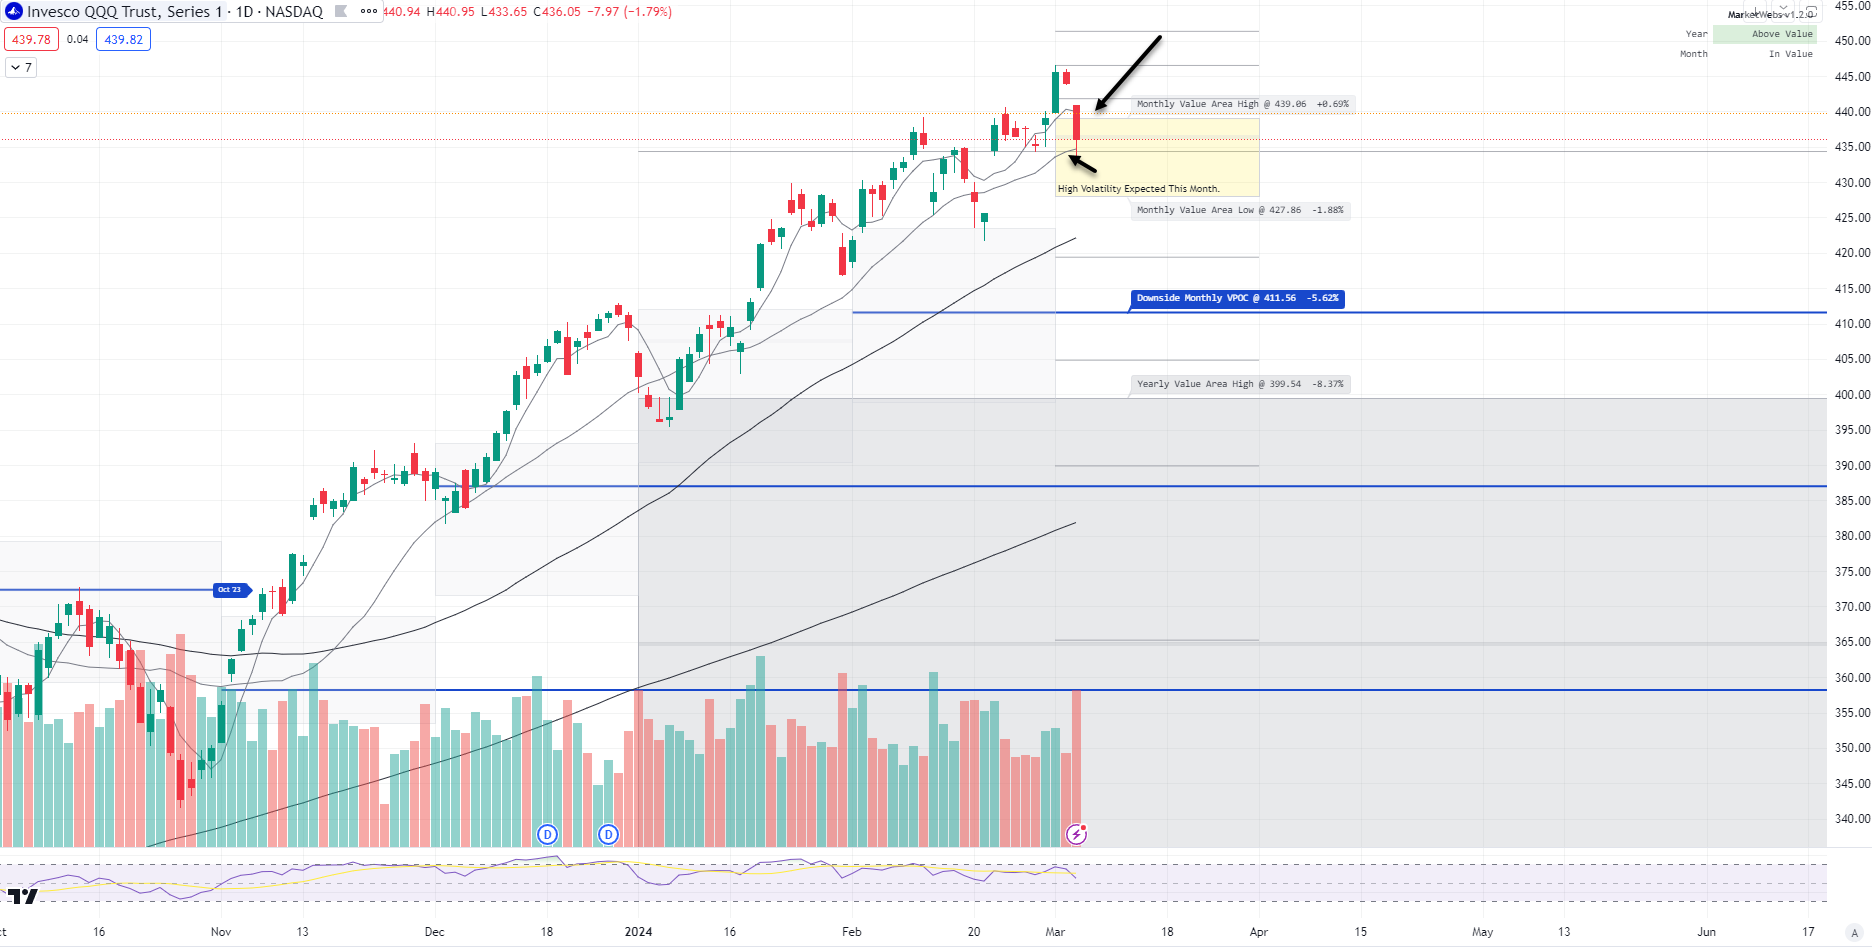
1hr chart: Similar to the S&P, price tested its bottom of Value Area, held and bounced and this morning is rallying back above its top of Value Area, level to watch here is $438.45
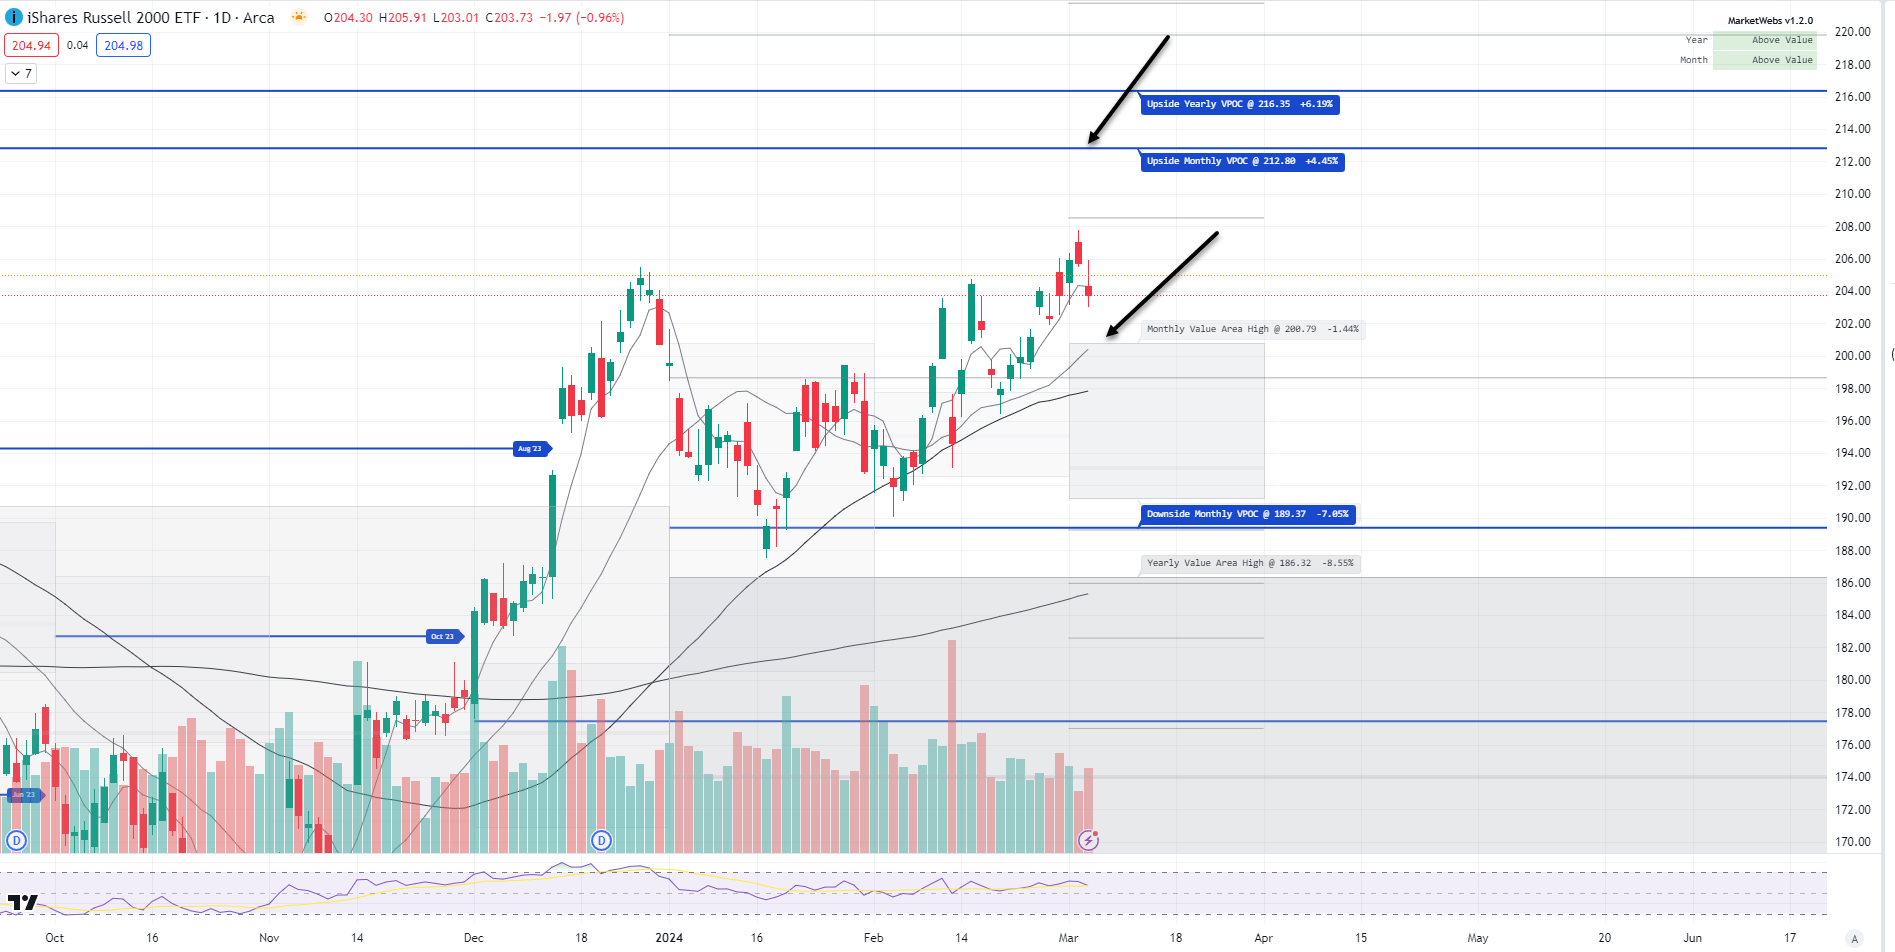
IWM - Russell Small Cap ETF- Price ind. +0.6% this morning & price remains decently above its Mar Value Area, and below the next VPOC up at $212.8
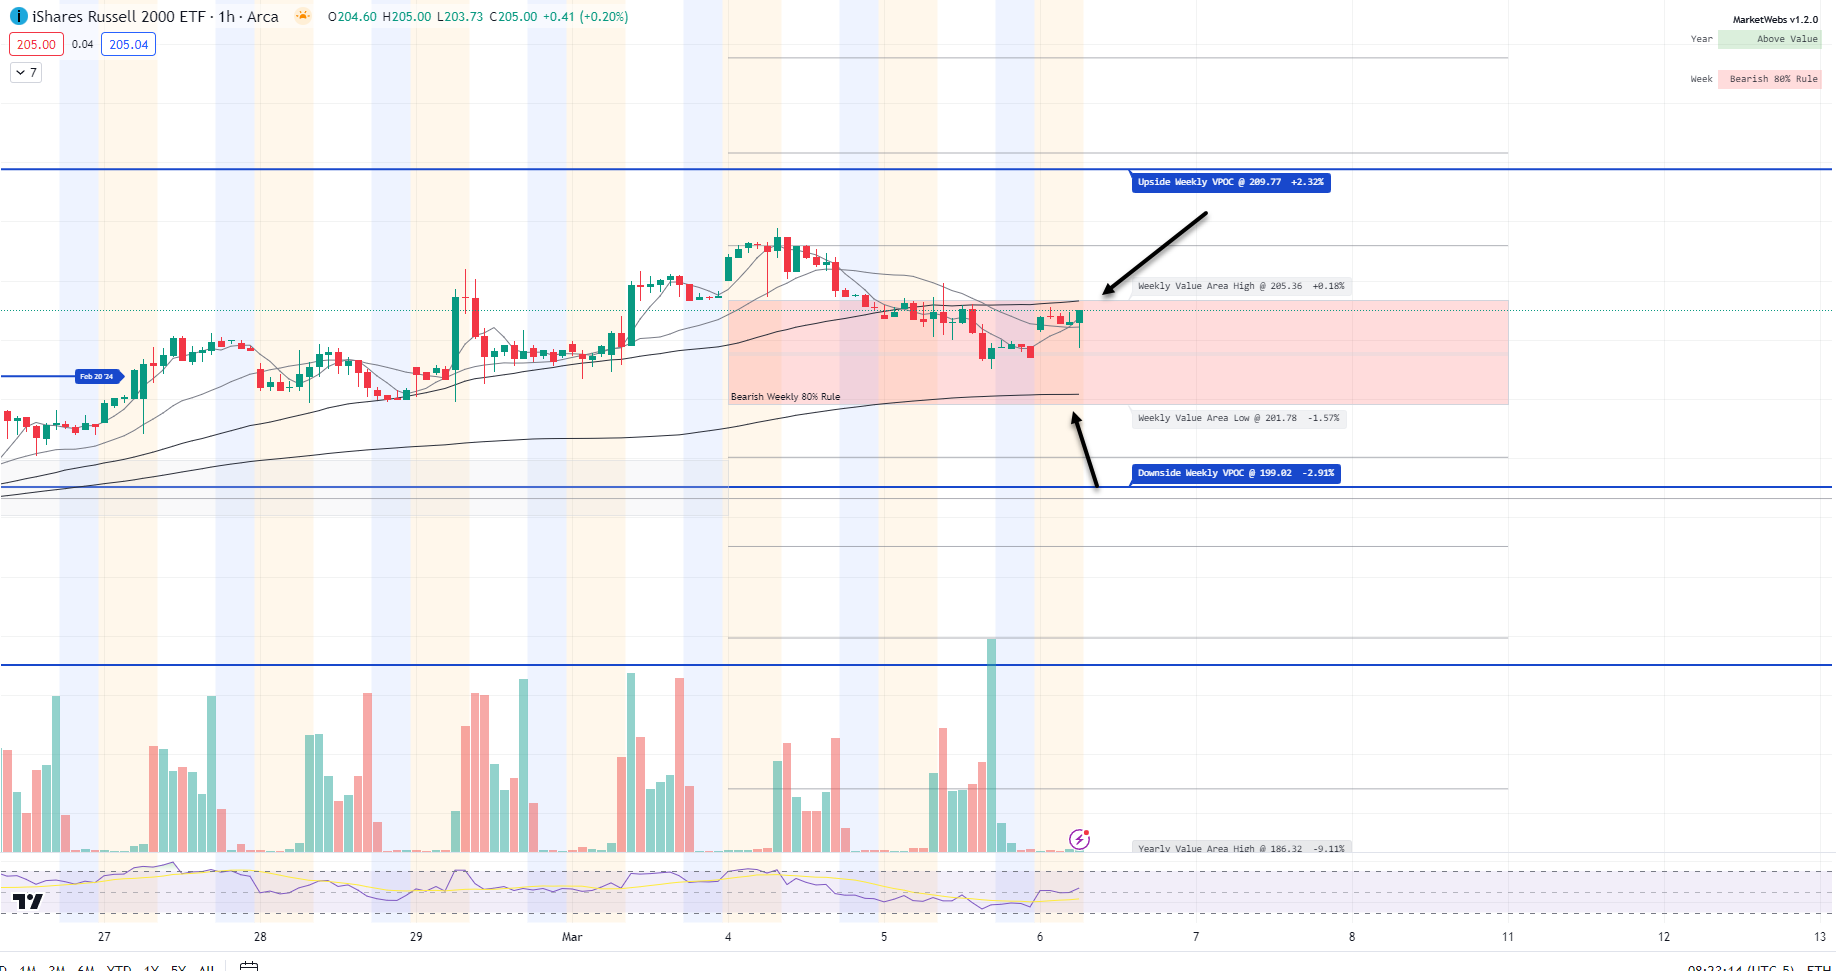
1hr chart: Price is inside its Value Area and the bearish 80% rule is still in effect for the week, unless price can reclaim its top of Value at $205.36
Here is today’s TTG Proprietary Stock Screen “Out of the Box” using Volume At Price
names trending above their Value Areas (on 3 multiple timeframes & not super extended)
Keep reading with a 7-day free trial
Subscribe to The Tribeca Trade Group to keep reading this post and get 7 days of free access to the full post archives.