

TTG Index Charts & Out of the Box Stock Screen 4/10/24 $ADI
TTG Index Charts & Out of the Box Stock Screen 4/10/24 $ADI
Out of the Box MarketWebs Screen
US Dollar -0.1% / 30yr Bonds +0.2% / Crude +0.6% & Nat Gas +3.0% / Gold +0.1% / Copper +0.9% / BTC -0.2%
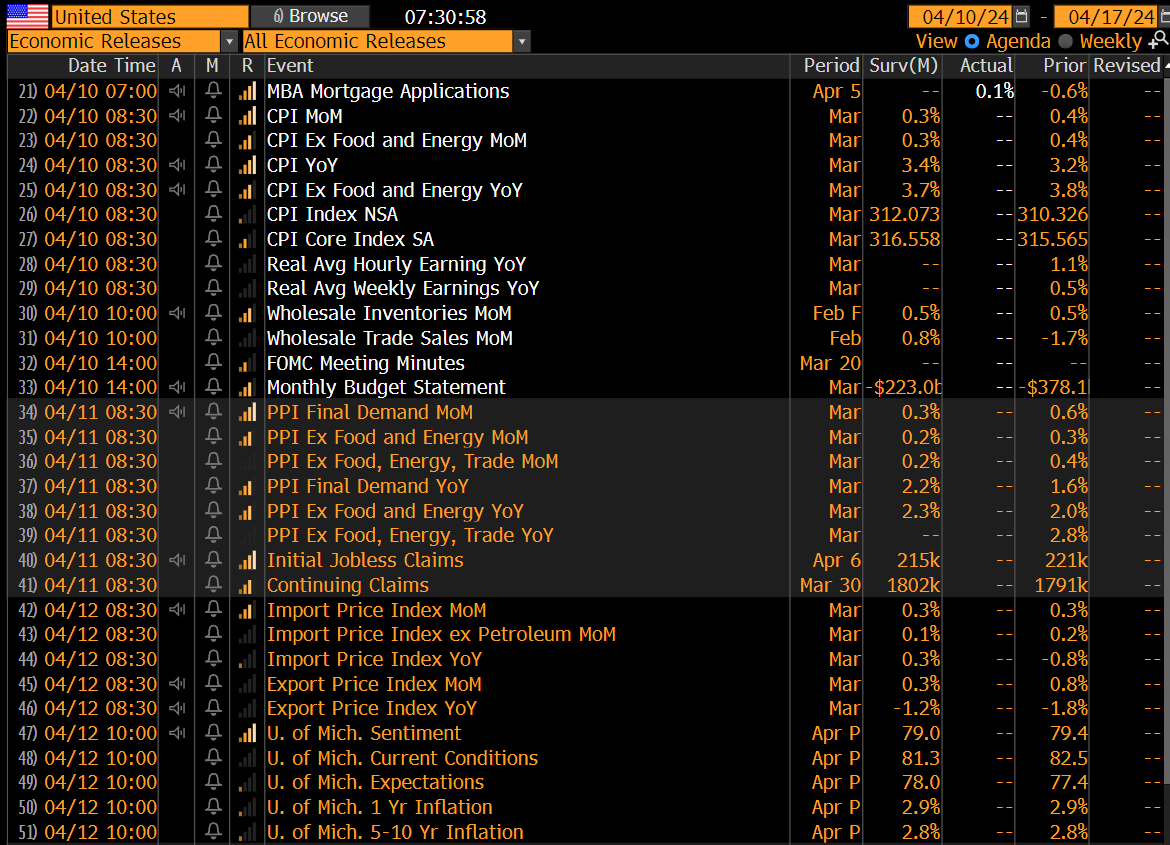
US Upcoming Economics
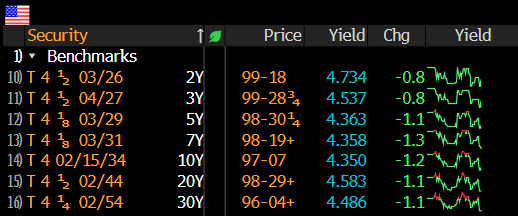
US Bond Yields
Index Updates
At TTG, I use Volume At Price in my chart analysis and I use the MarketWebs Indicator to provide Value Areas & VPOCs which indicate significant support & resistance levels. Learn More Here about Volume At Price and the MarketWebs.
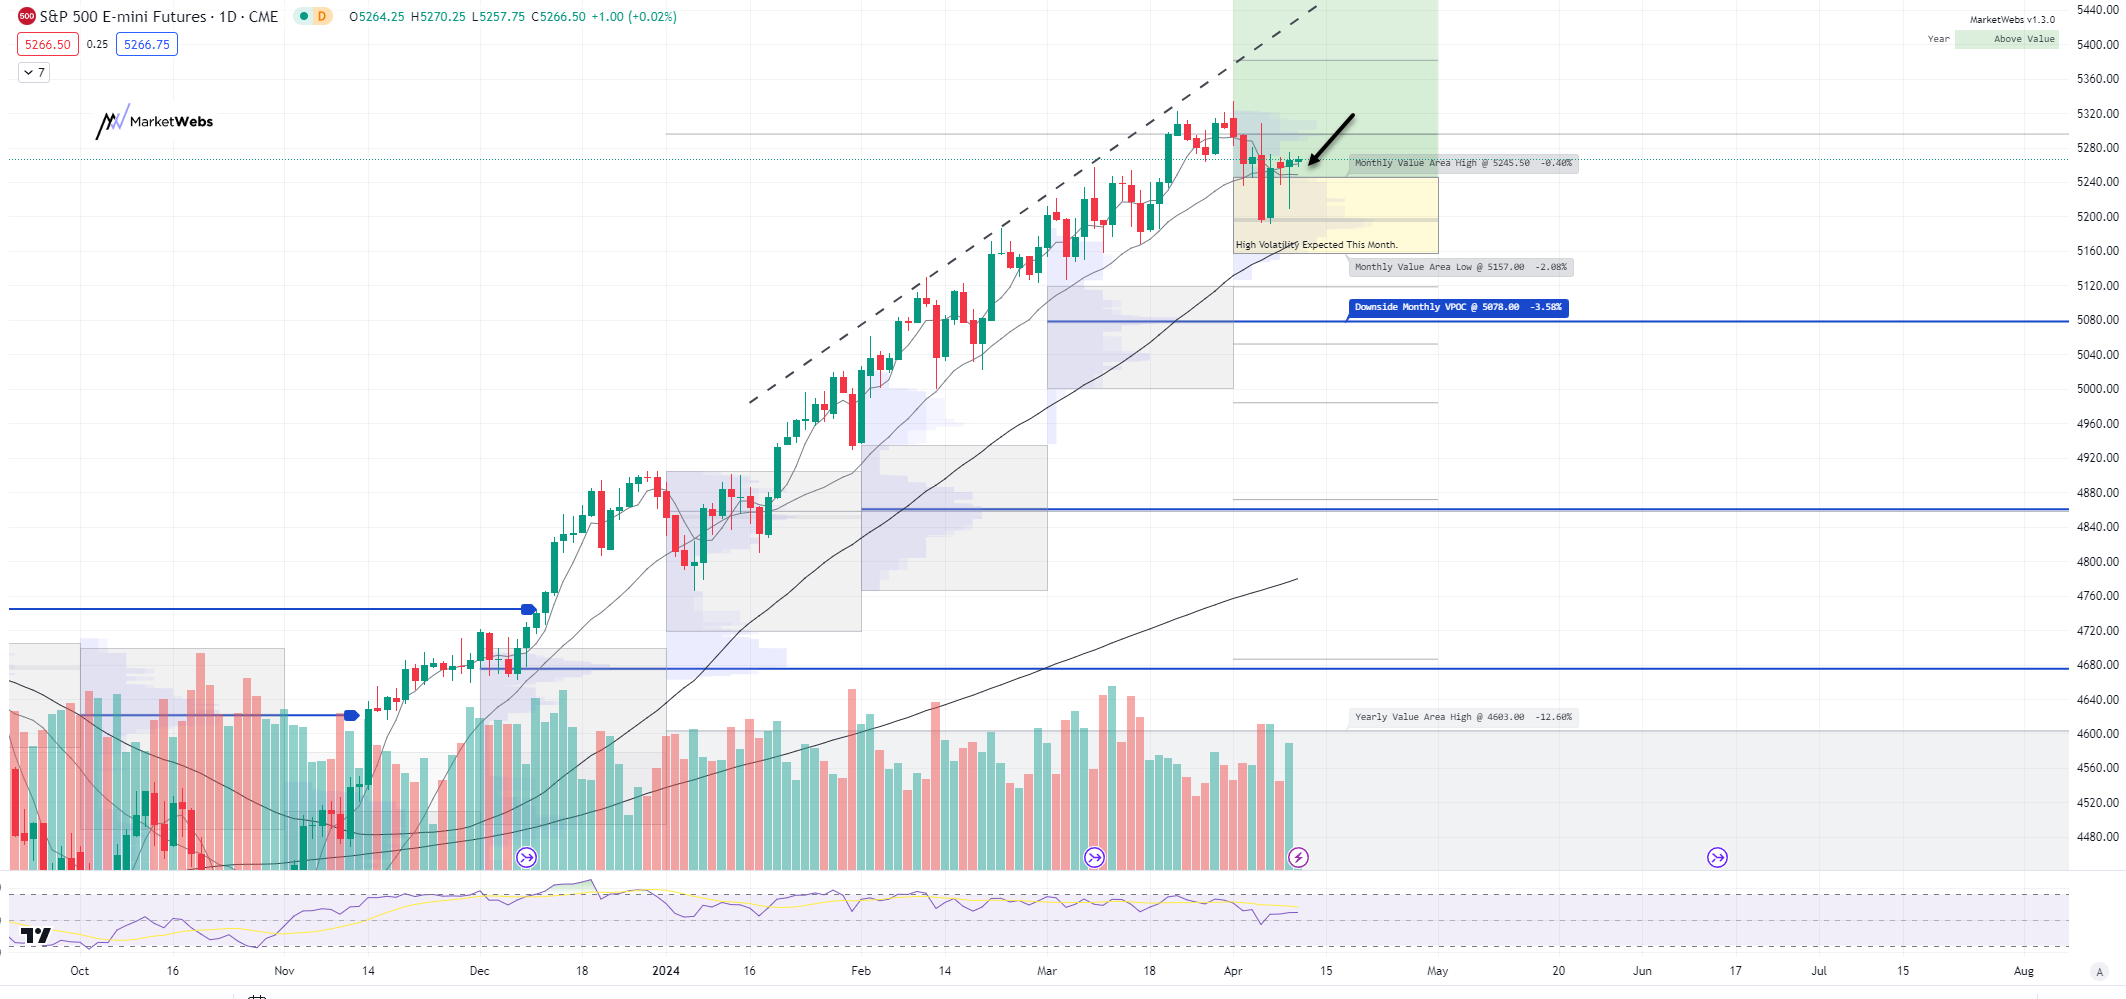
ES_F - SPX Futures - Daily chart: Price continues to be whippy intraday , but really not covering any significant territory. A positive heading into inflation data today is that price is above its April Value Area, the level to watch continues to be 5245.5 top of Value Area.
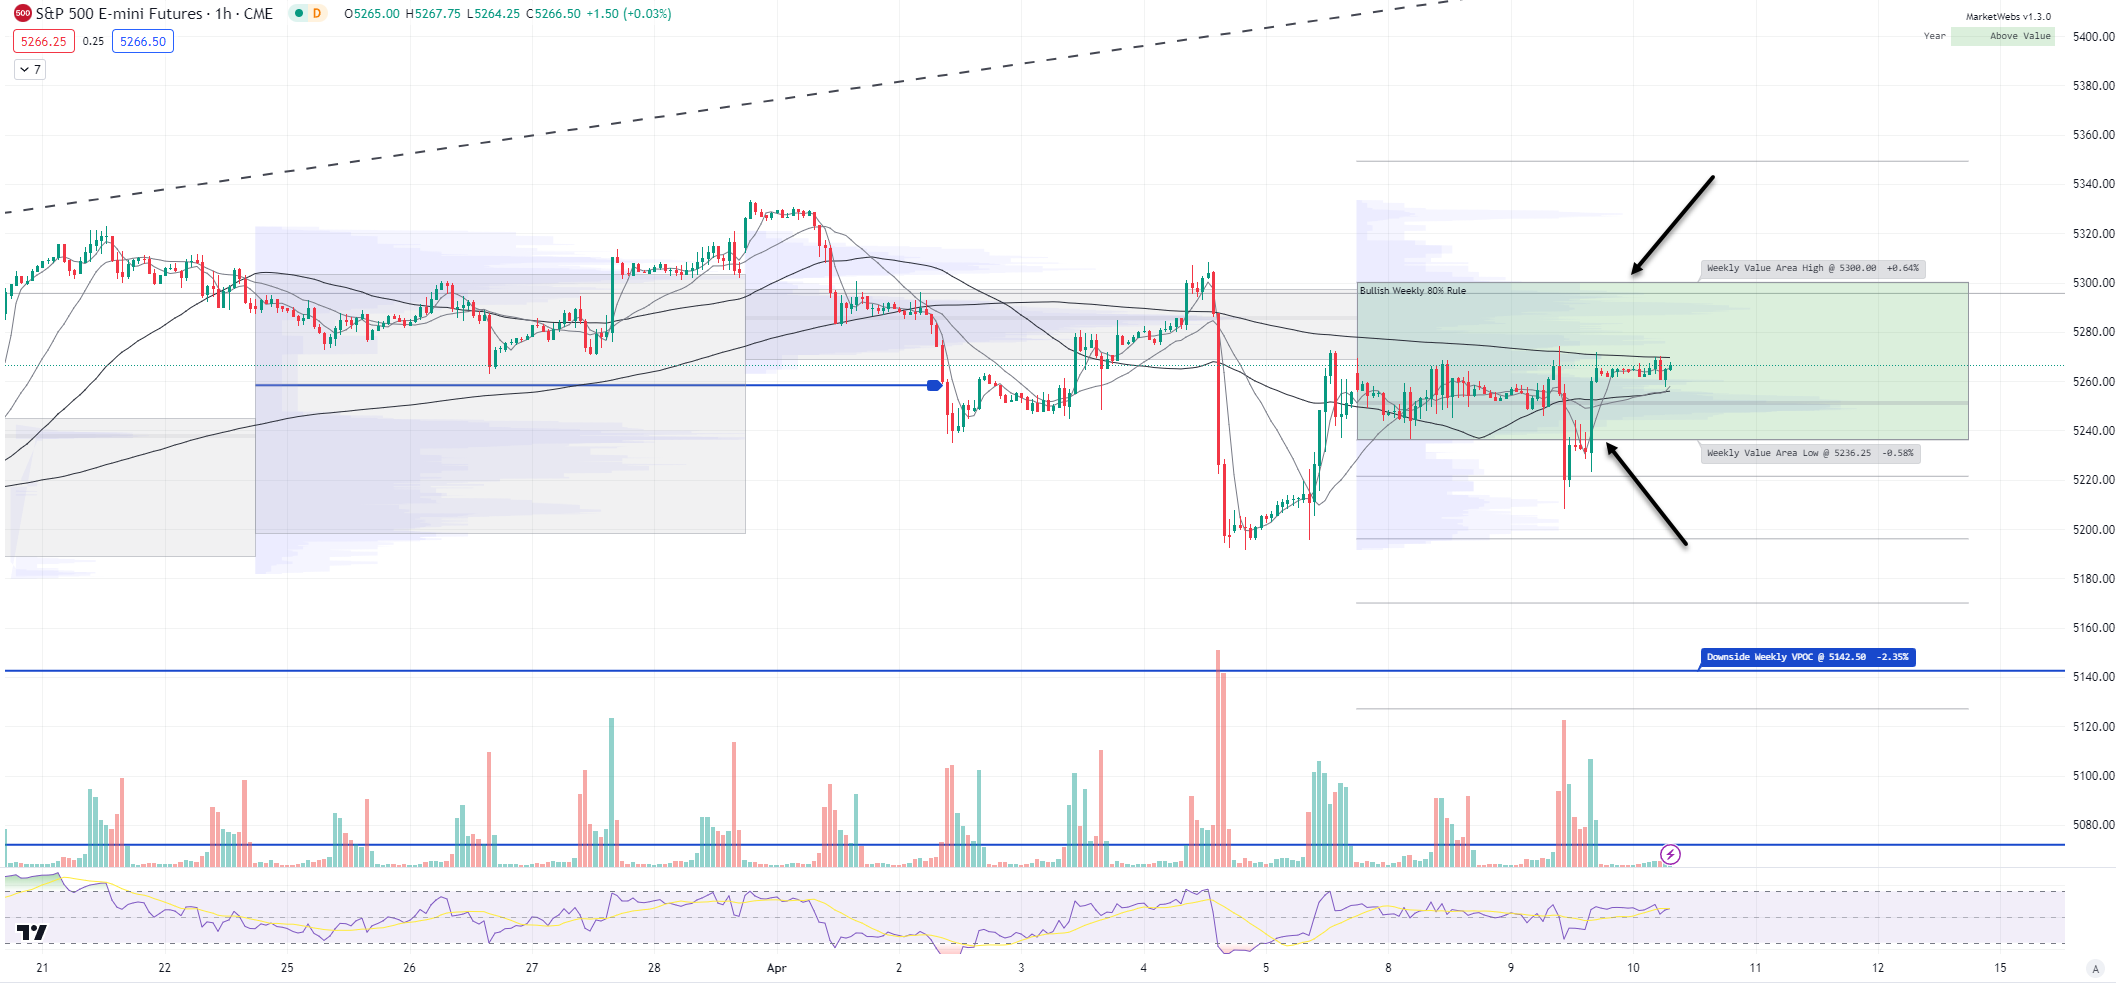
1hr chart: Price tests the bottom of it Value Area, but did not break and is back in the middle of the Value Area, support level to watch 5236.25 and resistance is 5300
QQQ - NDX 100 ETF - Daily chart: Price still locked inside its April Value Area, support to watch is $435.85, resistance $444.57
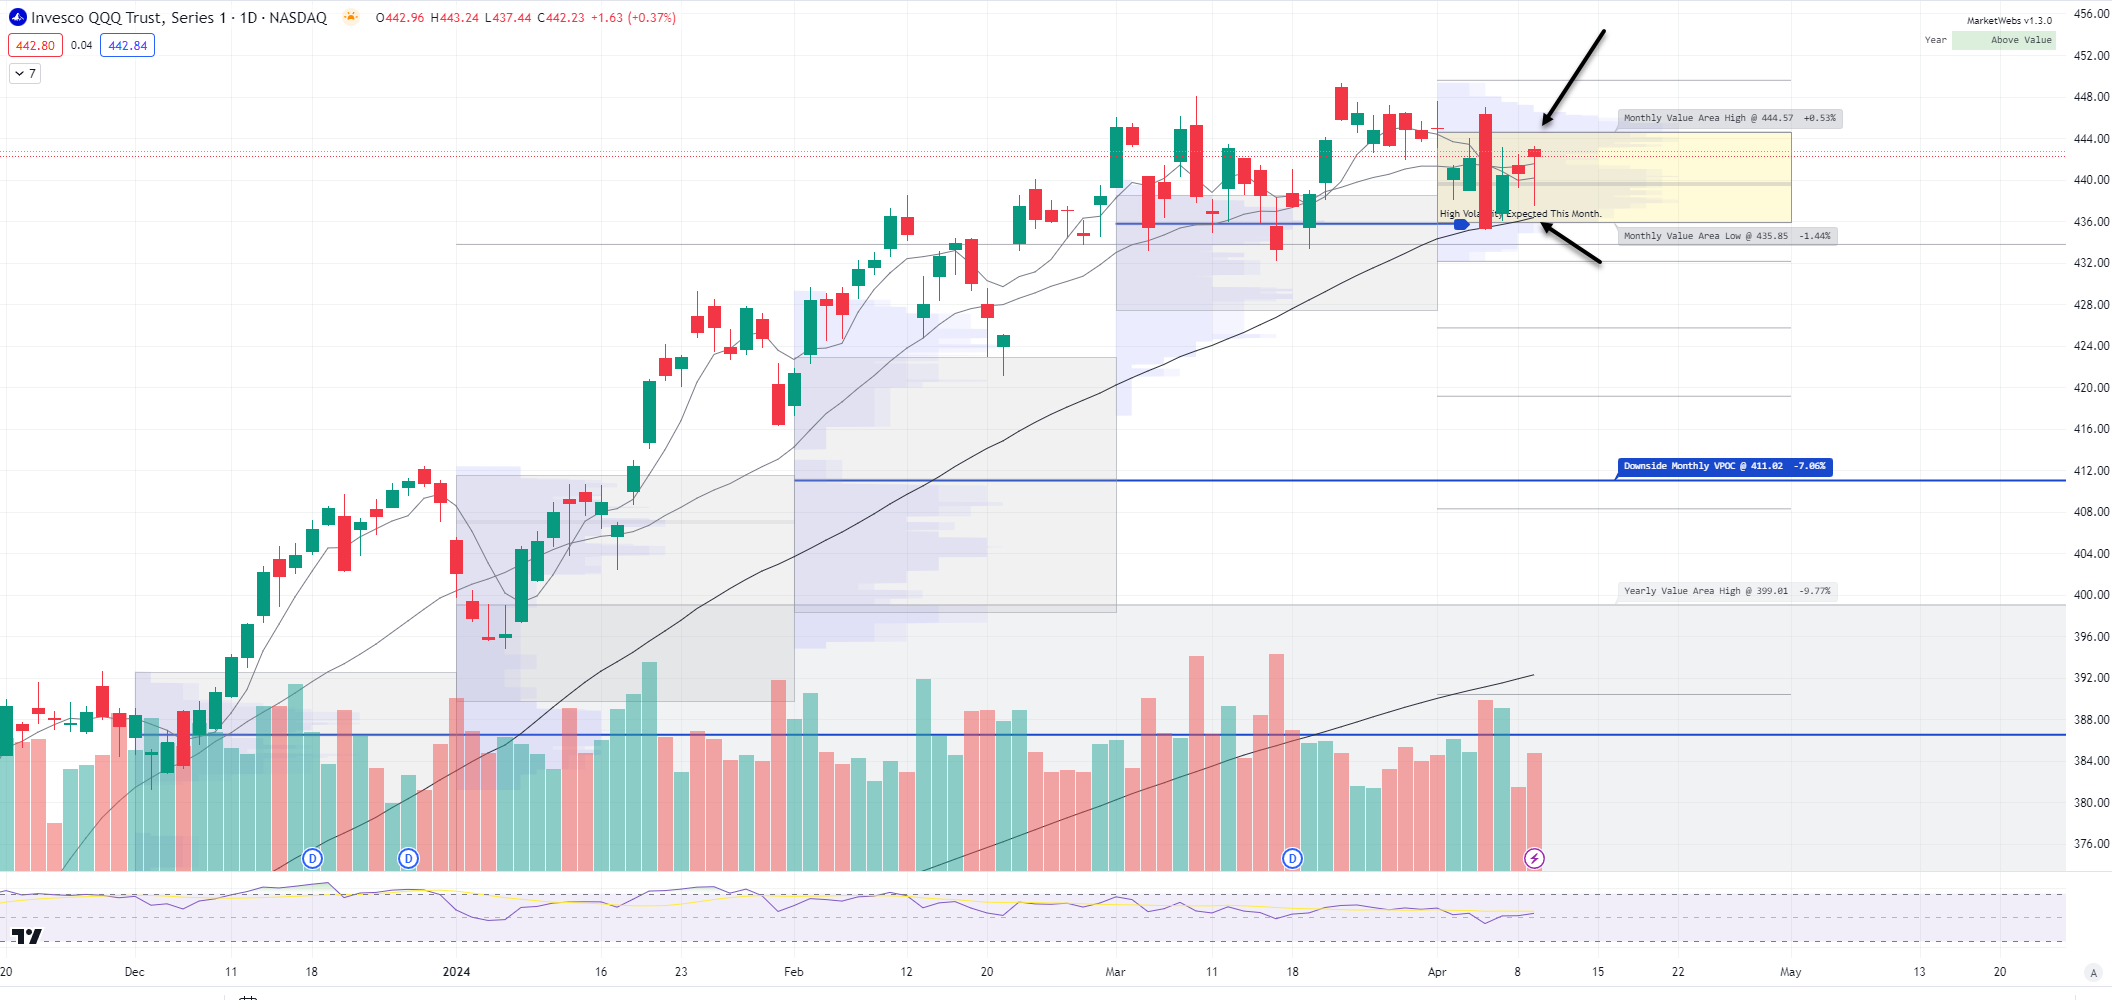
1hr chart: The sideways range continues.. support to watch $438.38 and resistance $444.92
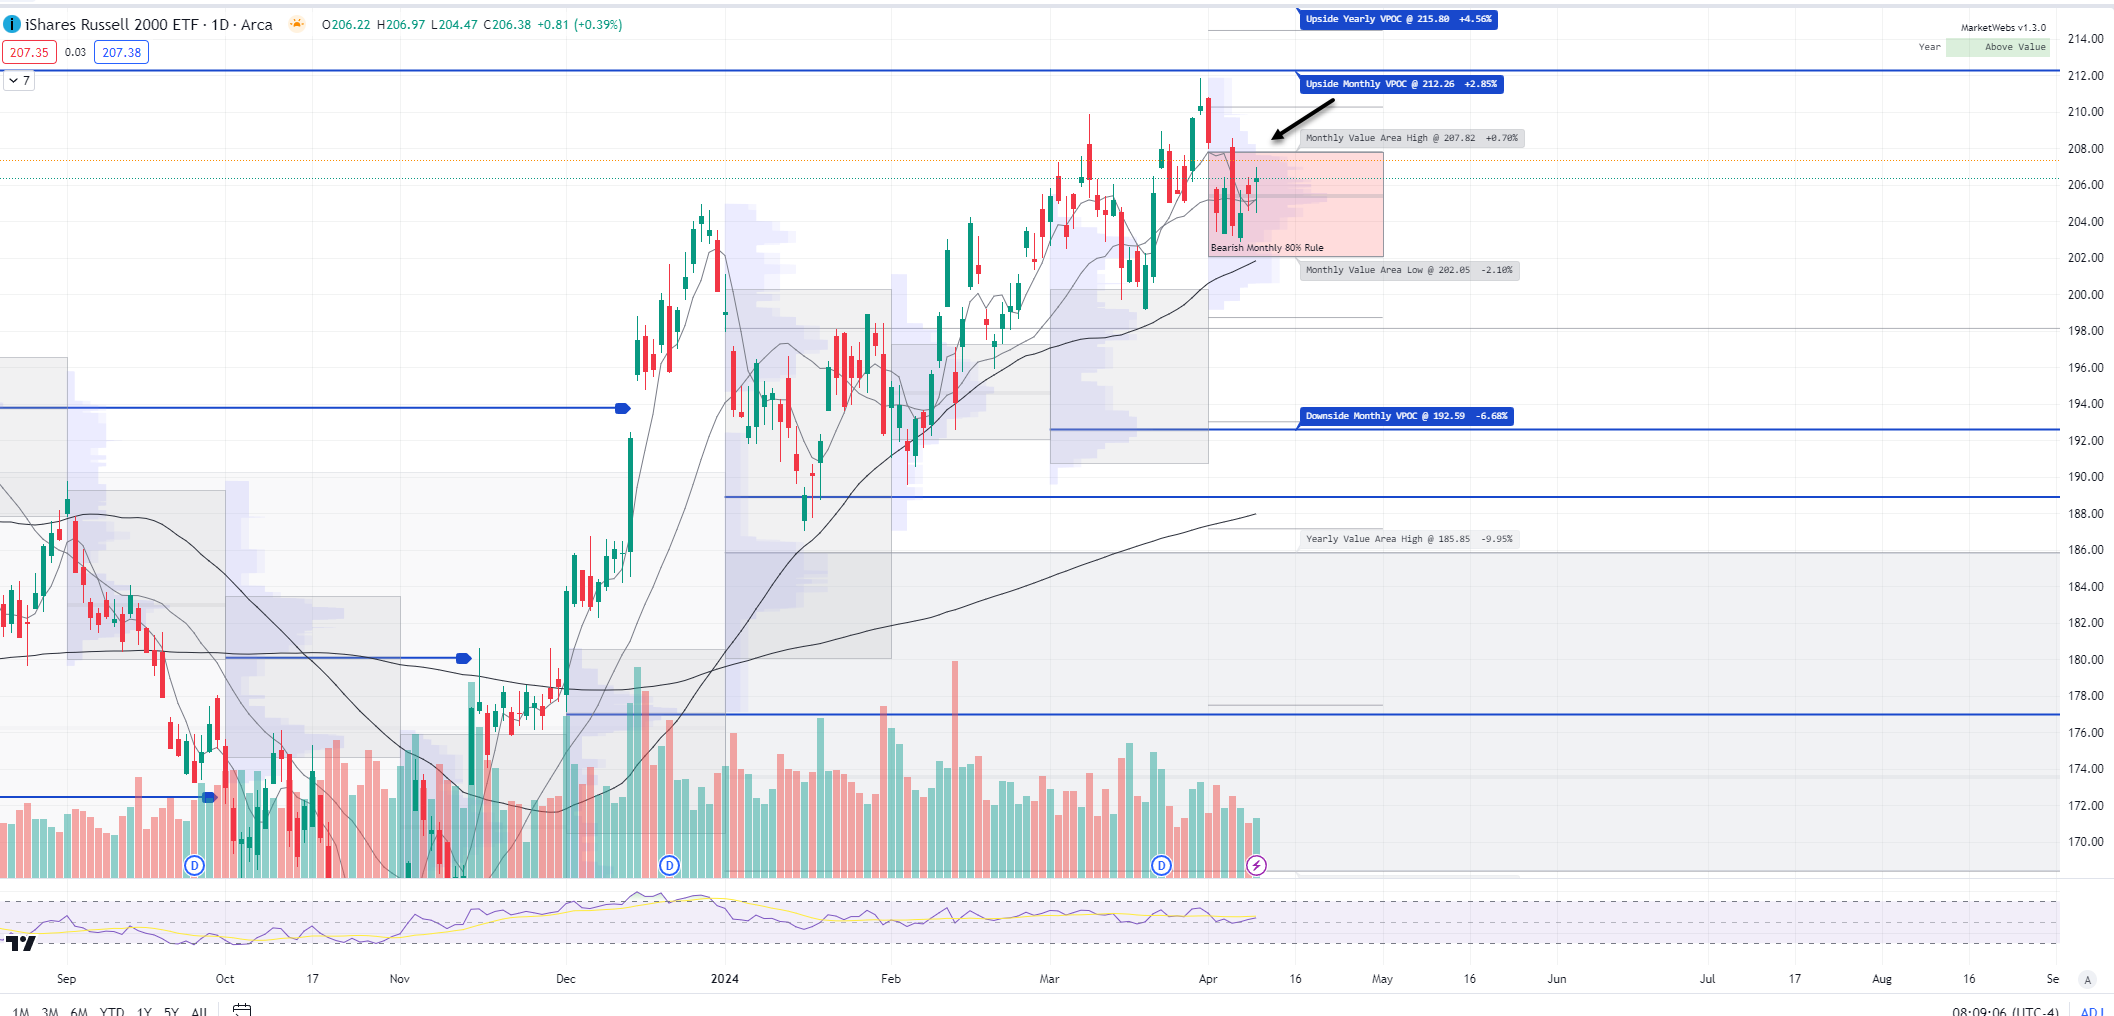
IWM - Russell Small Cap ETF- Price outperforming (+0.4%) ahead of this morning's CPI report and moving closer to the Apr top of Value Area, resistance to watch $207.8
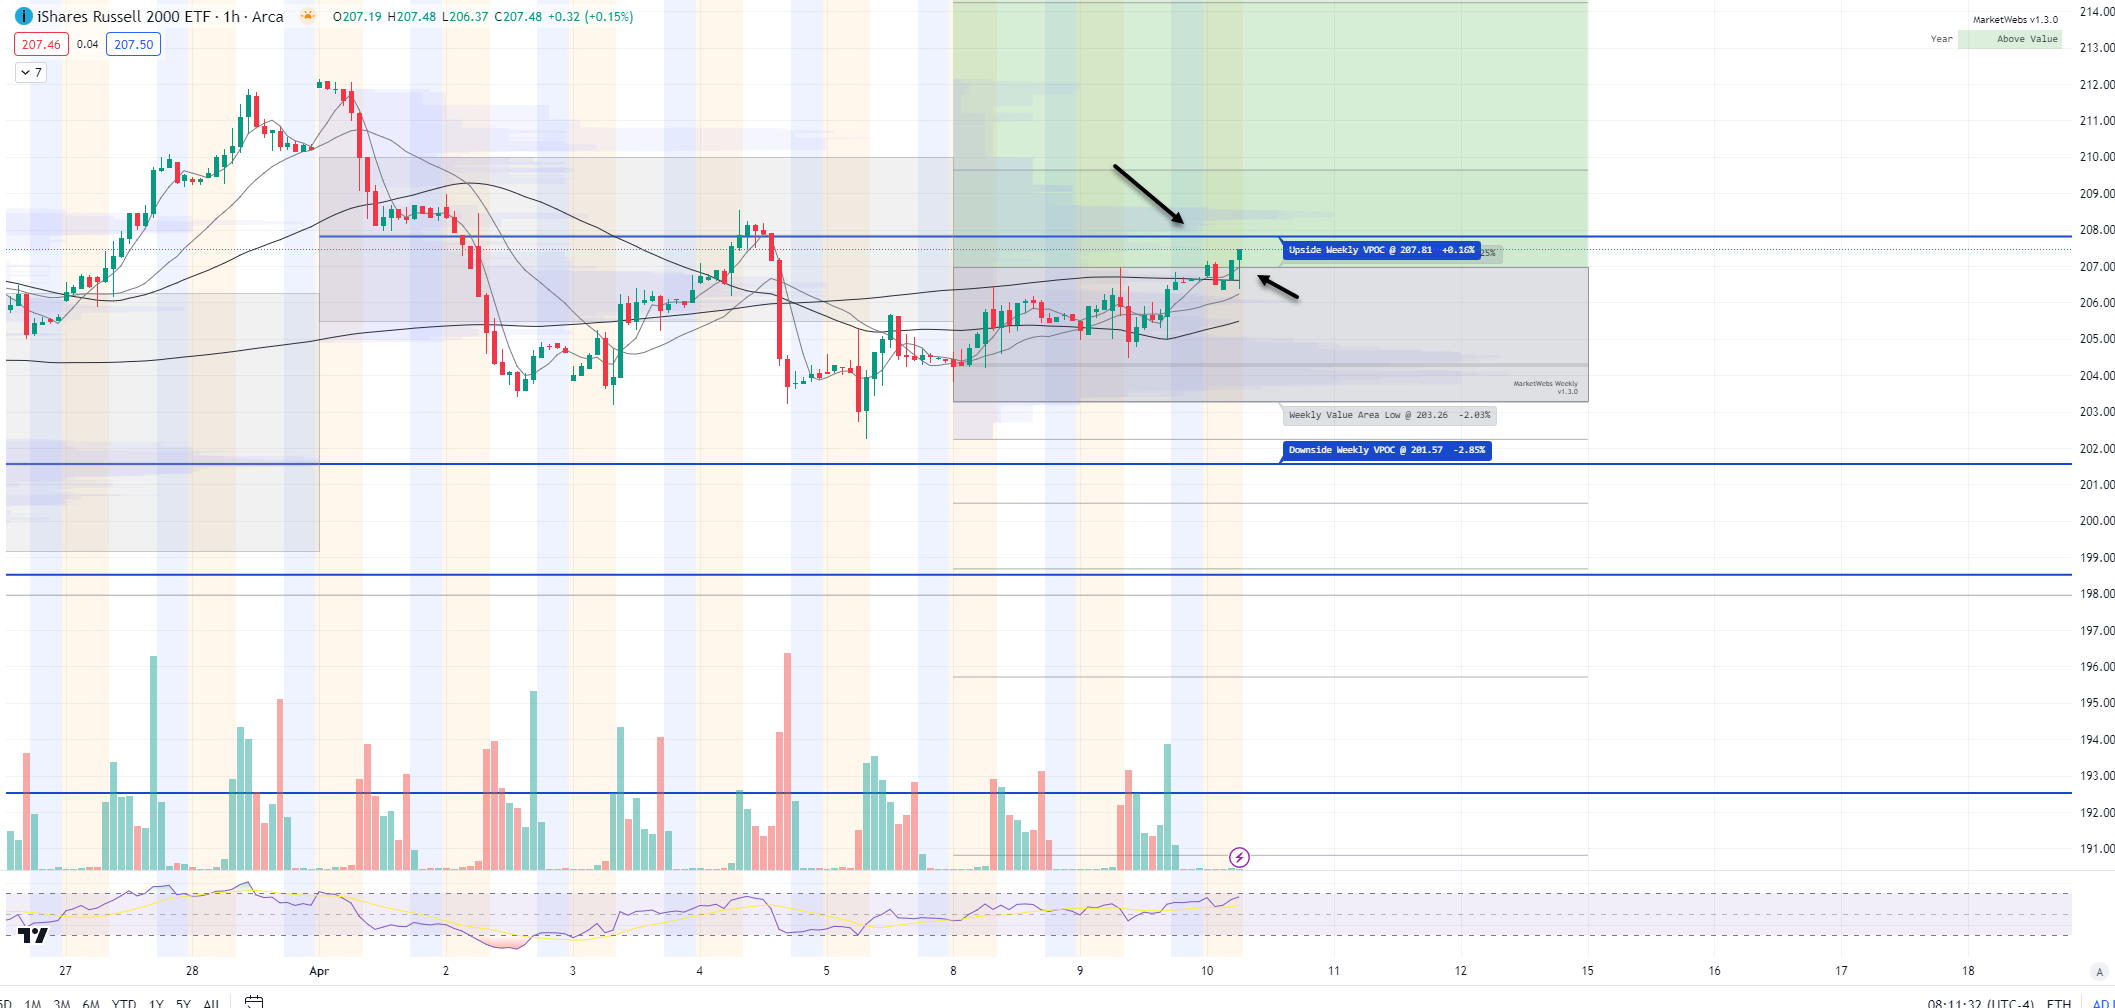
1hr chart: Price moving above its Value Area for week, watch $207.81 upside VPOC
Here is today’s TTG Proprietary Stock Screen “Out of the Box” using Volume At Price
names trending above their Value Areas (on 3 multiple timeframes & not super extended)
Keep reading with a 7-day free trial
Subscribe to The Tribeca Trade Group to keep reading this post and get 7 days of free access to the full post archives.