TTG Index Charts & Out of the Box Stock Screen 6/8/23 $HON $JPM
Out of the Box MarketWebs Screen
Index Updates
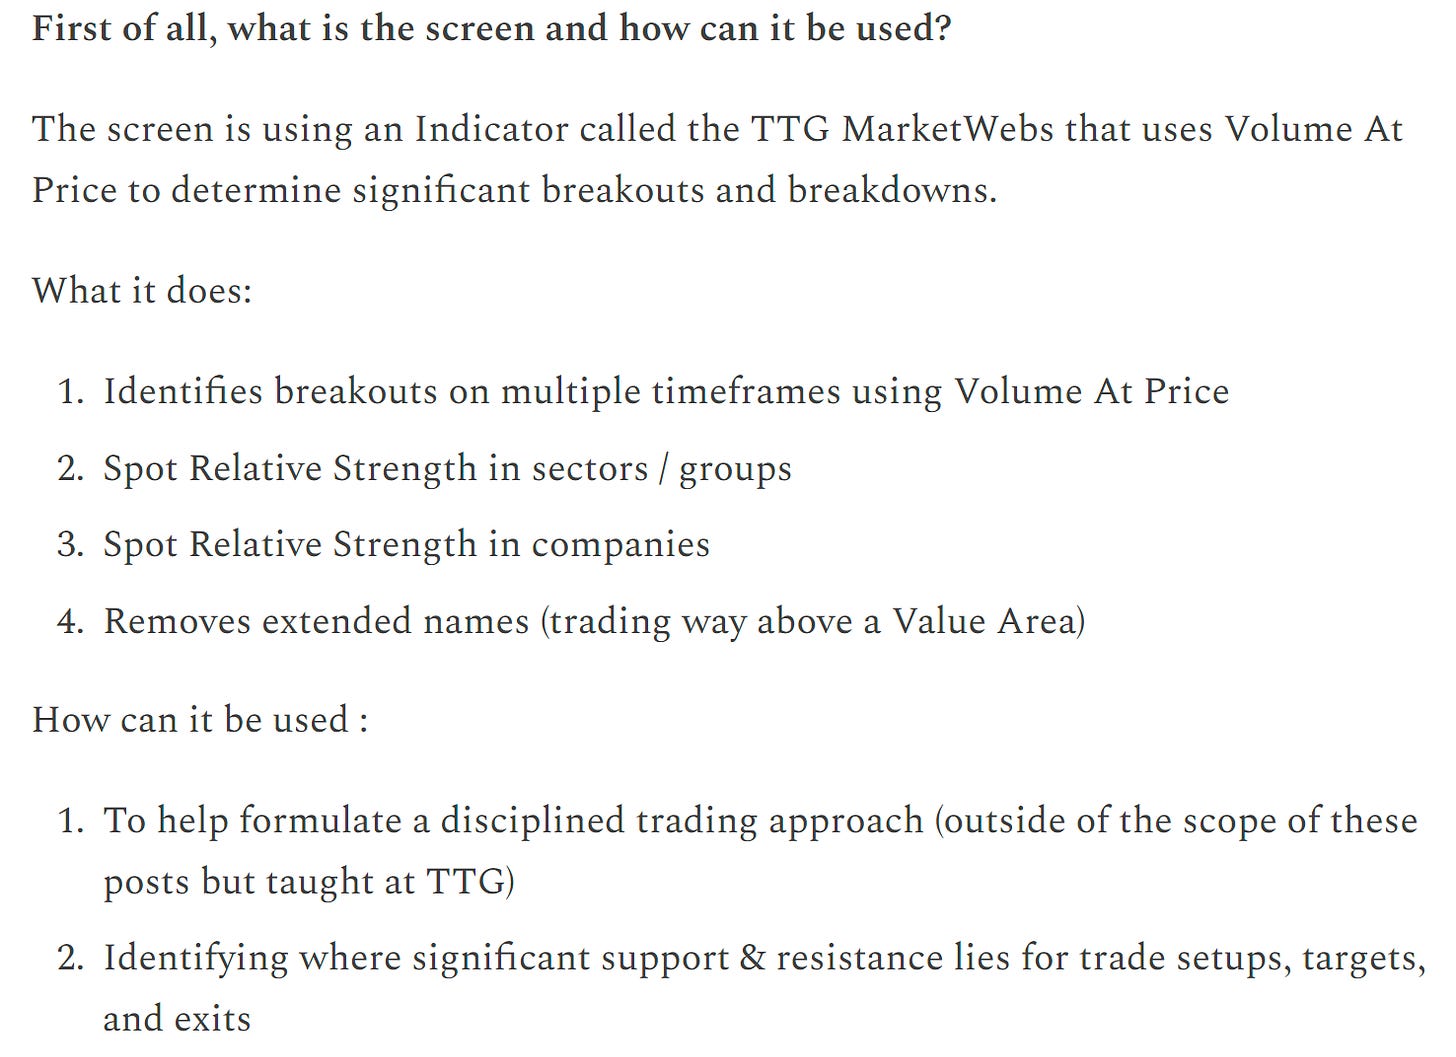
At TTG, I use Volume At Price in my chart analysis and I use the MarketWebs Indicator to provide Value Areas which indicate significant support & resistance levels. Learn More Here about Volume At Price and the MarketWebs.
US Dollar -0.3% / 30yr Bonds -0.5% / Crude +0.9% & Nat Gas +1.3% Copper -0.1% / Cryptos are slightly lower BTC -0.3%
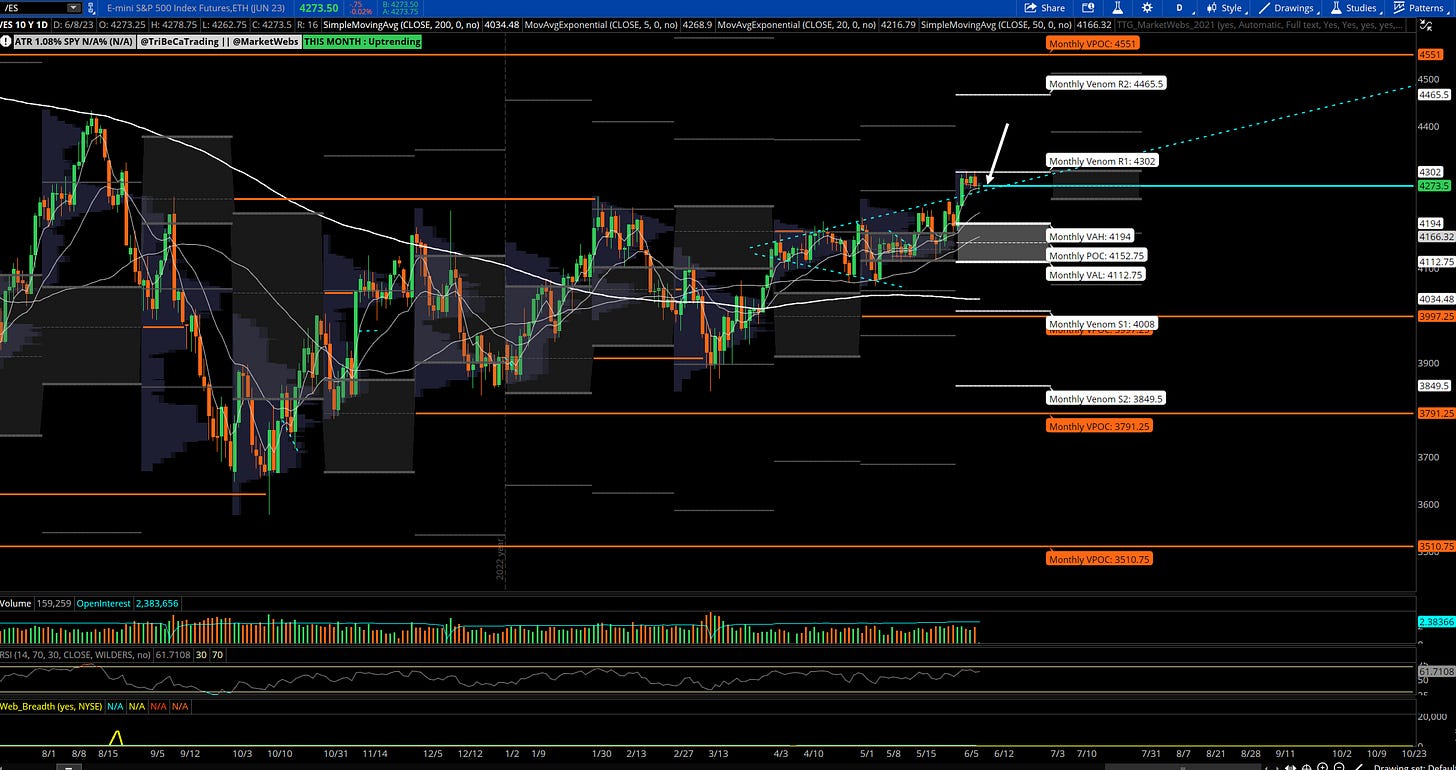
$ES_F - S&P futures - Daily chart: All the rotation between IWM and QQQ and SPY in the middle of that and has not moved much. Note, when there is rotation into the Small Caps, the SPY usually falls a bit b/c the higher weights (mega caps) can really push around the S&P. For now, watch the 5d EMA and trend line
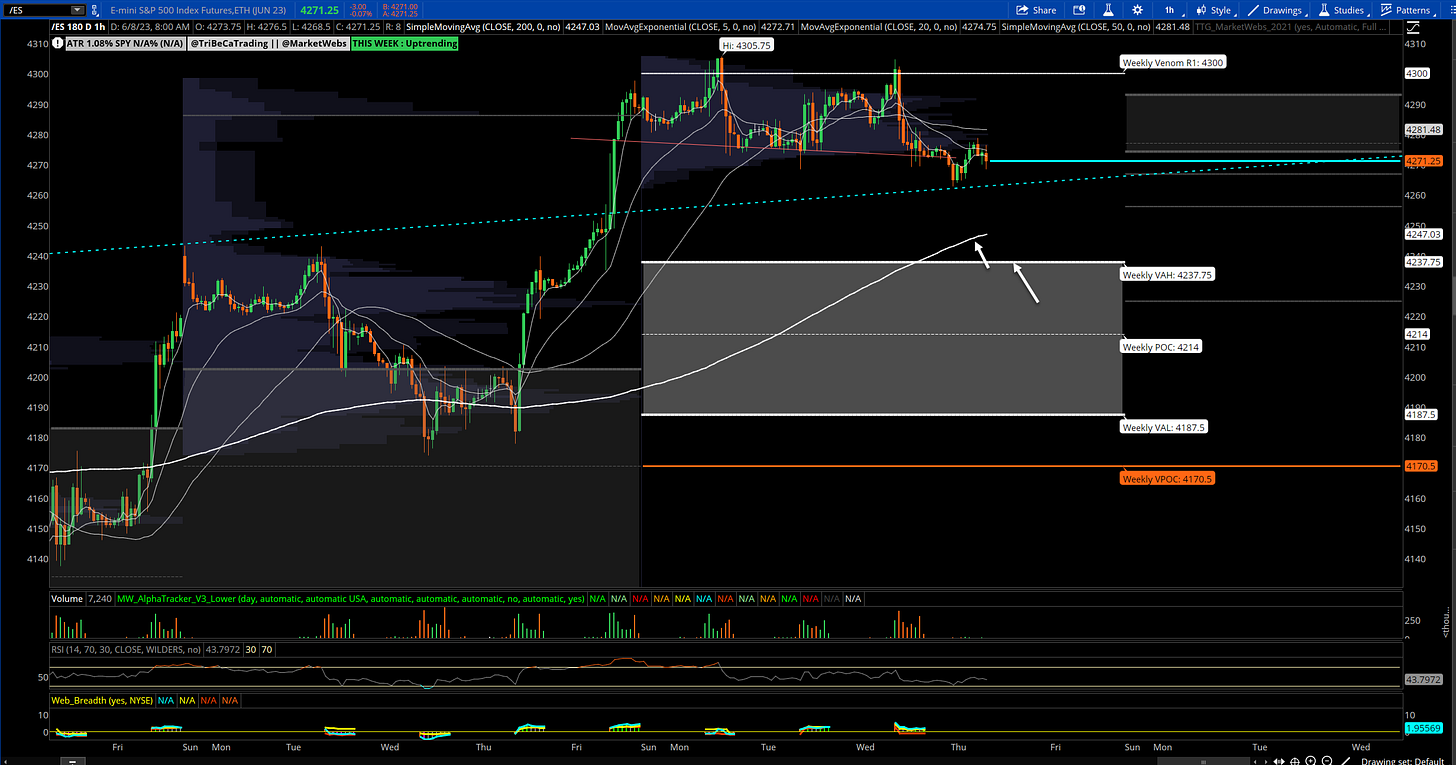
1hr chart: Price remains above its Value Area for the week
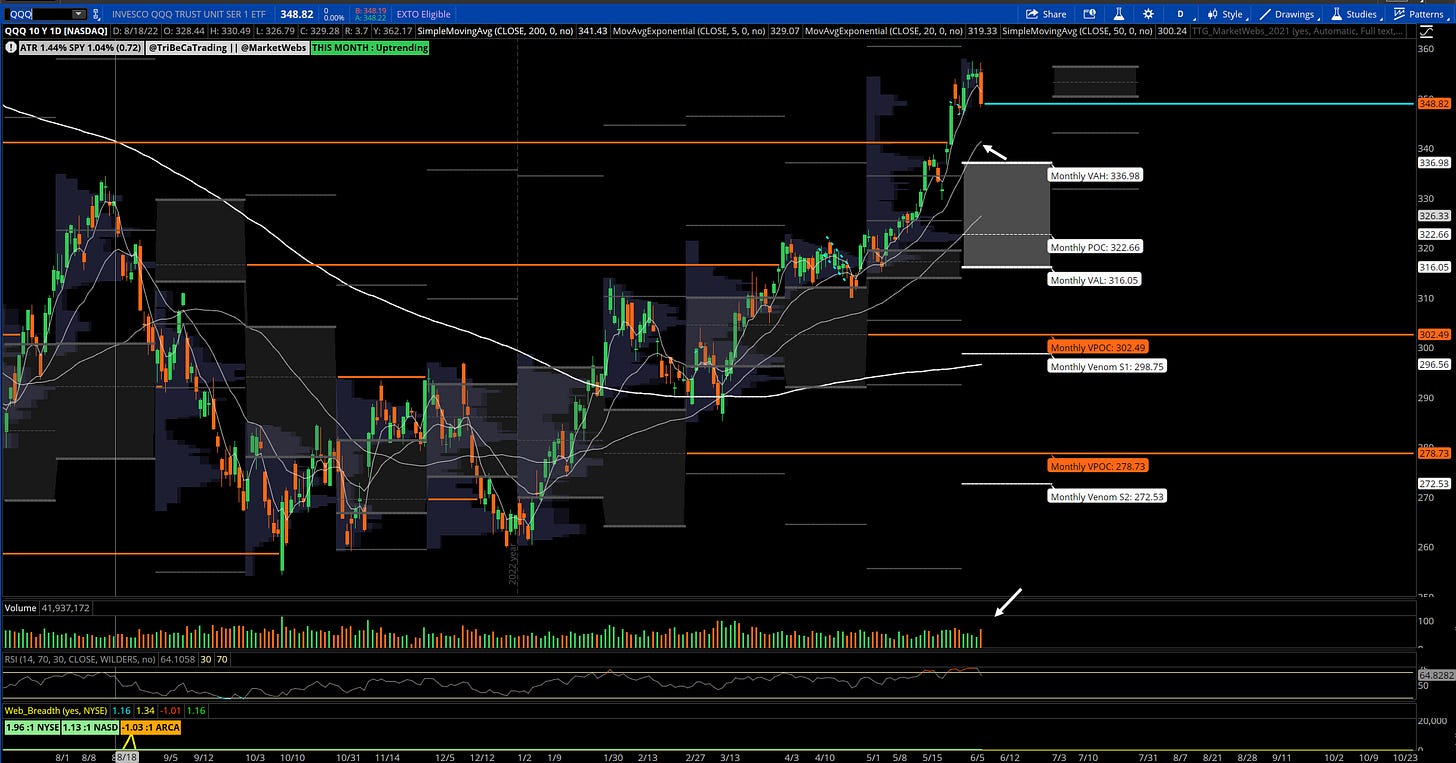
QQQ - NDX - Daily chart: A decent change in picture after yesterday's reversal - price now below its 5d EMA and no longer overbought on RSI (back down to 64) and will see when buyers come back... my thought is they do, but does not have to be the day after a reversal.. I am watching the 20d EMA and the 5d EMA .
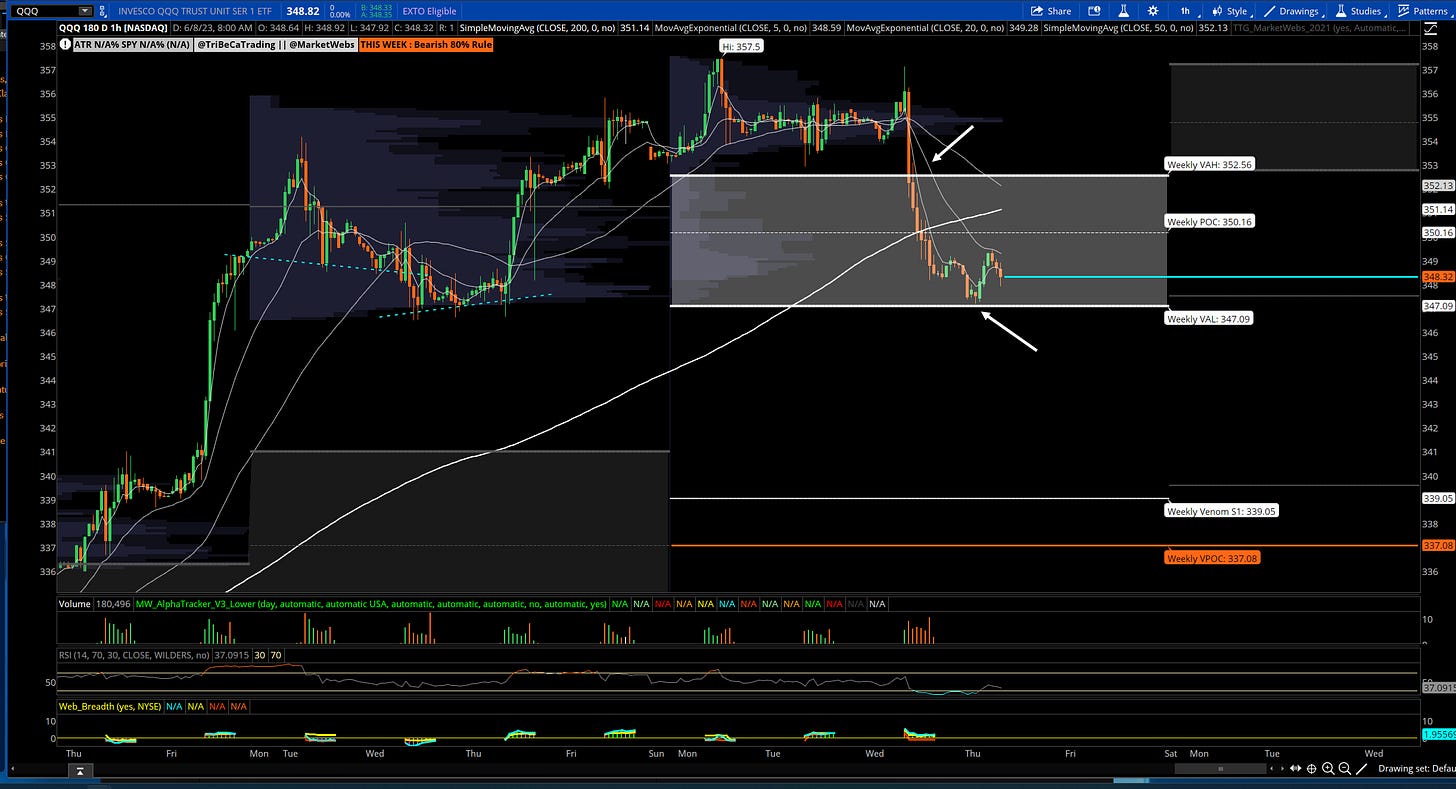
QQQ 1hr: Price traveled through its Value Area & support to watch here is $347.09
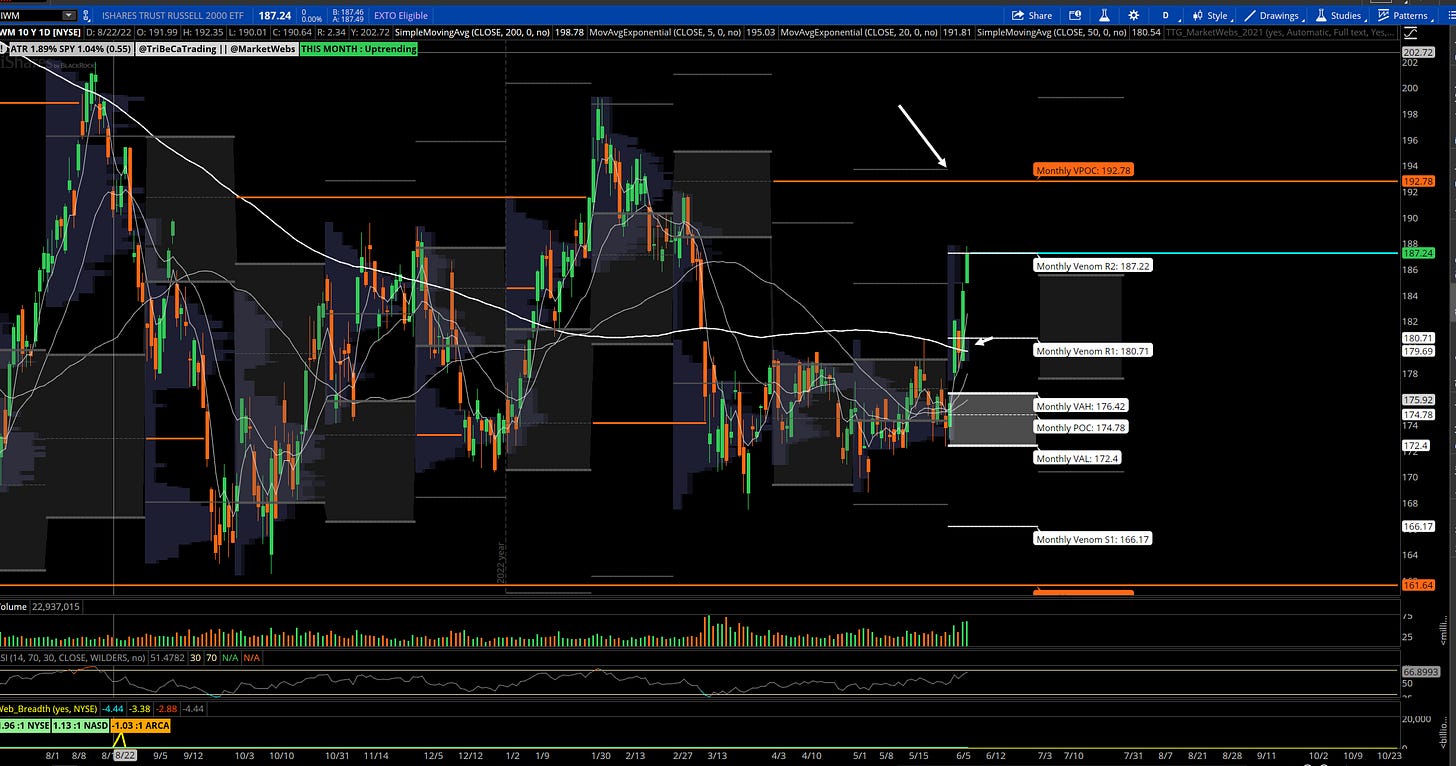
IWM- Russell Small Cap ETF- Daily Chart: Impressive move last few days on strong volume. Price pausing at R2 extension from the June Value Area at $187.28, next level up is $192.77 VPOC
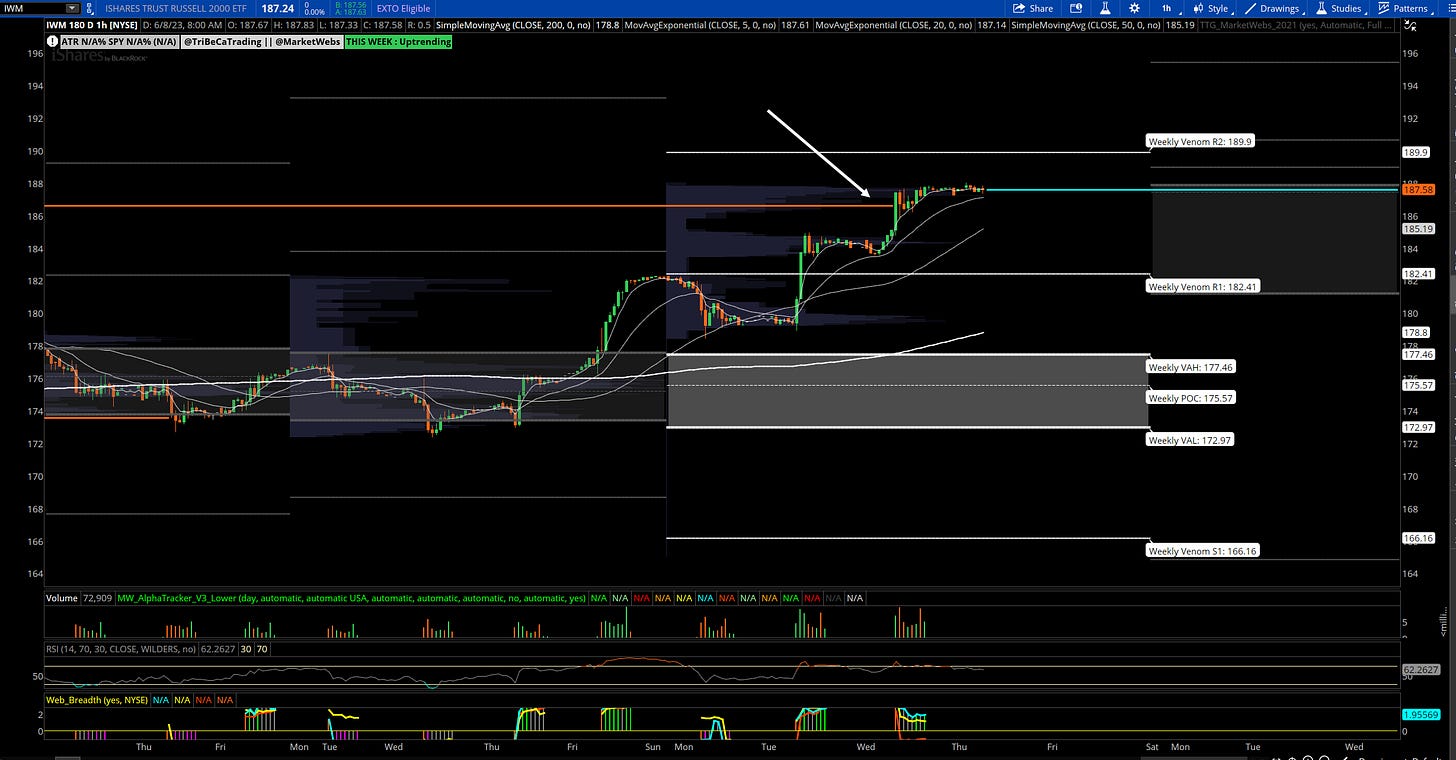
1hr chart: Price took out upside VPOC and pausing aa bit
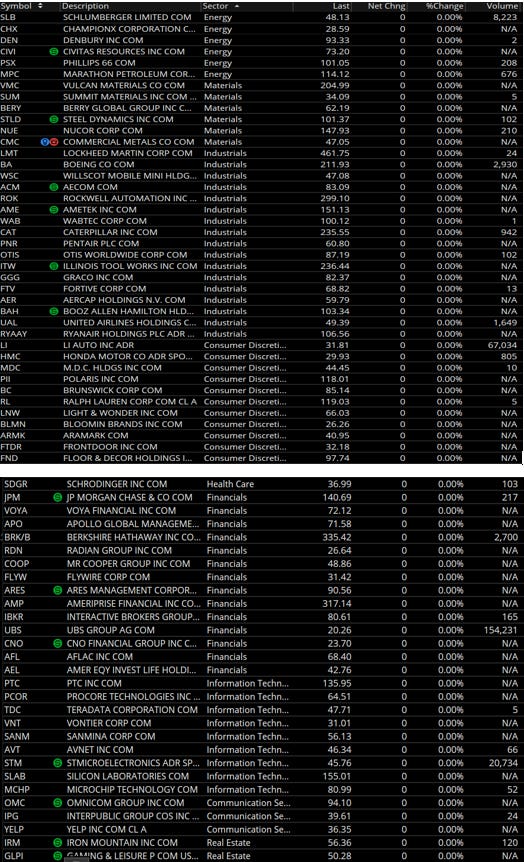
Here is today’s TTG Proprietary Stock Screen “Out of the Box” using Volume At Price
Remember, I am only showing a few setups from the list here and review more in the TTG Trading Room. I provide a more detailed watchlist every weekend to start the week at TTG.
Charts
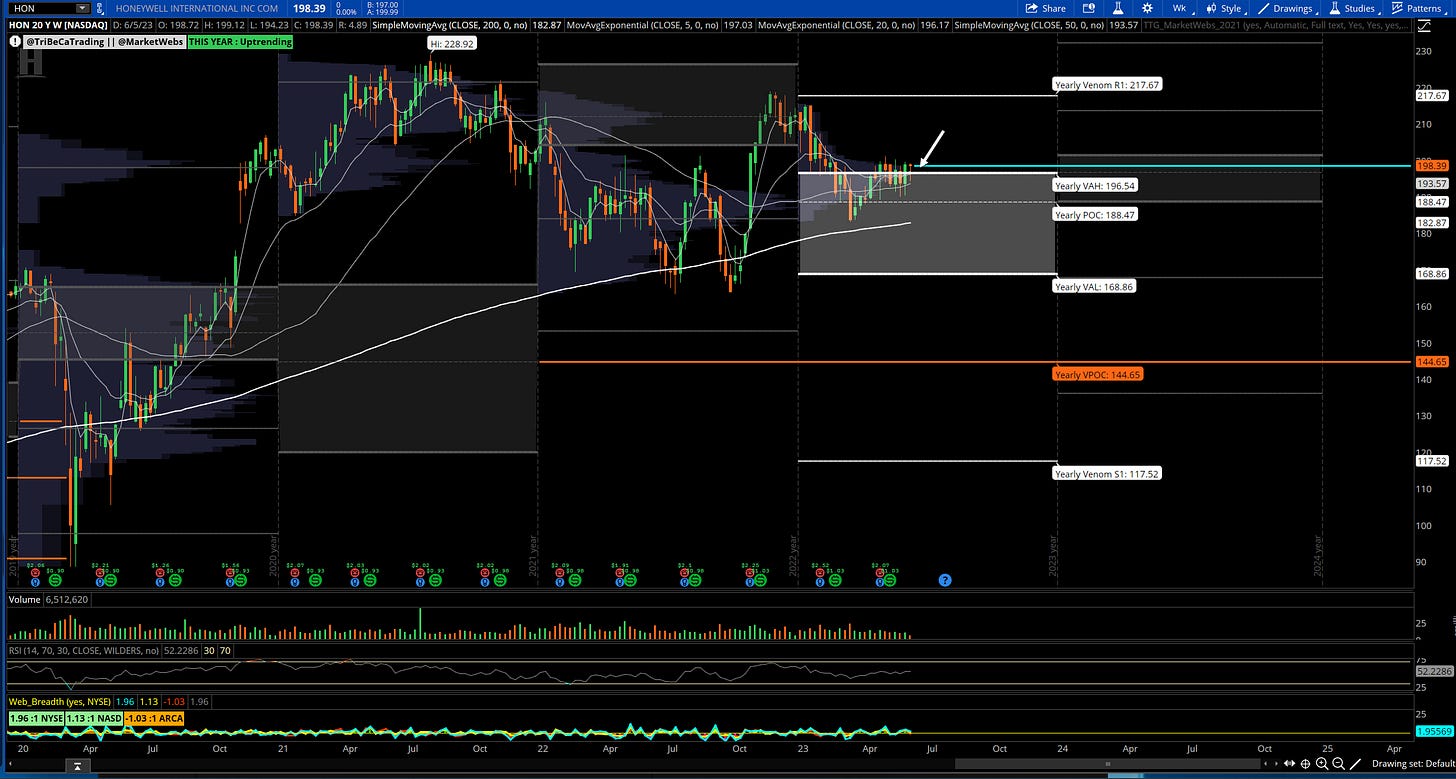
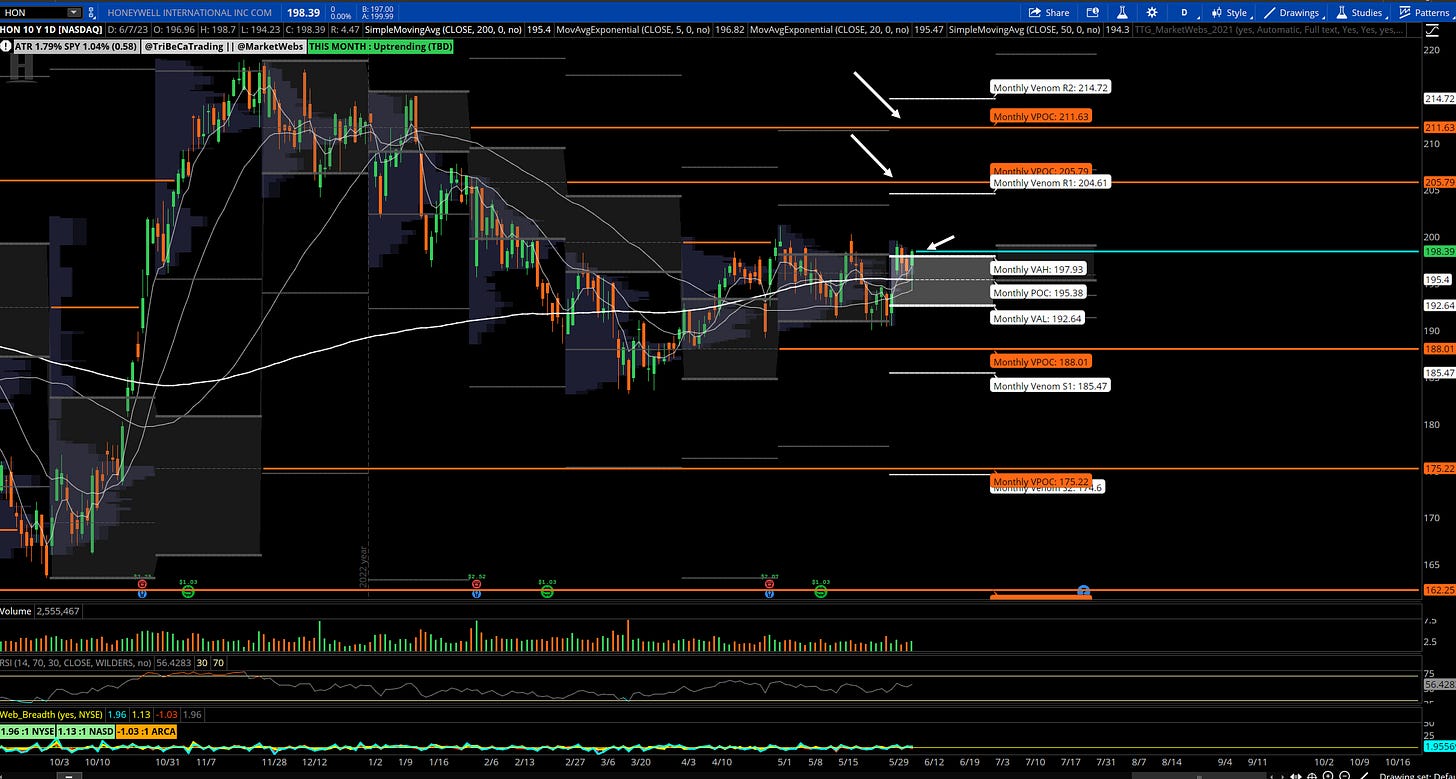
HON Weekly & Daily chart
Honeywell International Inc. is a worldwide technology and manufacturing company. The Company provides aerospace products and services, control, sensing and security technologies for commercial buildings, safety and productivity solutions, specialty chemicals, advanced materials, process technology for refining and petrochemicals, and energy efficient products and solutions.(Bloomberg)
-suggested stop price $195 using the TTG MarketWebs
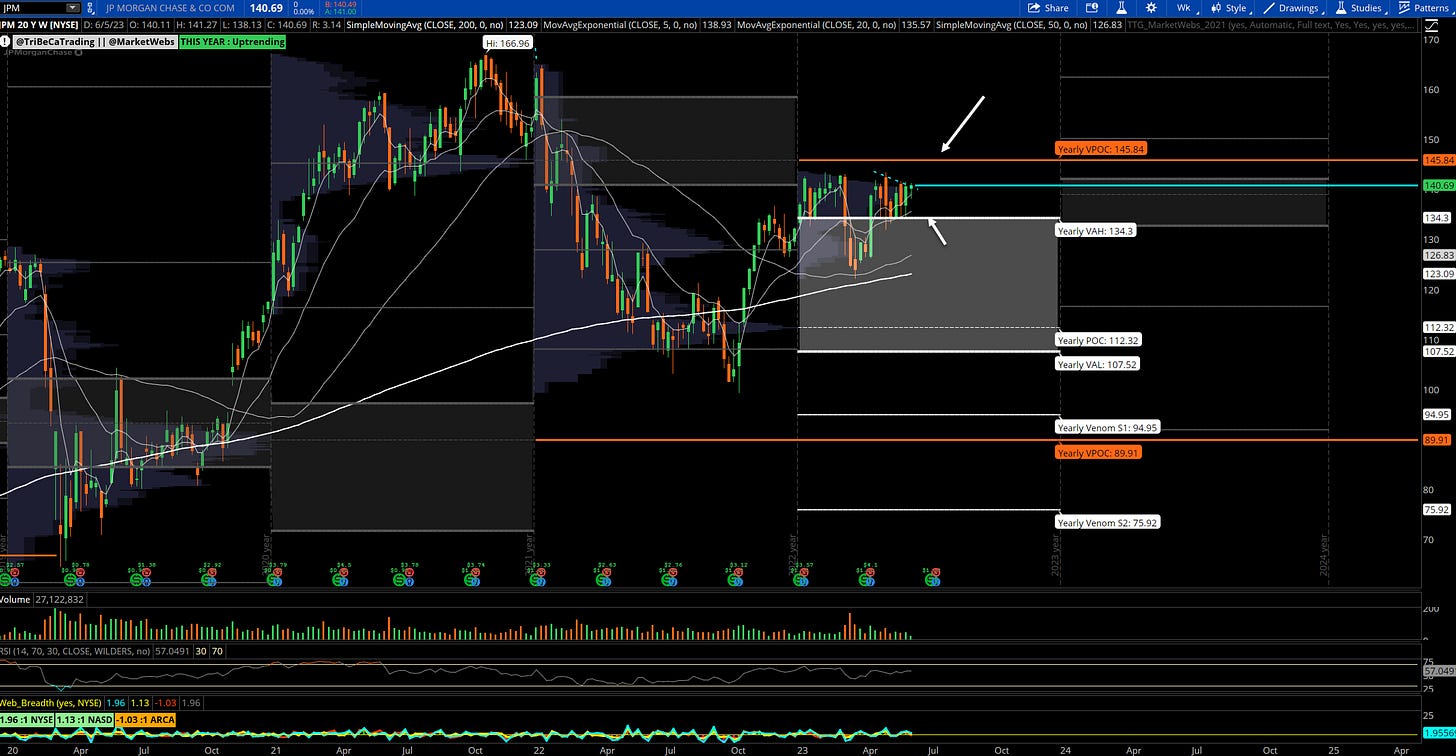
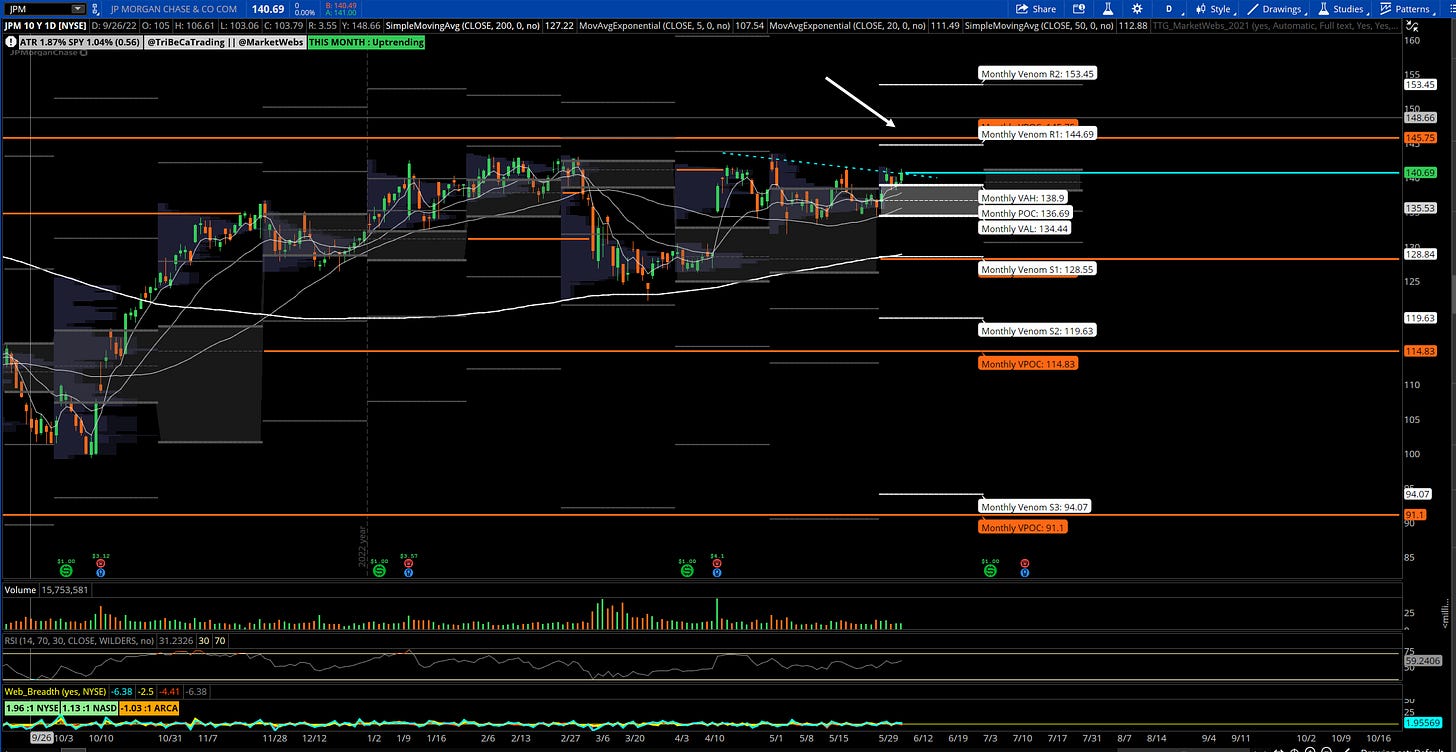
JPM Weekly & Daily chart
JPMorgan Chase & Co. provides global financial services and retail banking. The Company provides services such as investment banking, treasury and securities services, asset management, private banking, card member services, commercial banking, and home finance. JP Morgan Chase serves business enterprises, institutions, and individuals. (Bloomberg)
- suggested stop price $137 using the TTG MarketWebs
Remember, this is just one type of screen / setup that I focus on in my analysis!
Copyright © Tribeca Trade Group. All of the information in this newsletter is for entertainment and educational purposes only and is not to be construed as investment or trading advice. None of the information in this newsletter is guaranteed to be accurate, complete, useful or timely. IMPORTANT NOTICES AND DISCLAIMERS TriBeCa Trade Group is not an investment advisor and is not registered with the U.S. Securities and Exchange Commission or the Financial Industry Regulatory Authority. Further, owners, employees, agents or representatives of TriBeCa Trade Group are not acting as investment advisors and might not be registered with the U.S. Securities Authority


