TTG Index Charts & Out of the Box Stock Screen 6/9/23 $BRKB $RGI
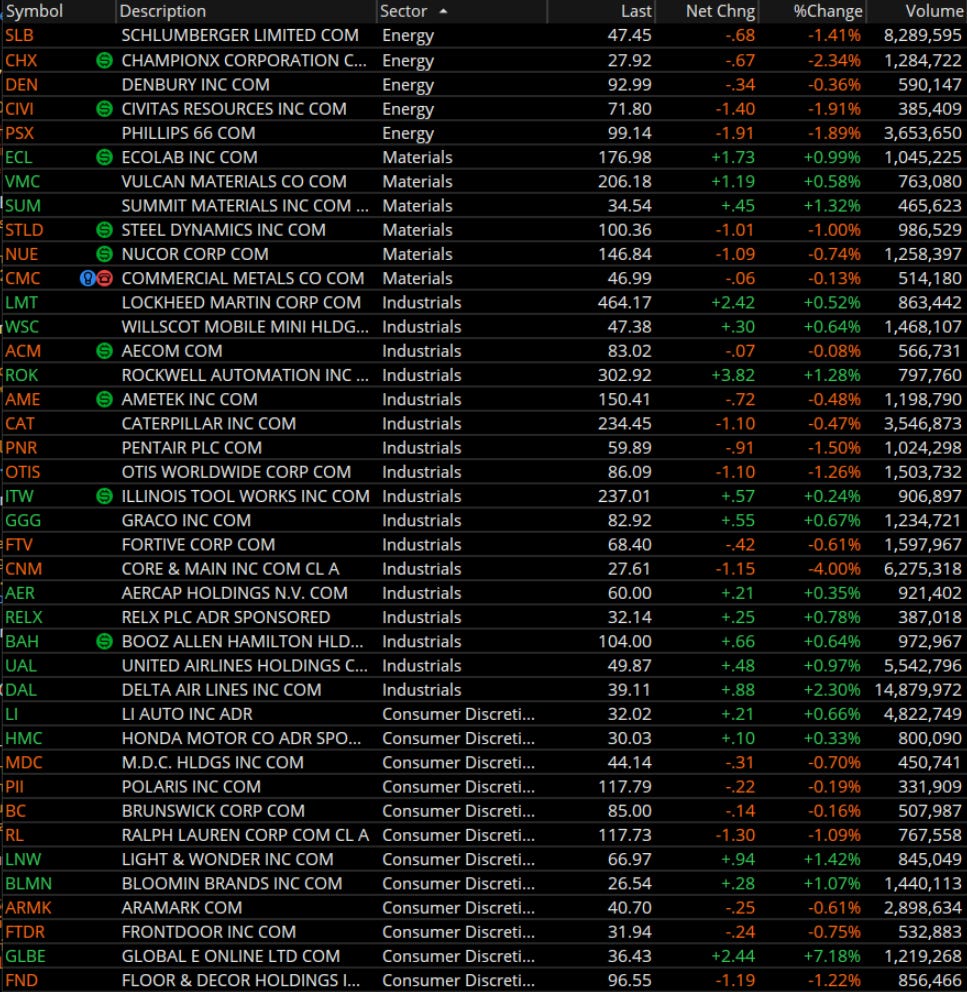
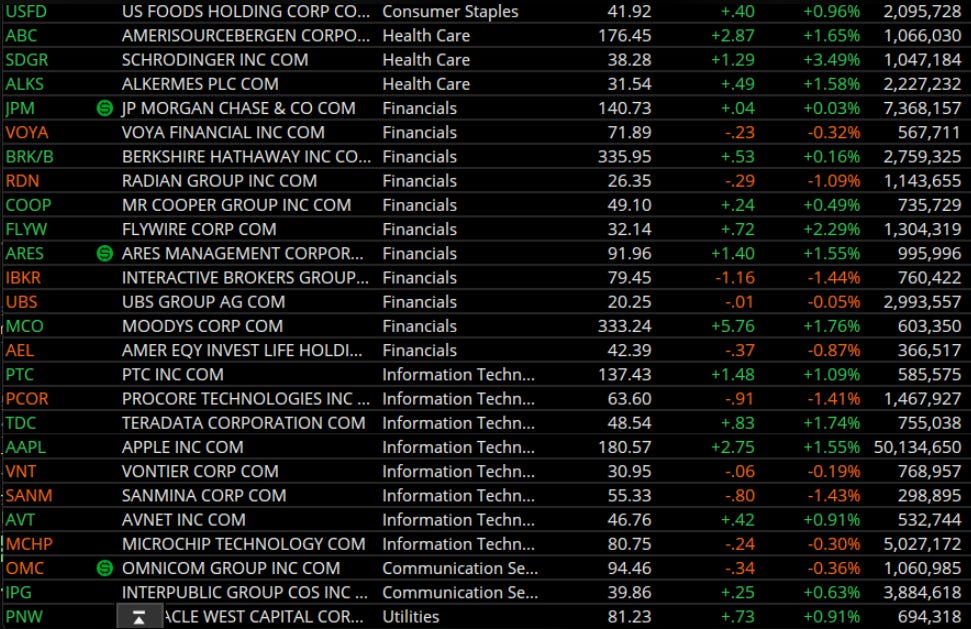
Out of the Box MarketWebs Screen
Index Updates
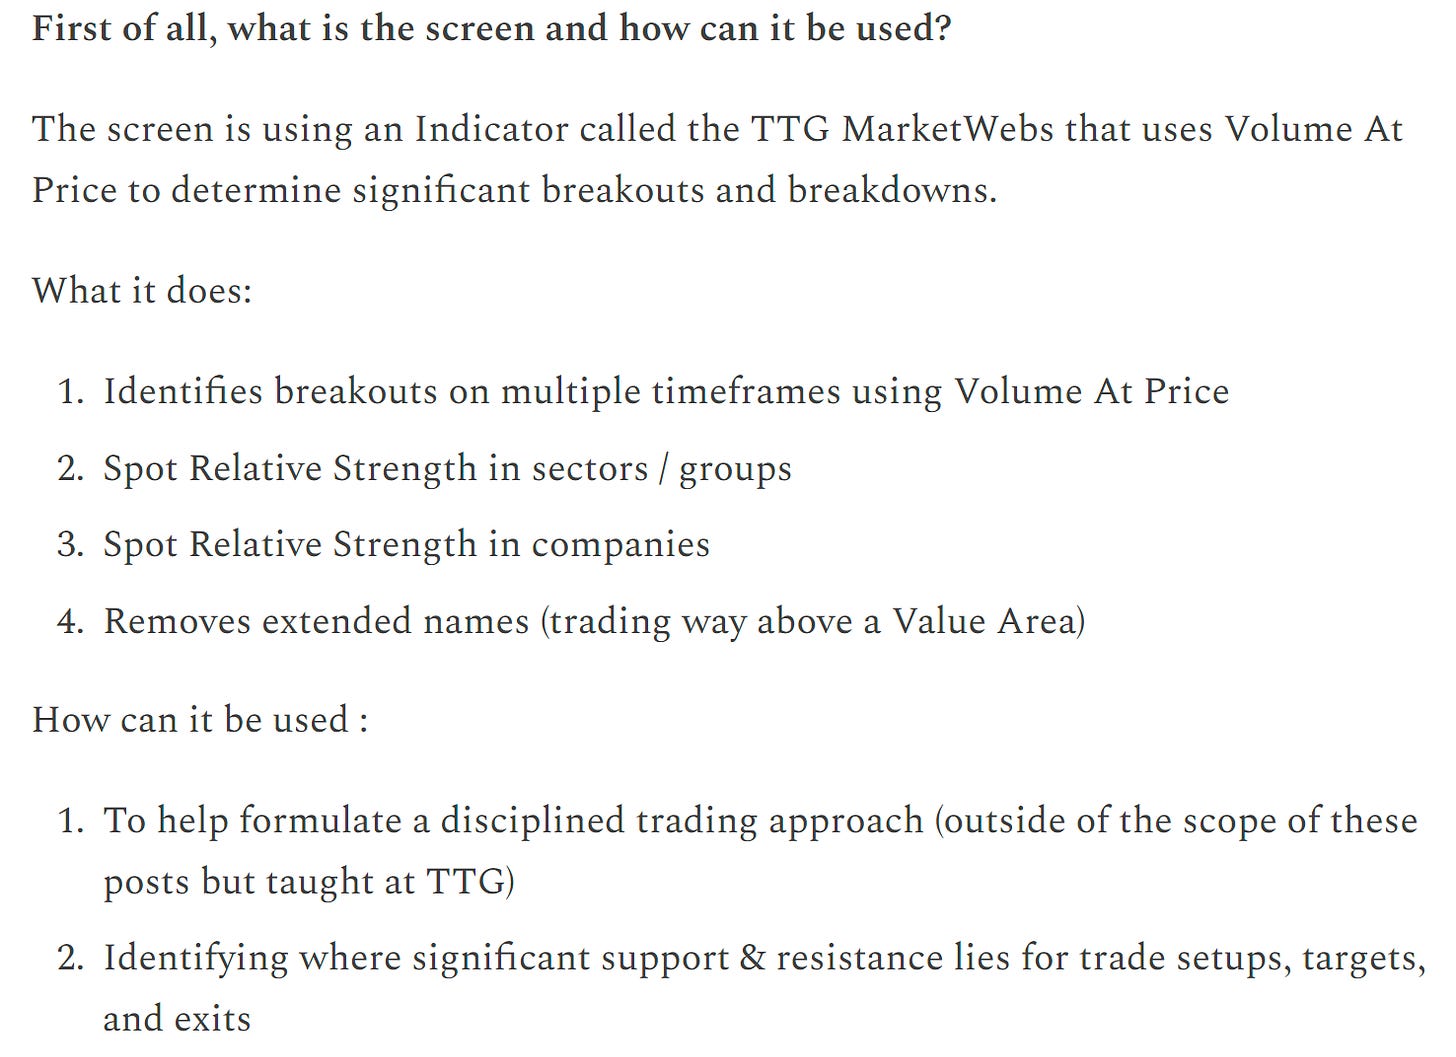
At TTG, I use Volume At Price in my chart analysis and I use the MarketWebs Indicator to provide Value Areas which indicate significant support & resistance levels. Learn More Here about Volume At Price and the MarketWebs.
US Dollar flat / 30yr Bonds -0.5% / Crude +0.4% & Nat Gas -3% Copper +0.9% / Cryptos are slightly higher
TTG End on Day Recap Video:
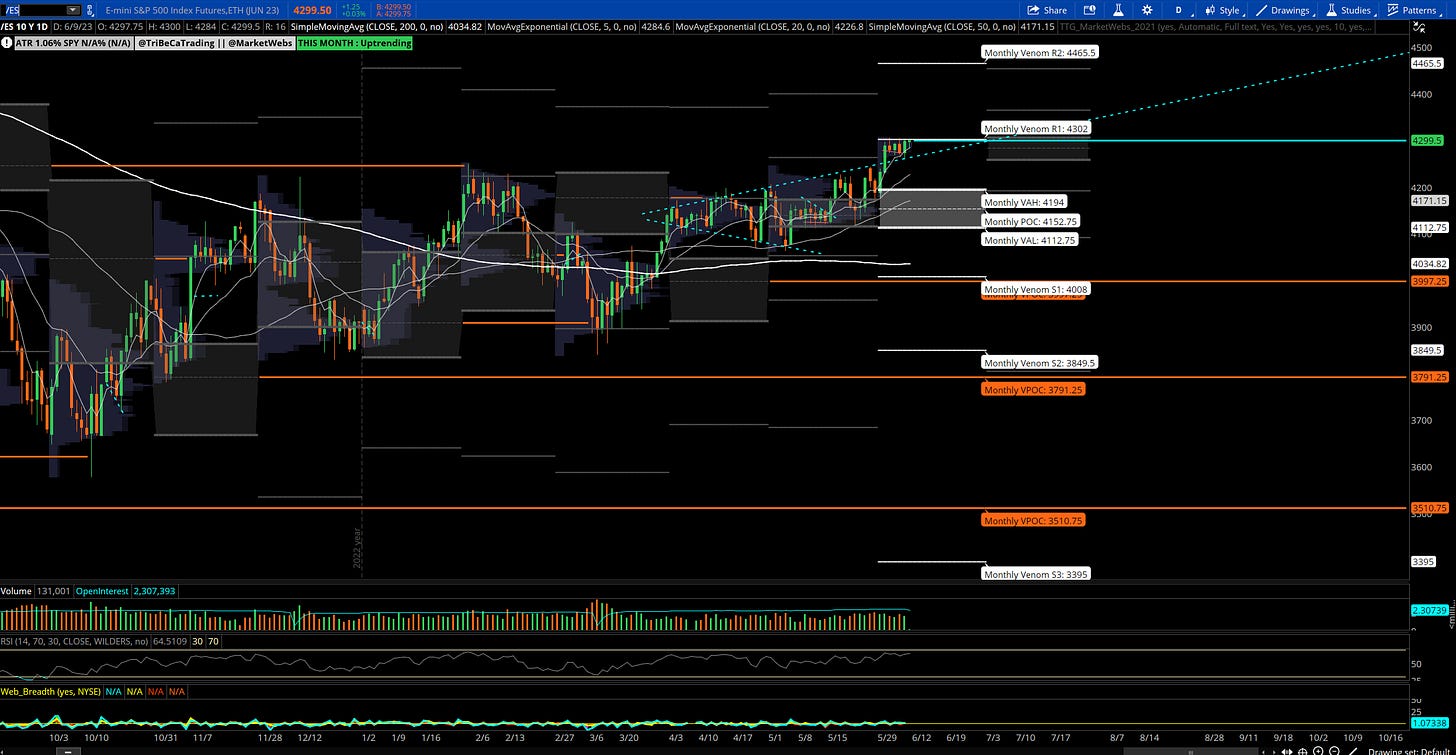
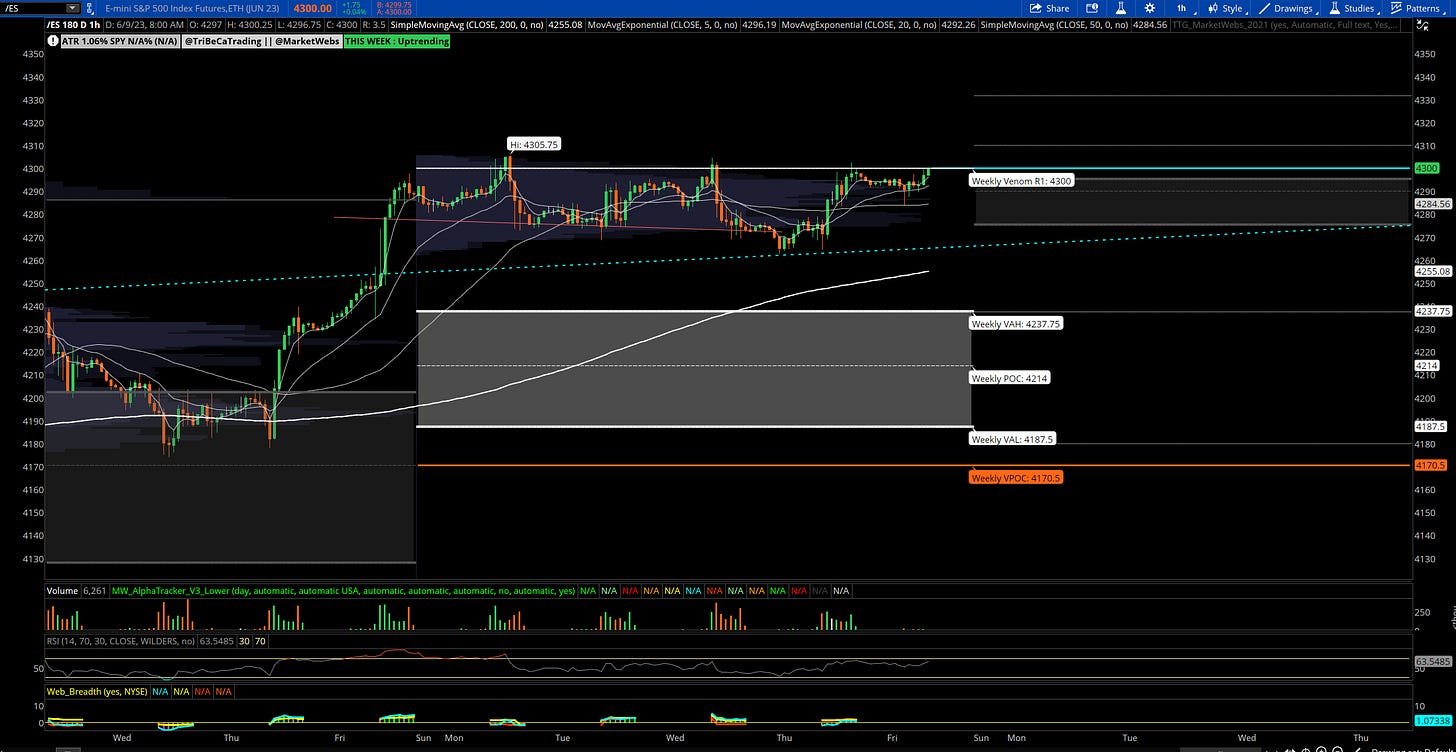
$ES_F - S&P futures - Daily & 1hr chart: Price back to R1 (extension from June Value Area) 4302 and that important 4300 level.. there has been some resistance up there as you can see from 1hr chart
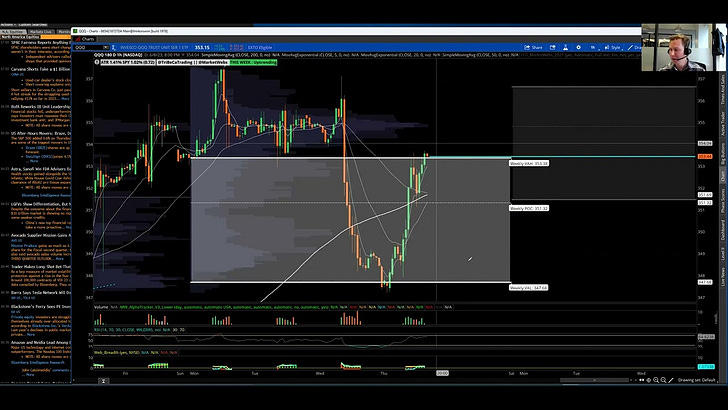
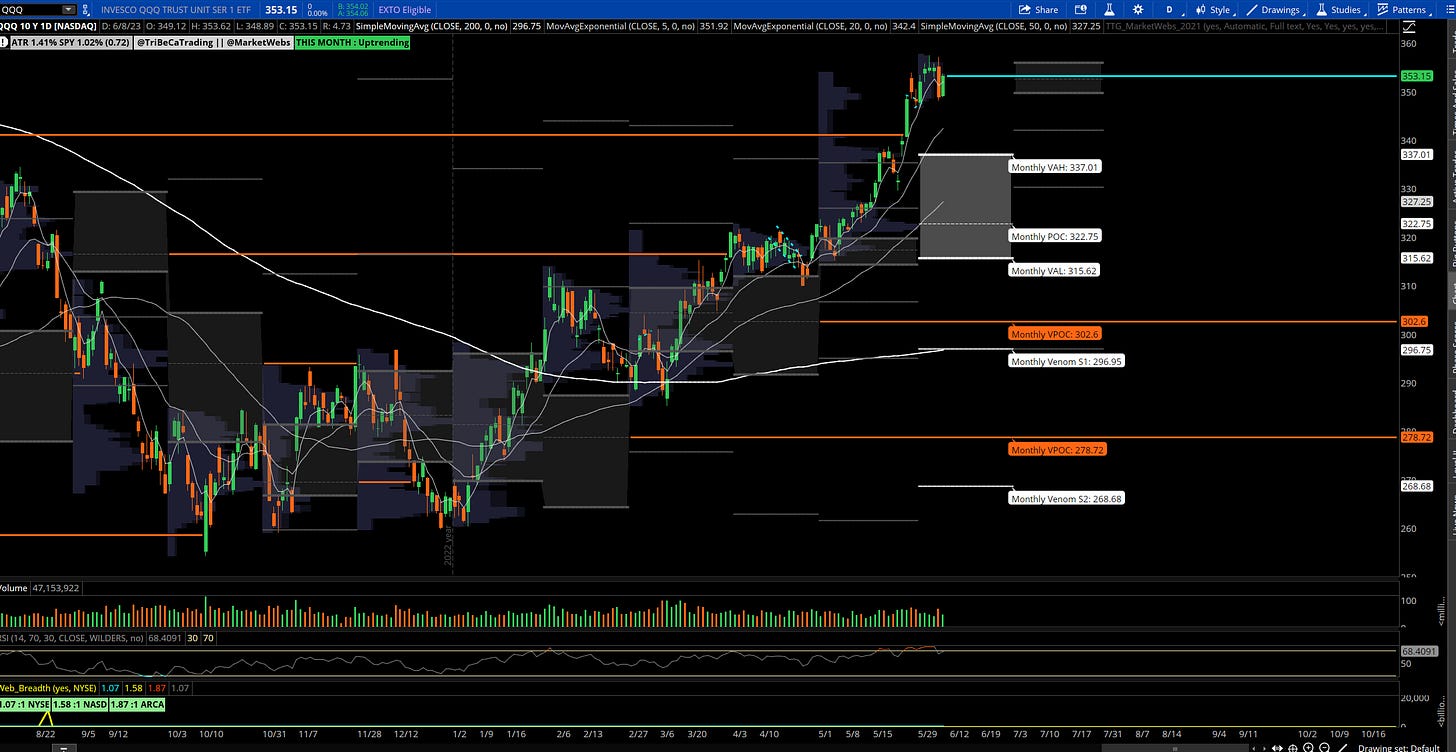
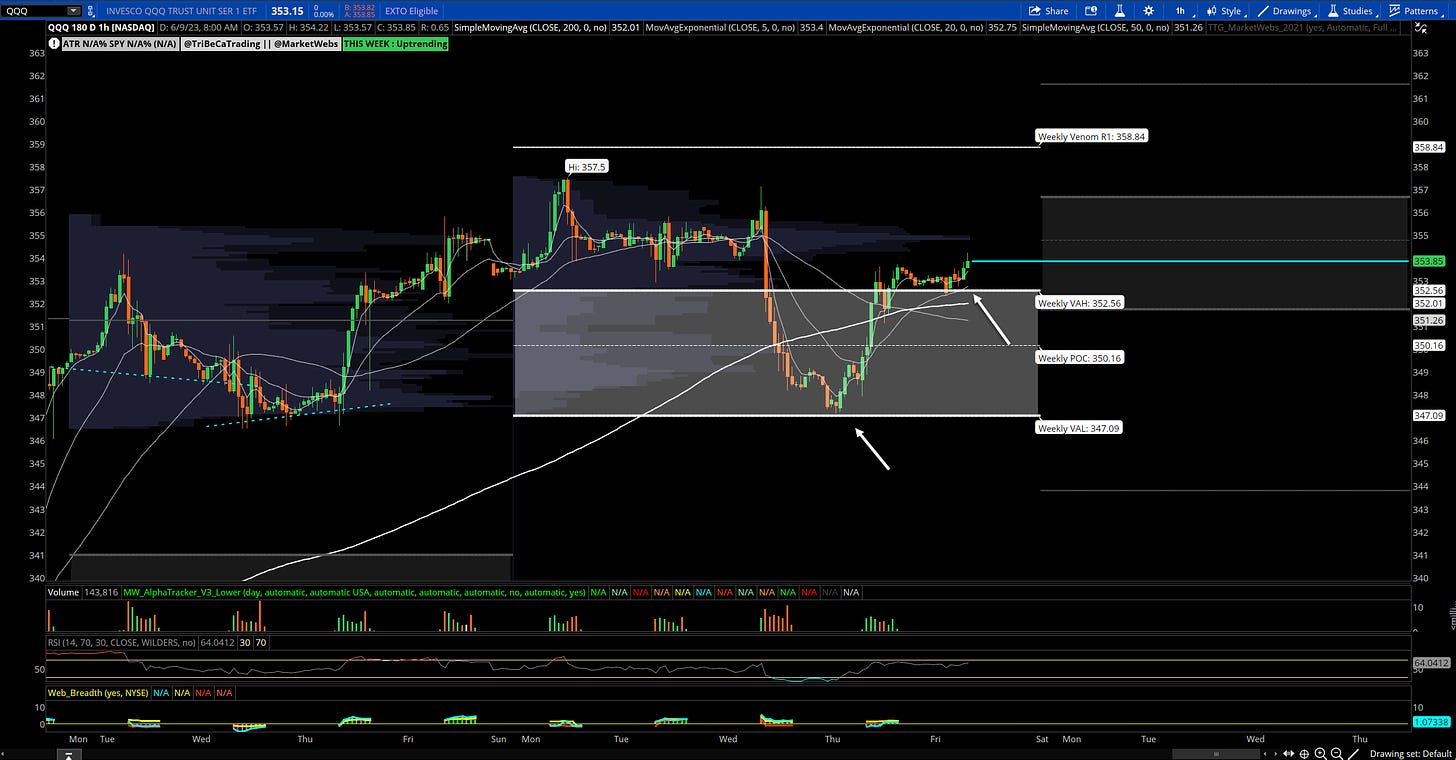
QQQ - NDX - Daily & 1hr chart: Impressive comeback yesterday and price held where it needed to (bottom of 1hr Value Area) $347.09. Price also retook its 5d EMA which is a sign of strength and the super short term trend. On the 1hr chart, watch $352.56 top of this week's Value Area
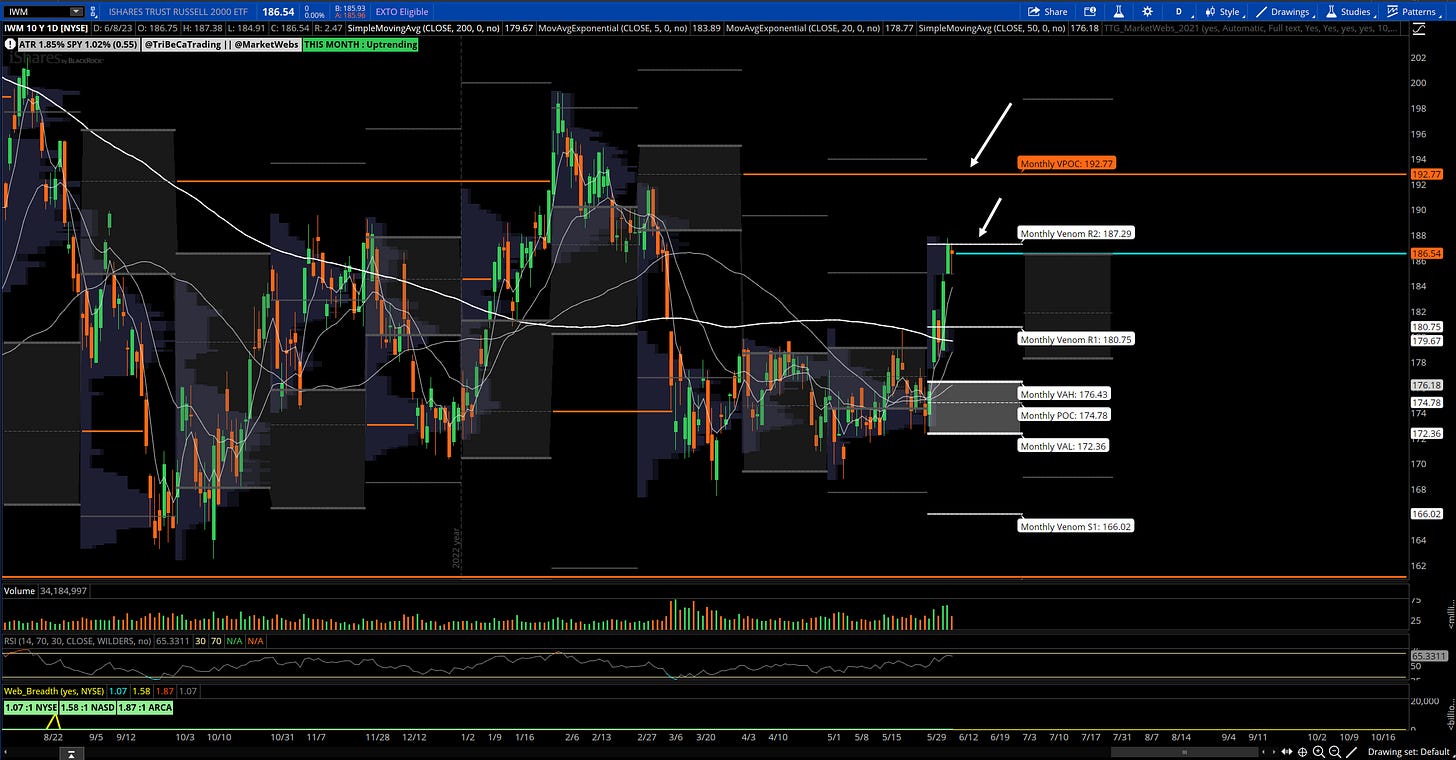
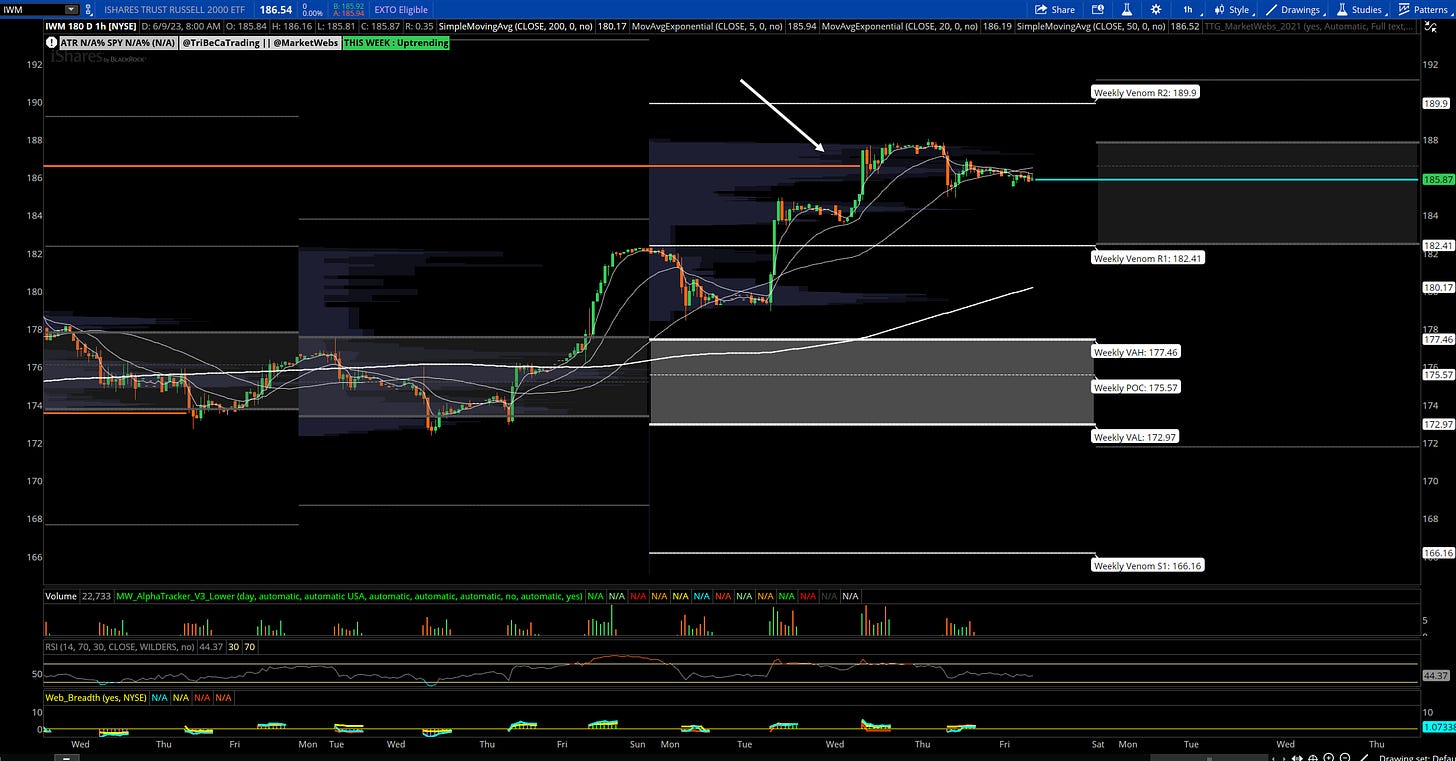
IWM- Russell Small Cap ETF- Daily & 1hr Chart: Price consolidating at that R2 extension from the June Value Area, watch $187.29 & and consolidating around that last 1hr VPOC take out
Here is today’s TTG Proprietary Stock Screen “Out of the Box” using Volume At Price
Remember, I am only showing a few setups from the list here and review more in the TTG Trading Room. I provide a more detailed watchlist every weekend to start the week at TTG.
Charts
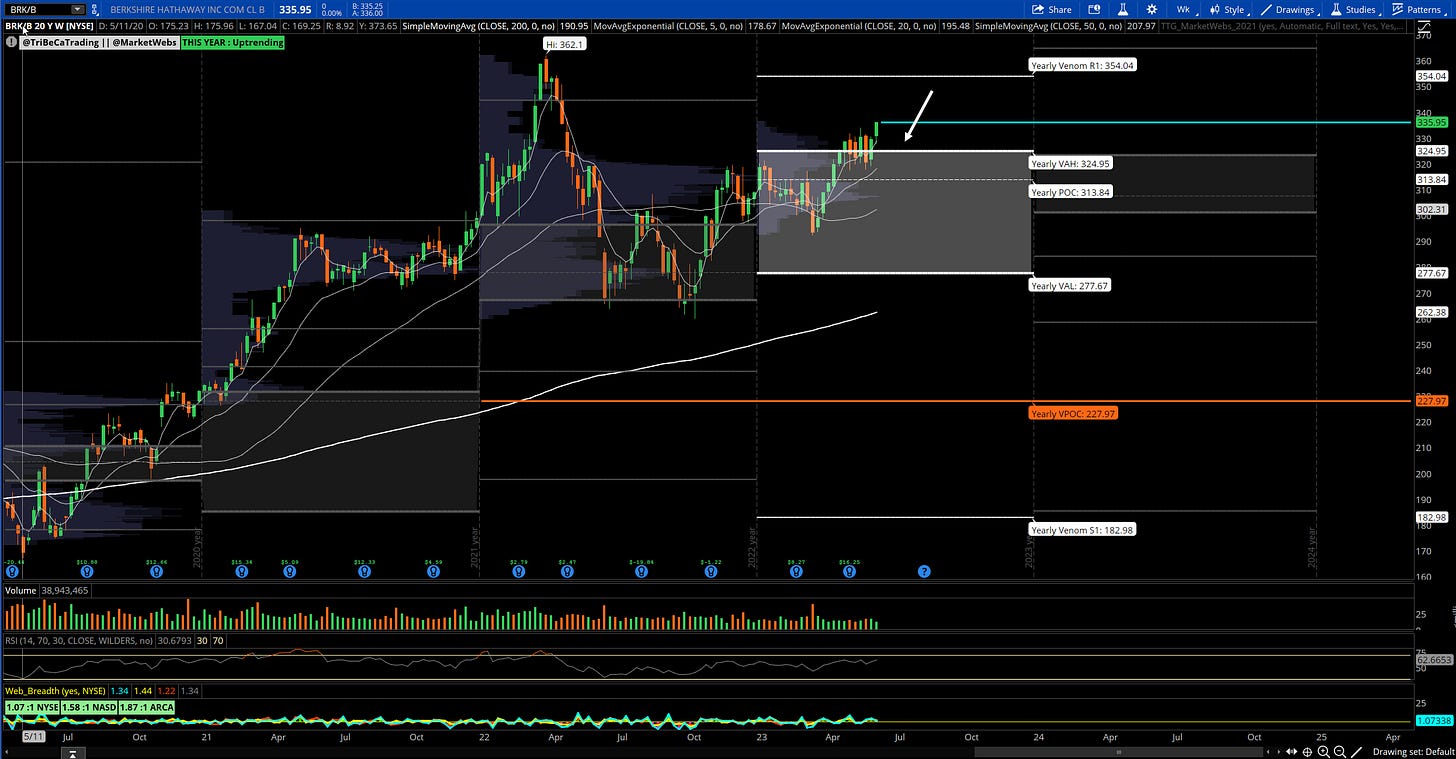
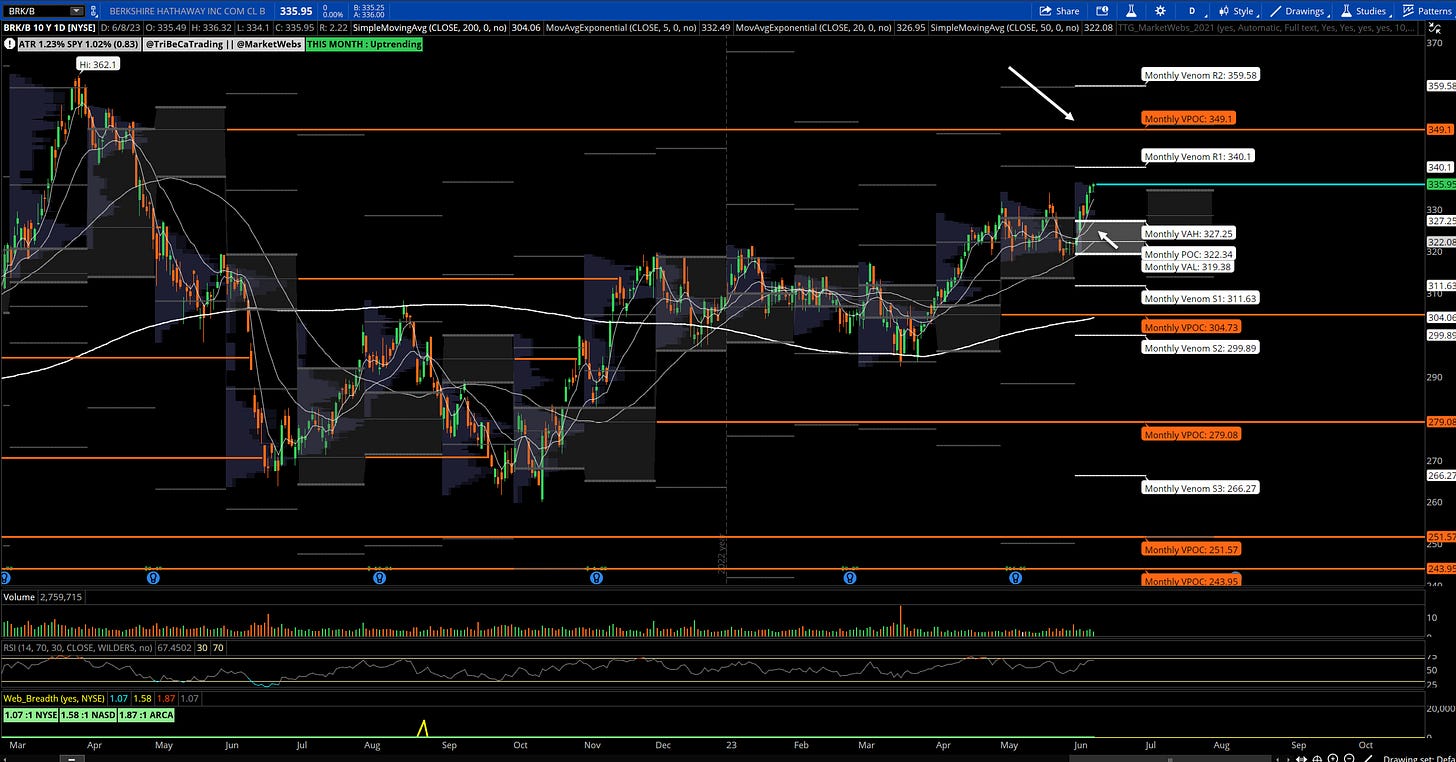
BRK/B Weekly & Daily chart
Berkshire Hathaway Inc. is a holding company owning subsidiaries in a variety of business sectors. The Company's principal operations are insurance business conducted nationwide on a primary basis and worldwide on a reinsurance basis. Berkshire's other operations include a railway company, a specialty chemical company, and an international association of diversified businesses.(Bloomberg)
-suggested stop price $327 using the TTG MarketWebs
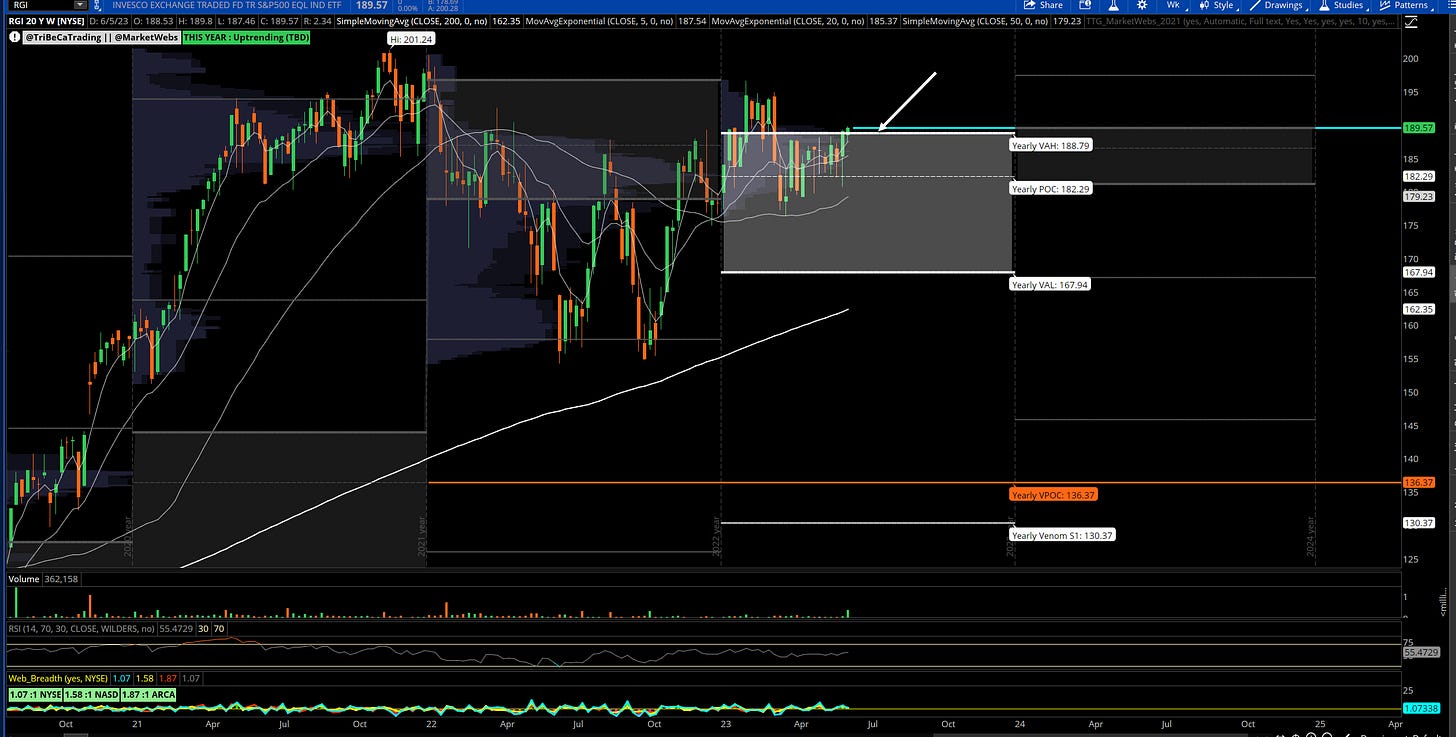
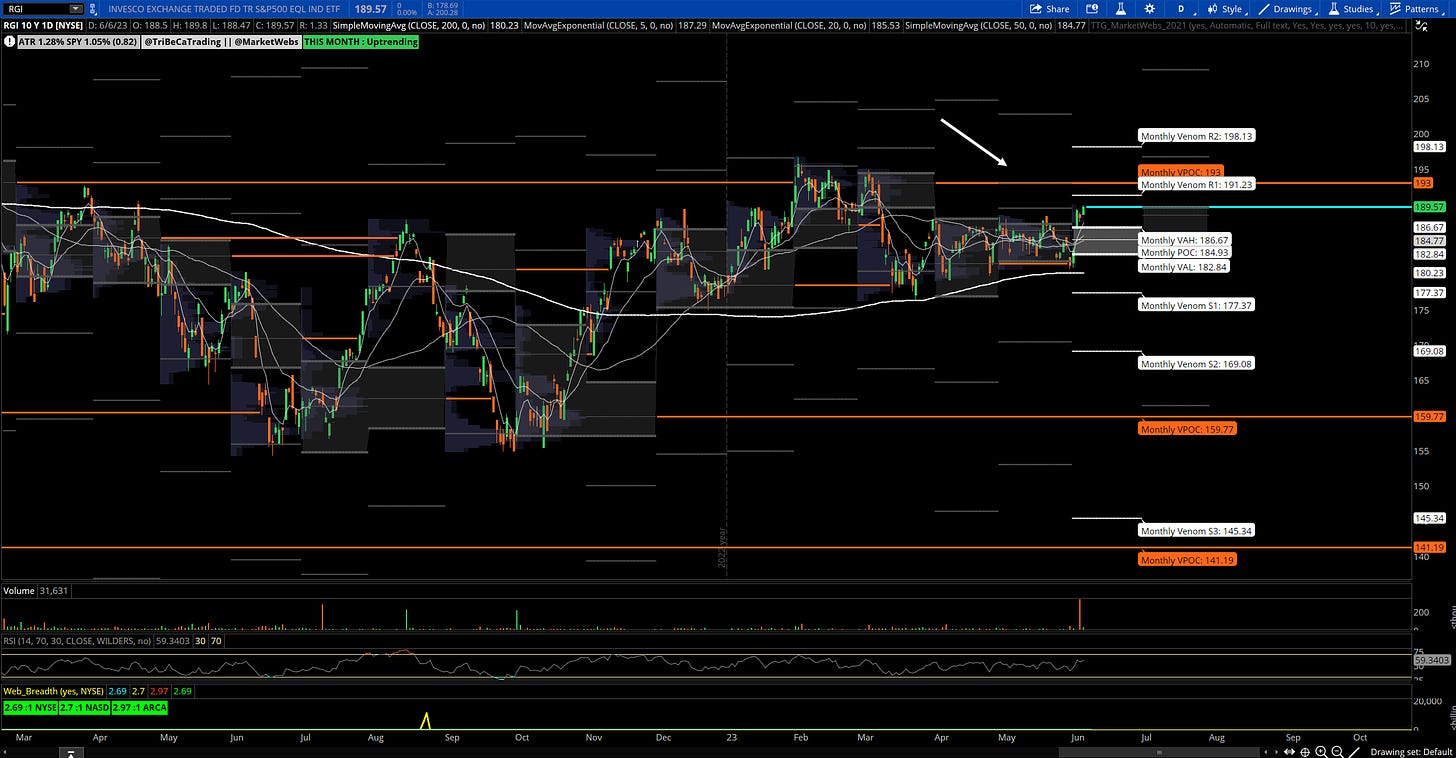
RGI (new ticker RSPN) Weekly & Daily chart
Invesco S&P 500 Equal Weight Industrials ETF is an exchange-traded fund incorporated in the USA. The Fund tracks the S&P 500 Equal Weight Industrials Index which equally weights the stocks in the industrials sector of the S&P 500, providing a far less concentrated portfolio compared to the market cap benchmark. The Fund is rebalanced quarterly. (Bloomberg)
- just showing something different this morning because I am seeing more & more Industrials on the out off the Box Screen (LMT, WSC, ACM, ROK, AME, CAT, PNR, OTIS, ITW, GGG, FTV, CNM, AER, RELX, BAH, UAL, DAL) and RGI is trying to breakout of its Value Area on the weekly timeframe, watch $188.79
Remember, this is just one type of screen / setup that I focus on in my analysis!
Copyright © Tribeca Trade Group. All of the information in this newsletter is for entertainment and educational purposes only and is not to be construed as investment or trading advice. None of the information in this newsletter is guaranteed to be accurate, complete, useful or timely. IMPORTANT NOTICES AND DISCLAIMERS TriBeCa Trade Group is not an investment advisor and is not registered with the U.S. Securities and Exchange Commission or the Financial Industry Regulatory Authority. Further, owners, employees, agents or representatives of TriBeCa Trade Group are not acting as investment advisors and might not be registered with the U.S. Securities Authority

