

TTG Index Charts & Out of the Box Stock Screen 3/4/24 $FLEX
TTG Index Charts & Out of the Box Stock Screen 3/4/24 $FLEX
Out of the Box MarketWebs Screen
US Dollar flat / 30yr Bonds -0.4% / Crude -0.3% & Nat Gas +7.9% / Gold -0.2% / Copper +0.2% / BTC +3.4%
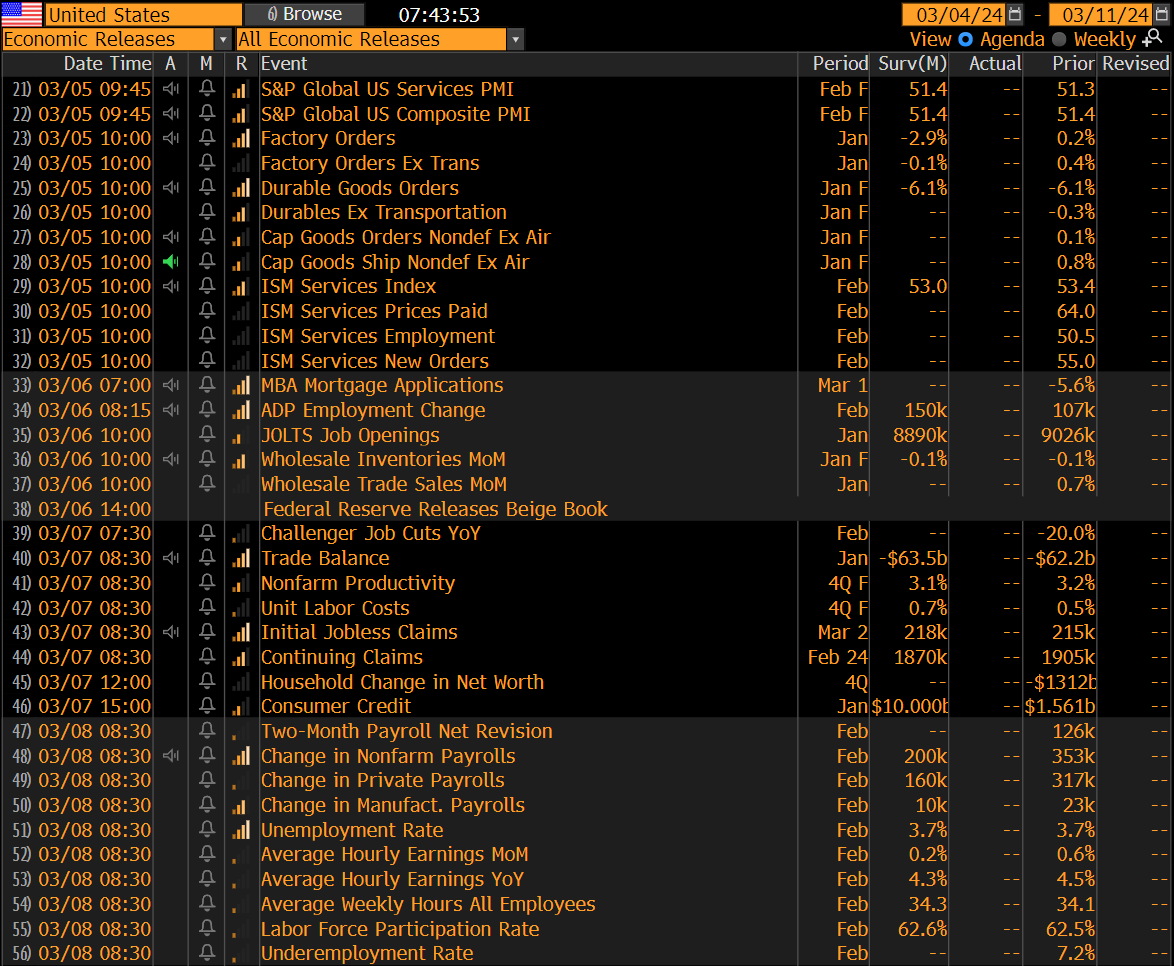
US Upcoming Economics
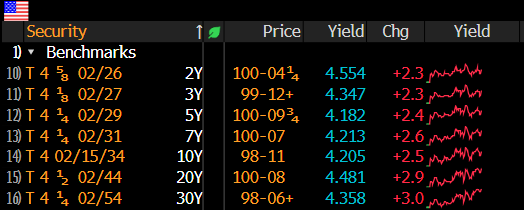
US Bond Yields
Index Updates
At TTG, I use Volume At Price in my chart analysis and I use the MarketWebs Indicator to provide Value Areas & VPOCs which indicate significant support & resistance levels. Learn More Here about Volume At Price and the MarketWebs.
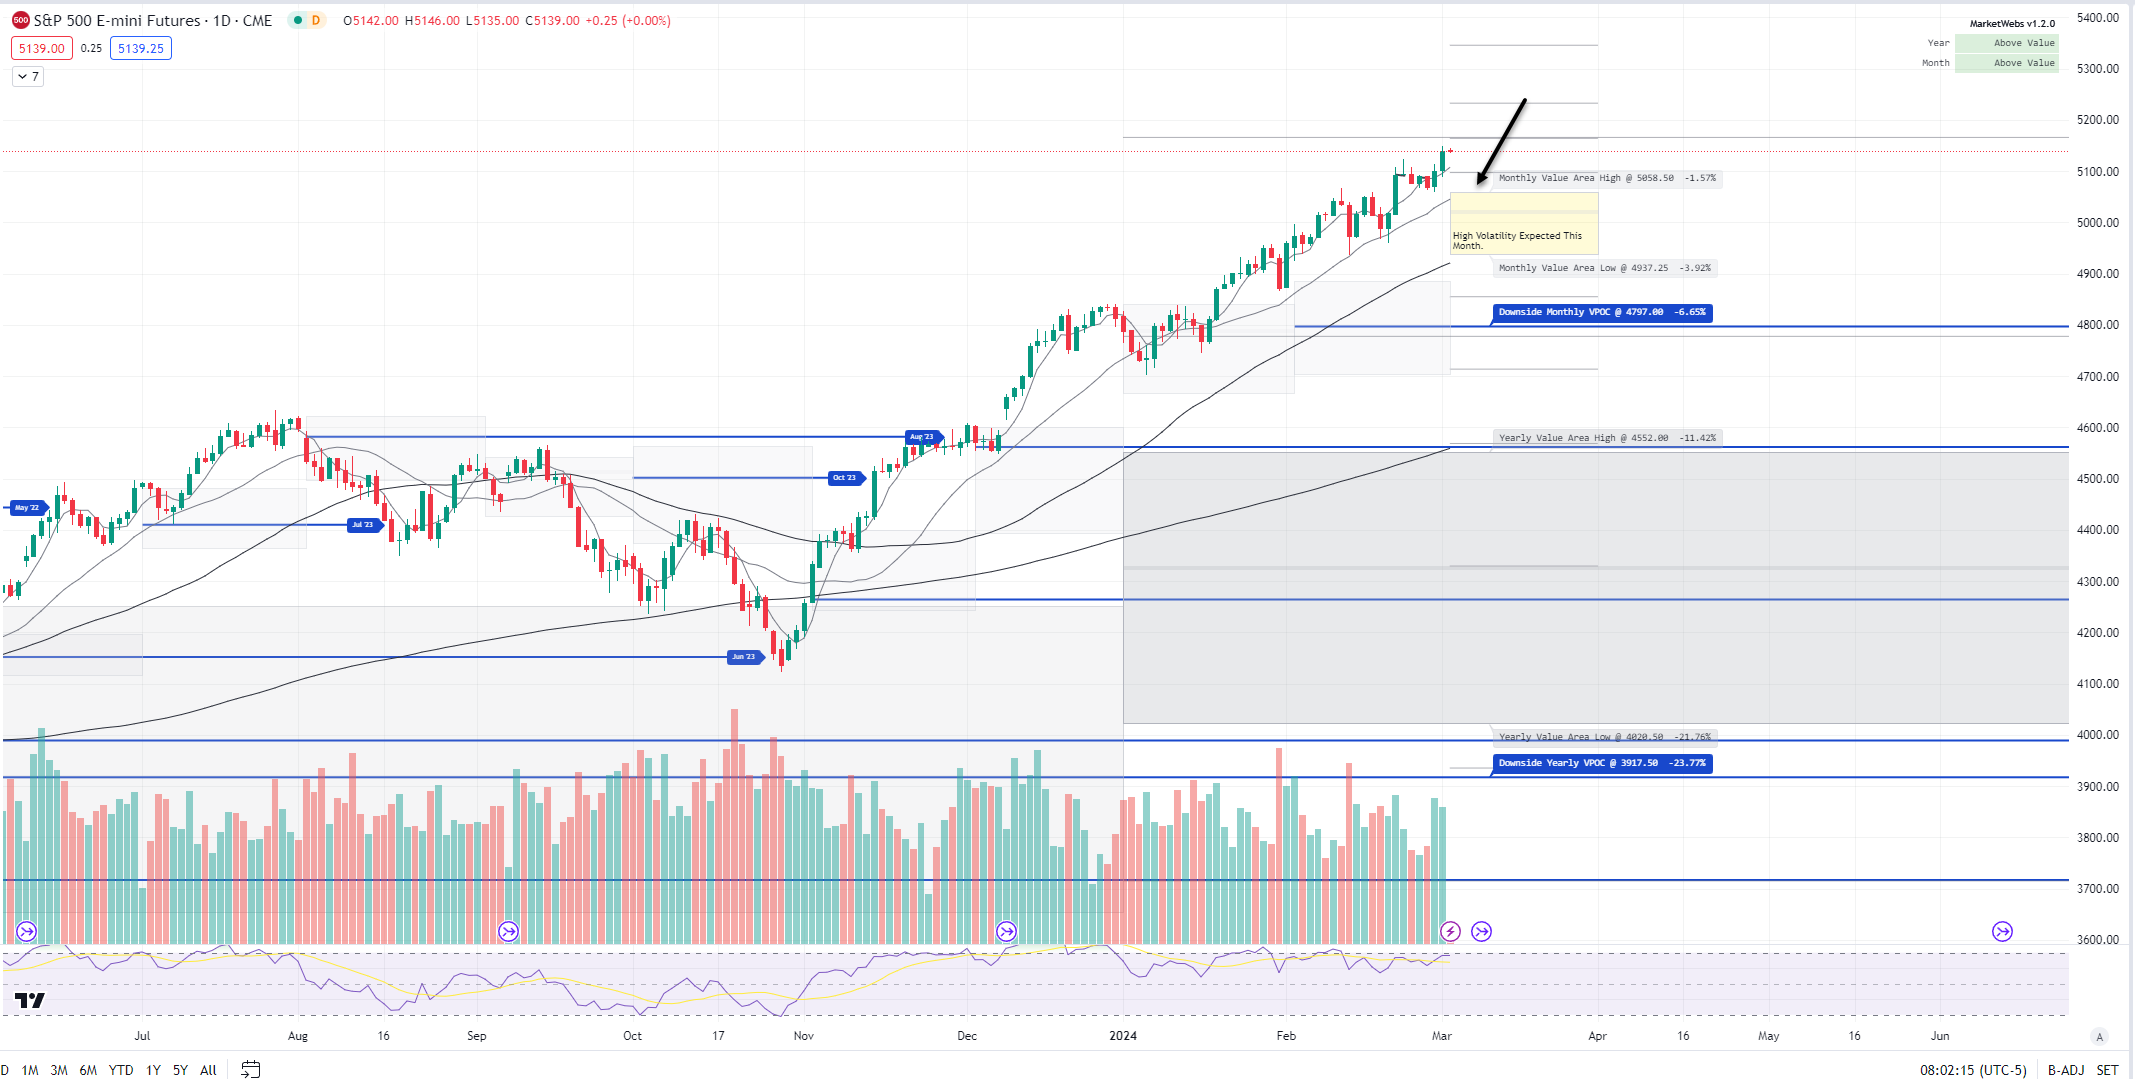
ES_F - SPX Futures - Price above the Mar Value Area and for now the trends are in place as price is also above all its short term MAs (Moving Averages)
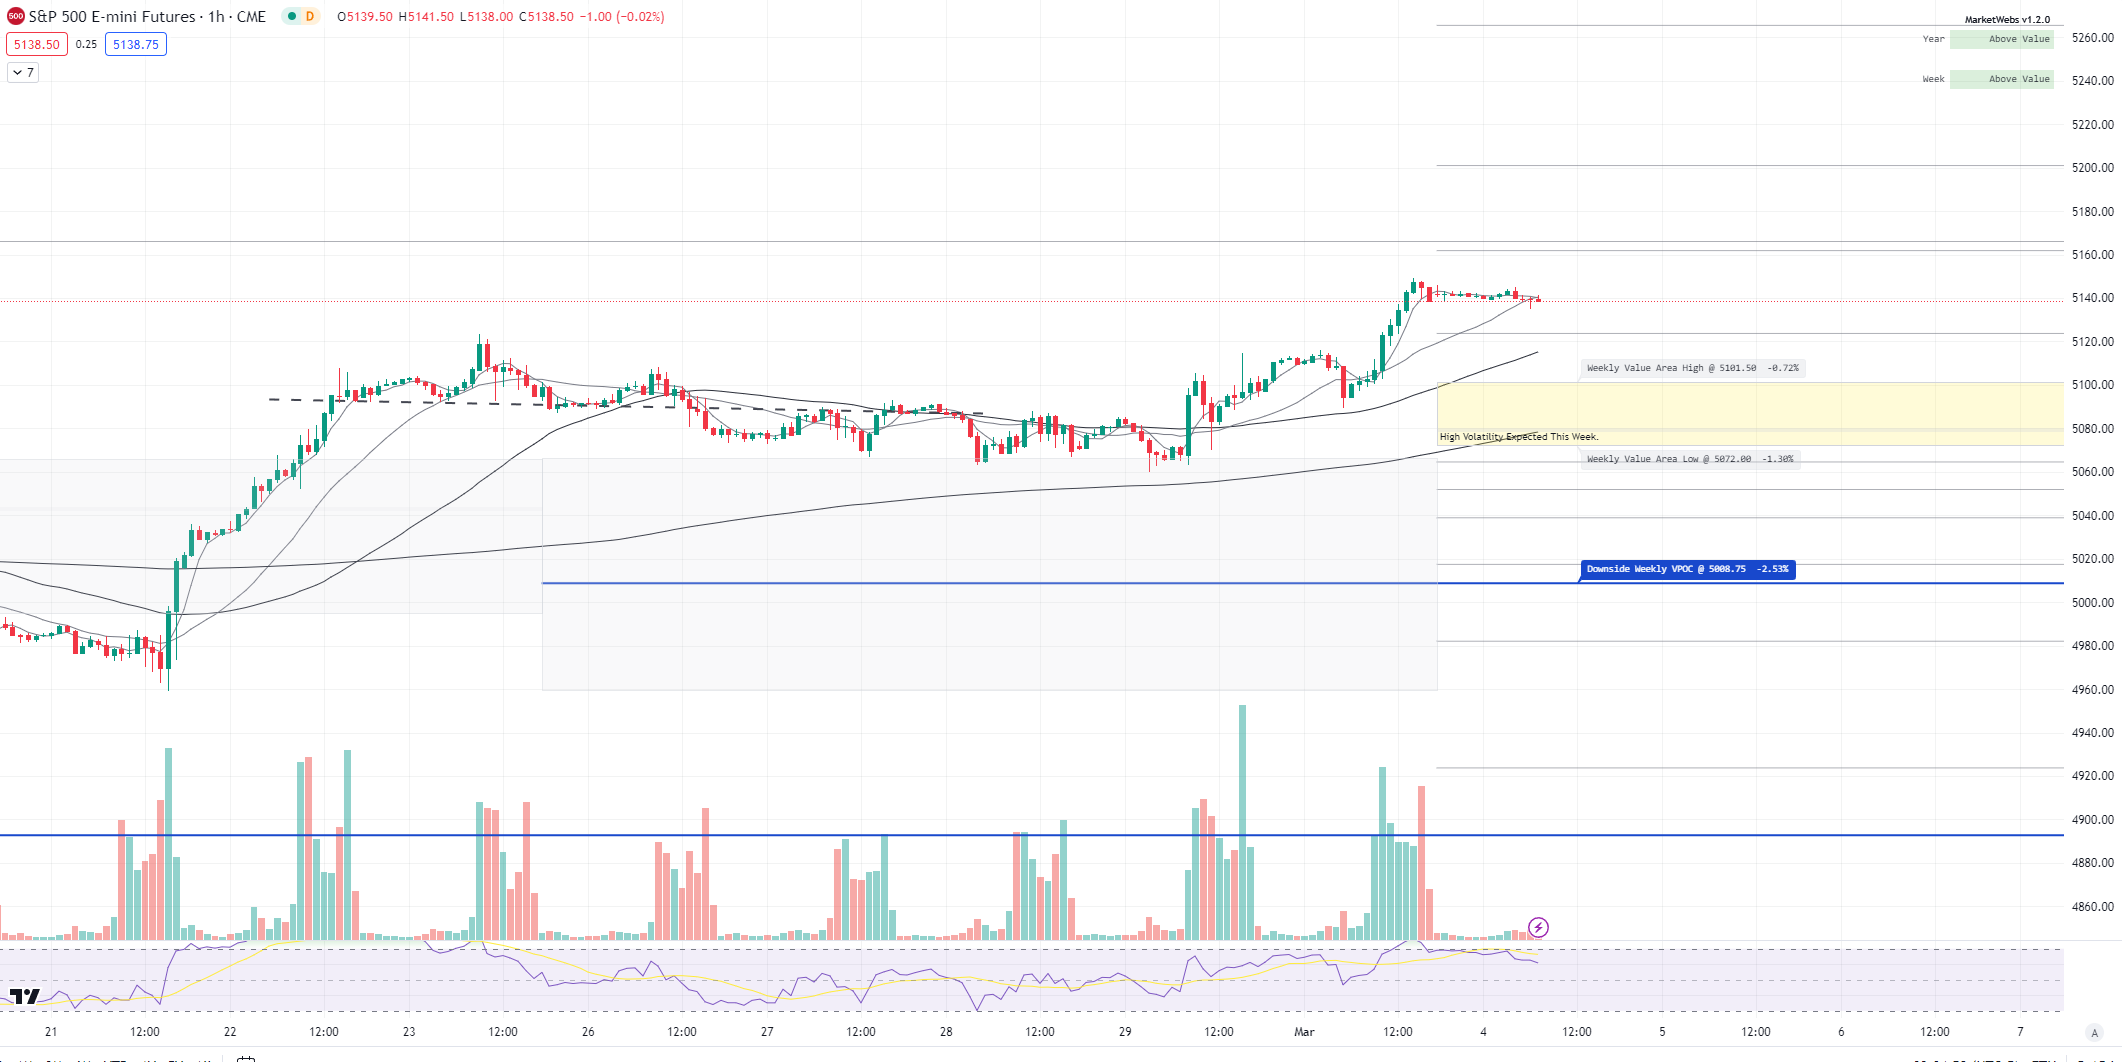
1hr chart: Price starts new week above its new Value Area and support down at 5101.5
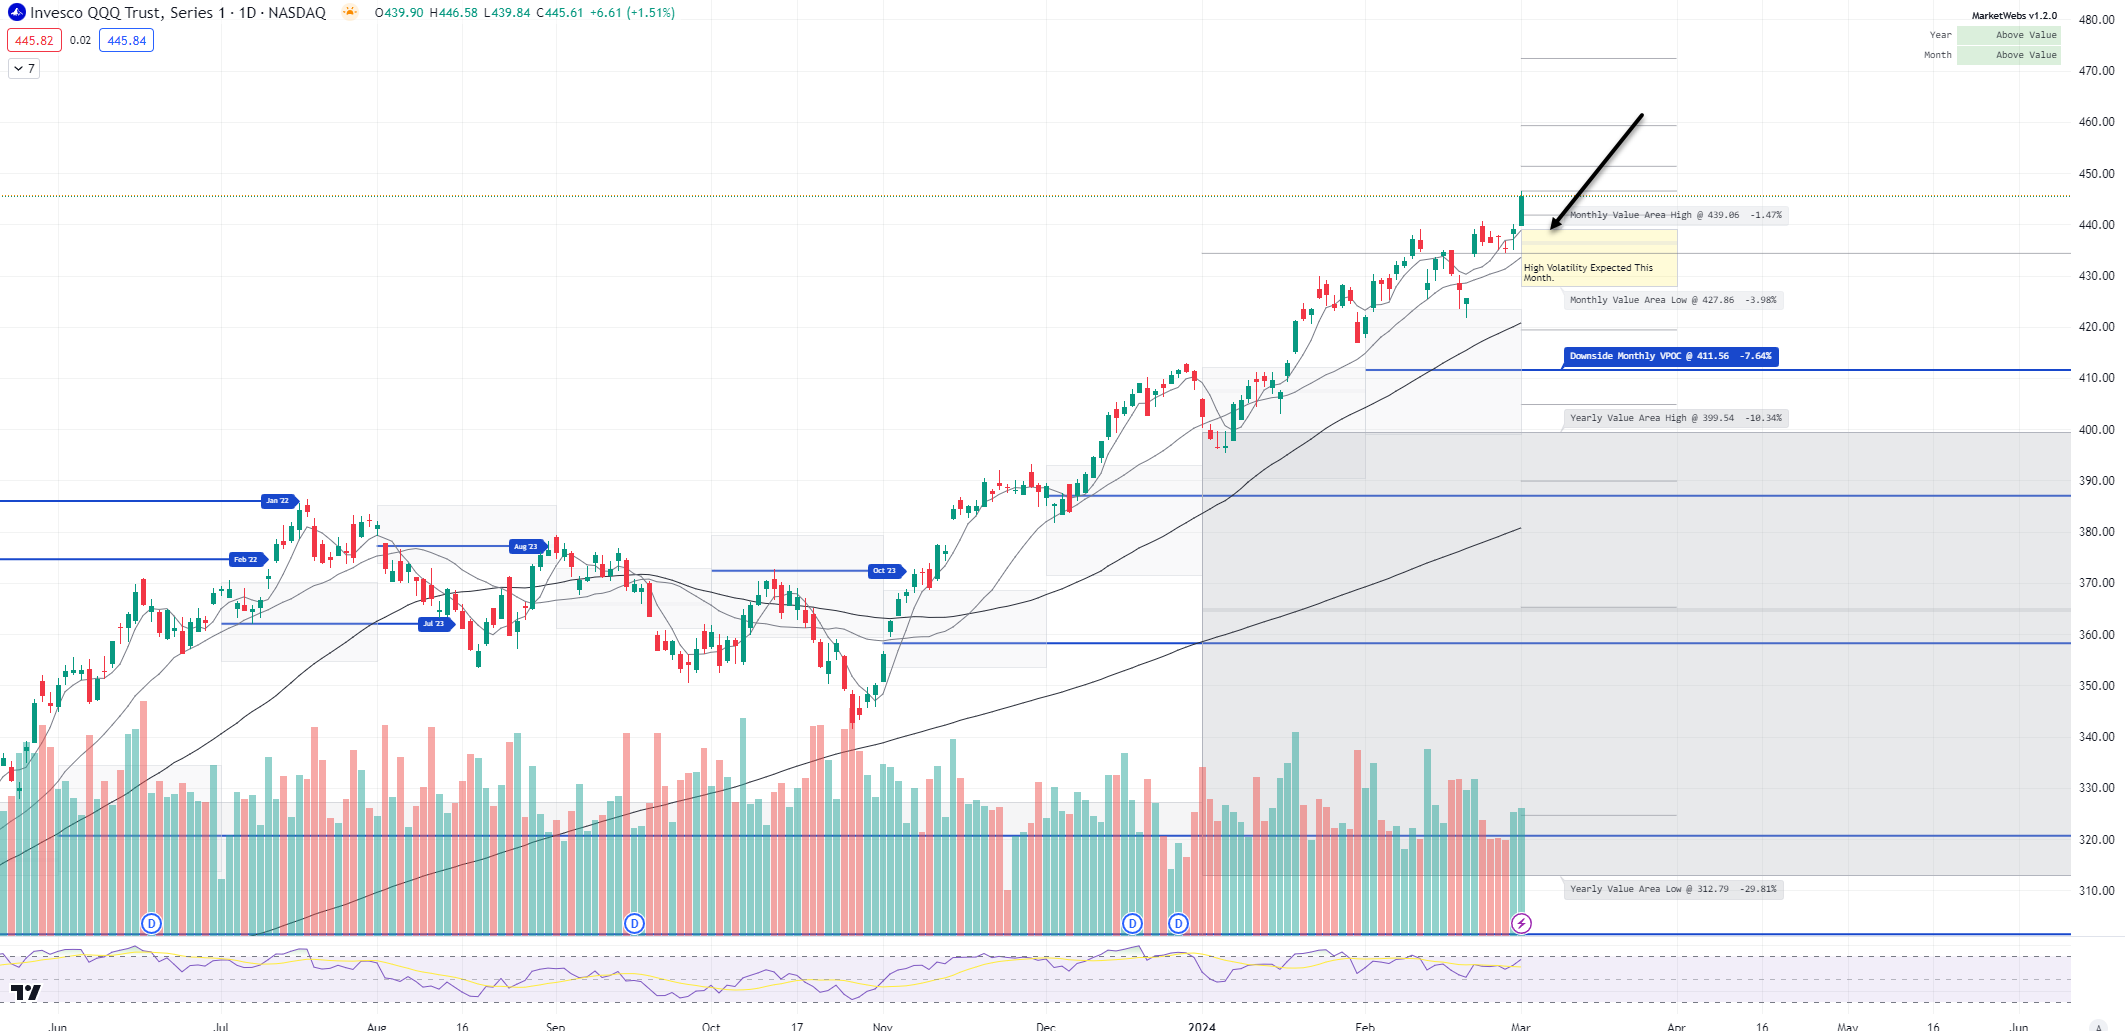
QQQ - NDX 100 ETF - Daily chart: Price ~ flat to start the week after an impressive rally and move above its Mar Value Area, support down at $439
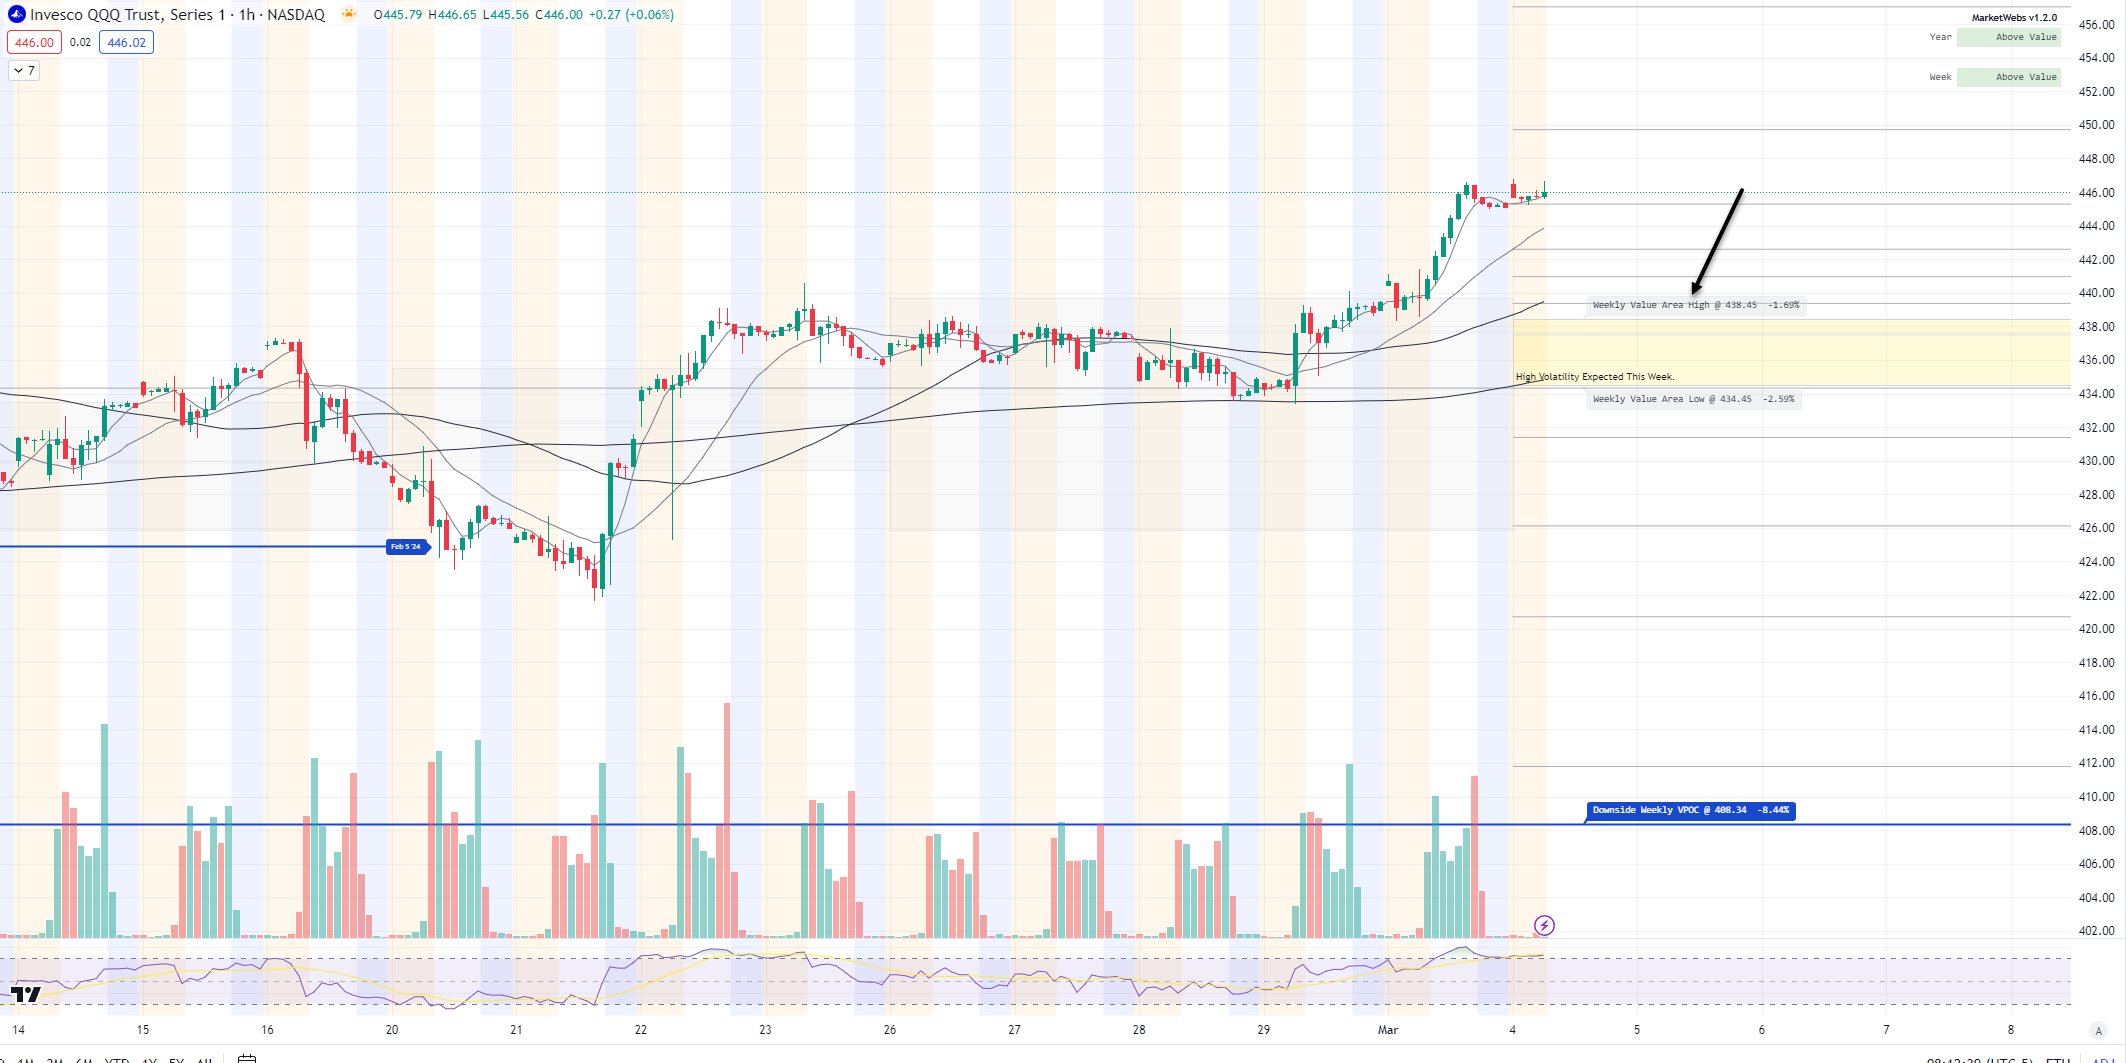
1hr chart: Price starts the week above its new Value Area for the week, support at $438.45
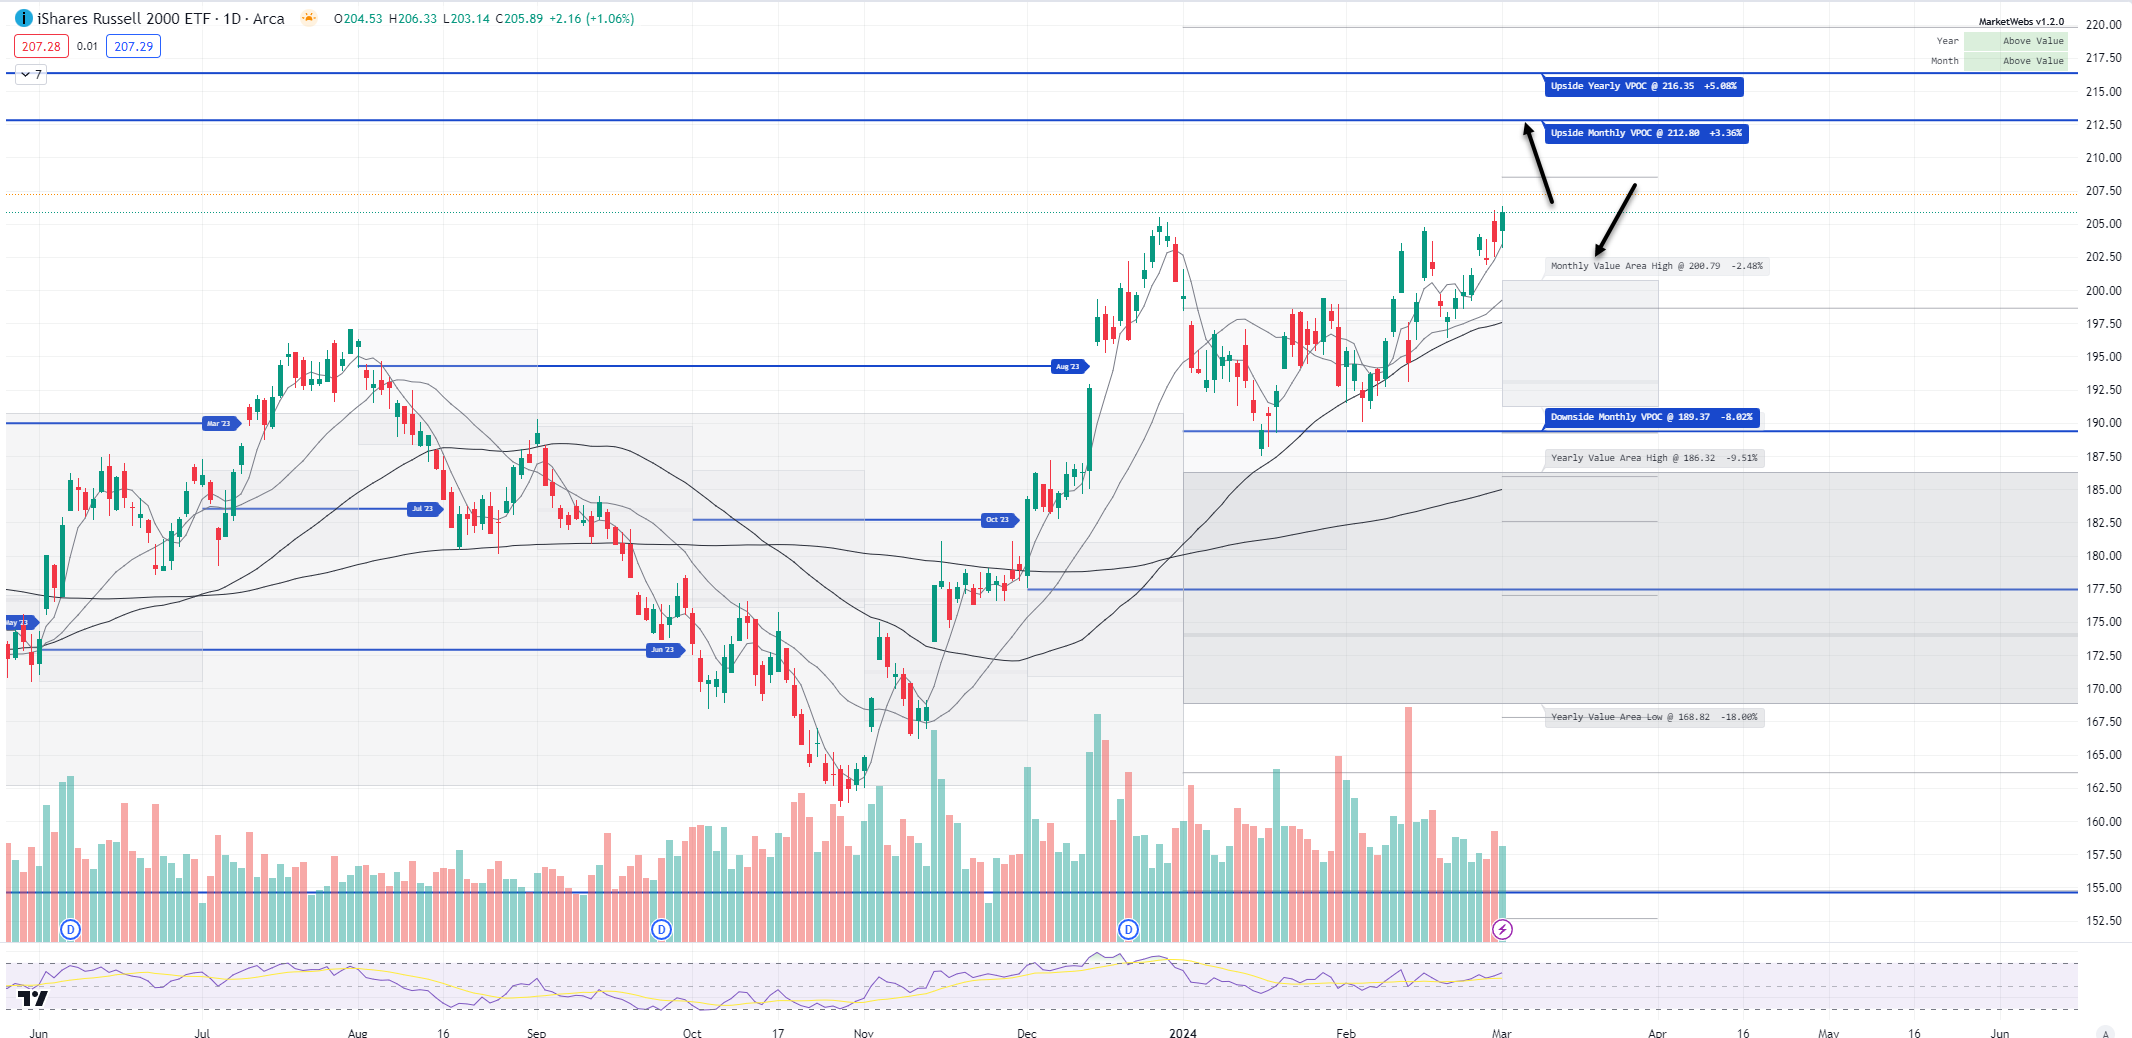
IWM - Russell Small Cap ETF- Price outperforming this morning, ind. +0.6% and continuing from last week's outperformance (IWM +3% last week) and above its Mar Value Area, support $200.79
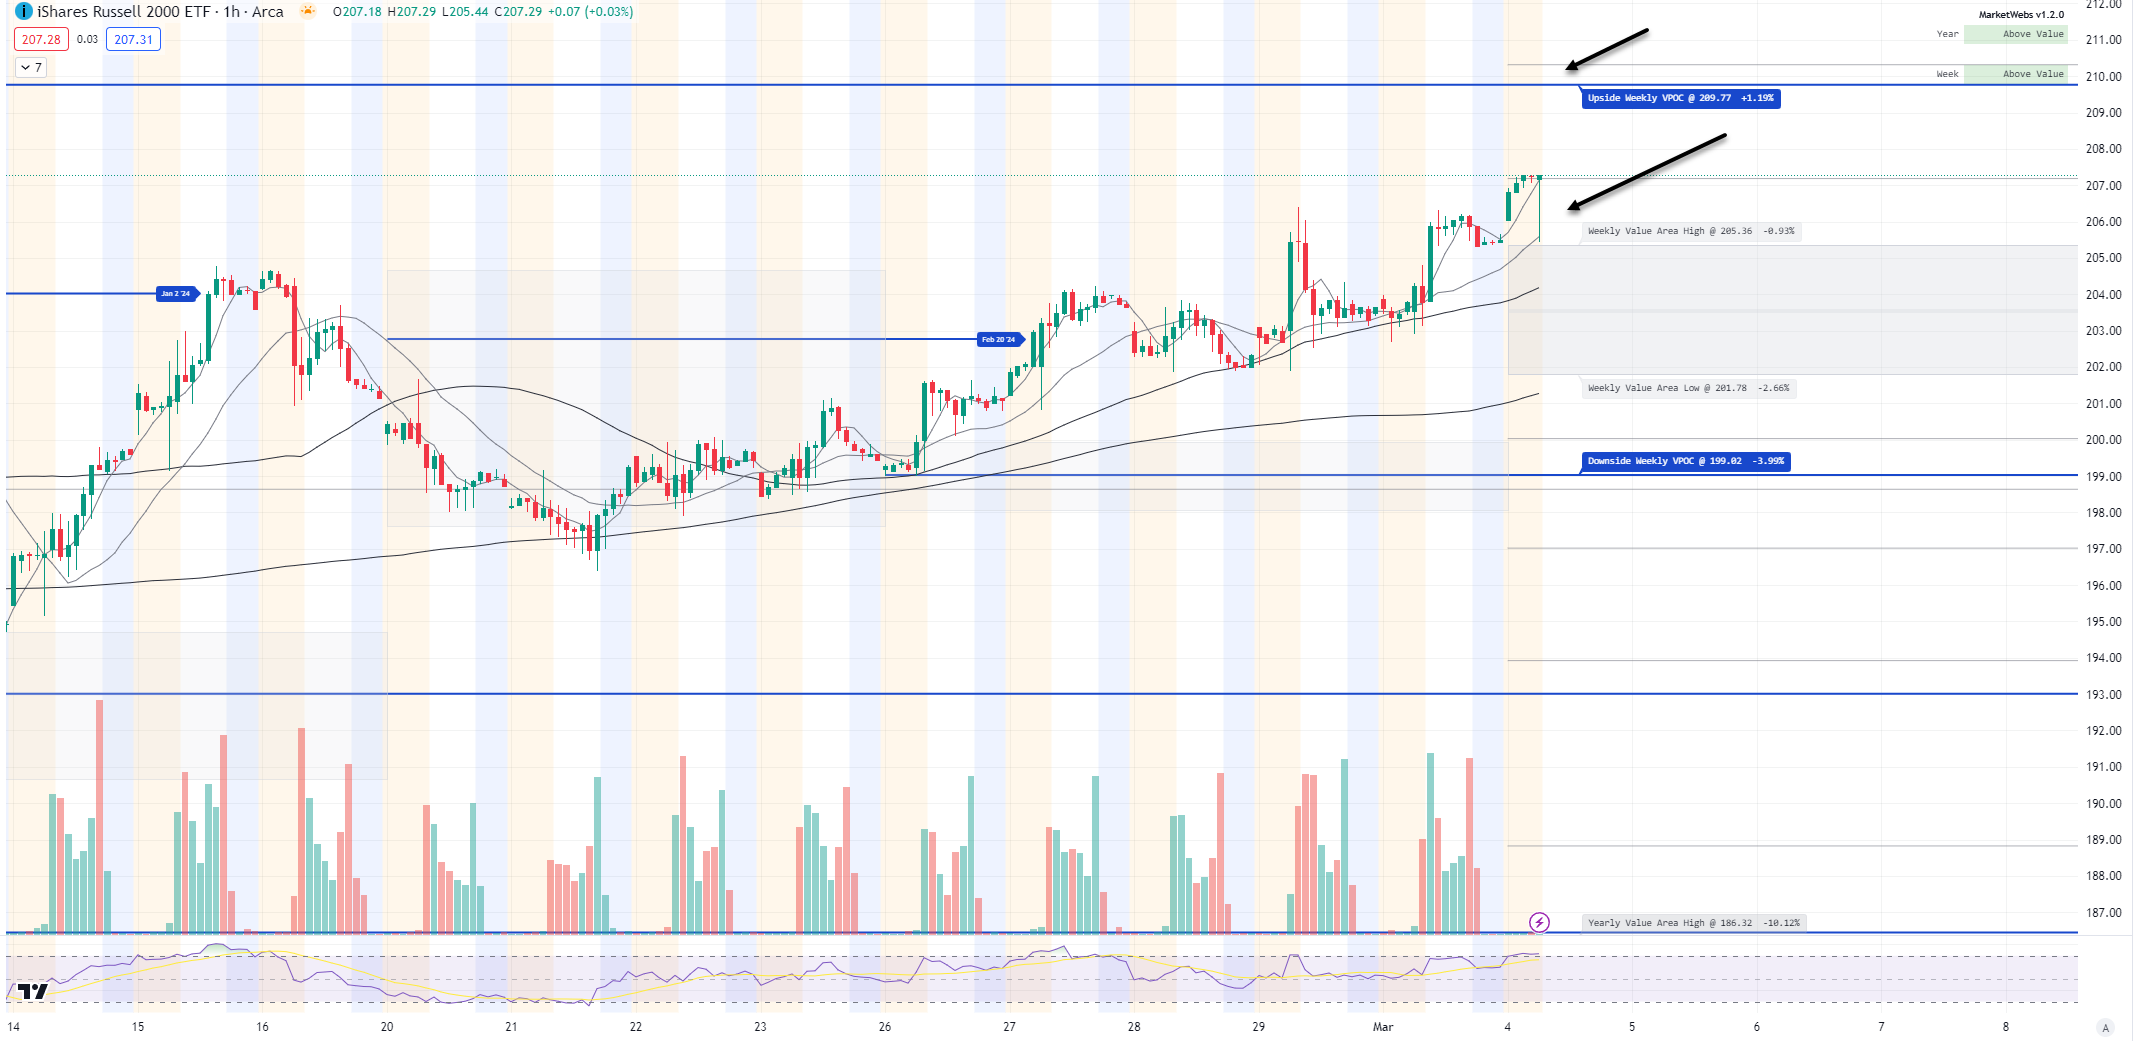
1hr chart: Price also starts the week above its new Value Area, support $205.36
Here is today’s TTG Proprietary Stock Screen “Out of the Box” using Volume At Price
names trending above their Value Areas (on 3 multiple timeframes & not super extended)
Keep reading with a 7-day free trial
Subscribe to The Tribeca Trade Group to keep reading this post and get 7 days of free access to the full post archives.