

TTG Index Charts & Out of the Box Stock Screen 01/04/24 $MPC $MCK
TTG Index Charts & Out of the Box Stock Screen 01/04/24 $MPC $MCK
Out of the Box MarketWebs Screen
US Dollar -0.1% / 30yr Bonds -0.8% / Crude +0.9% & Nat Gas +5.4% / Gold +0.5% / Copper -0.4% / BTC +1.3%
US Upcoming Economics

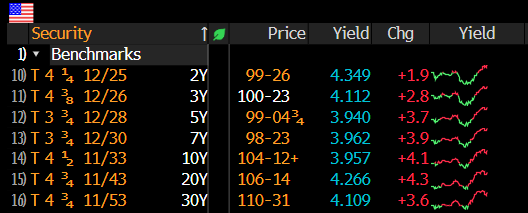
US Bond Yields
Index Updates
At TTG, I use Volume At Price in my chart analysis and I use the MarketWebs Indicator to provide Value Areas & VPOCs which indicate significant support & resistance levels. Learn More Here about Volume At Price and the MarketWebs.
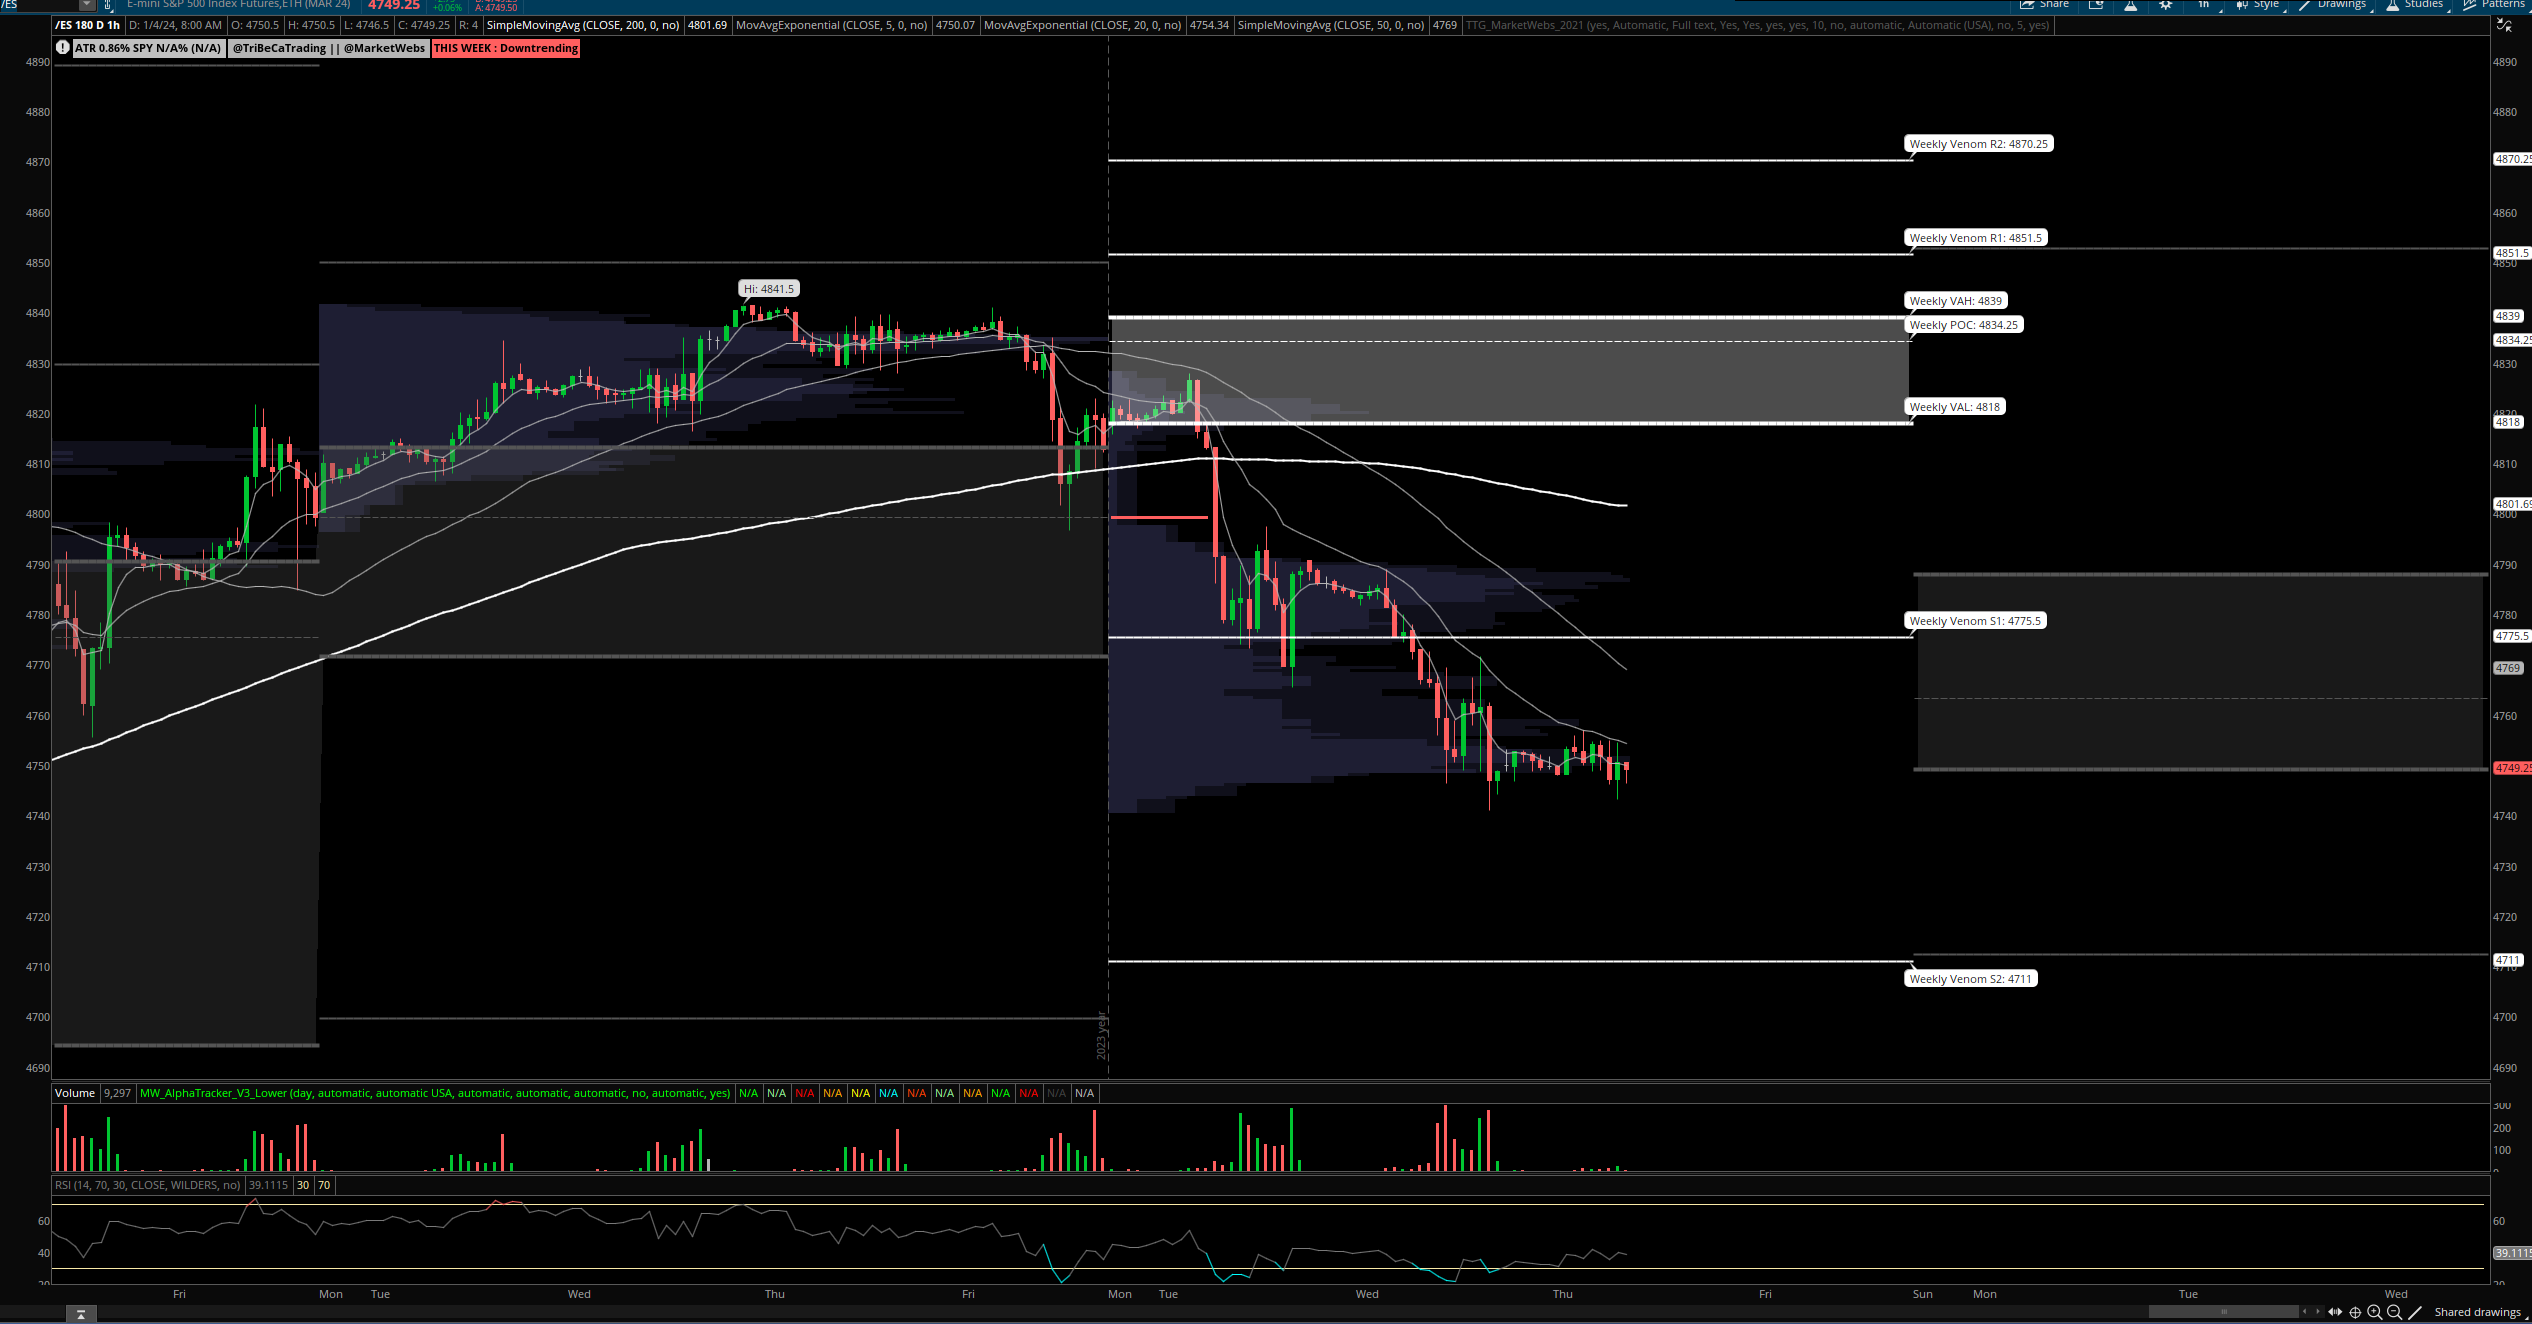
SPY- S&P ETF - Prices ~ flat this morning and price now testing that 20d EMA. Also, note that price has returned to that VPOC (red line) where there is a lot of previous volume
1hr chart: No major change here, price is below Value & below all the short term MAs
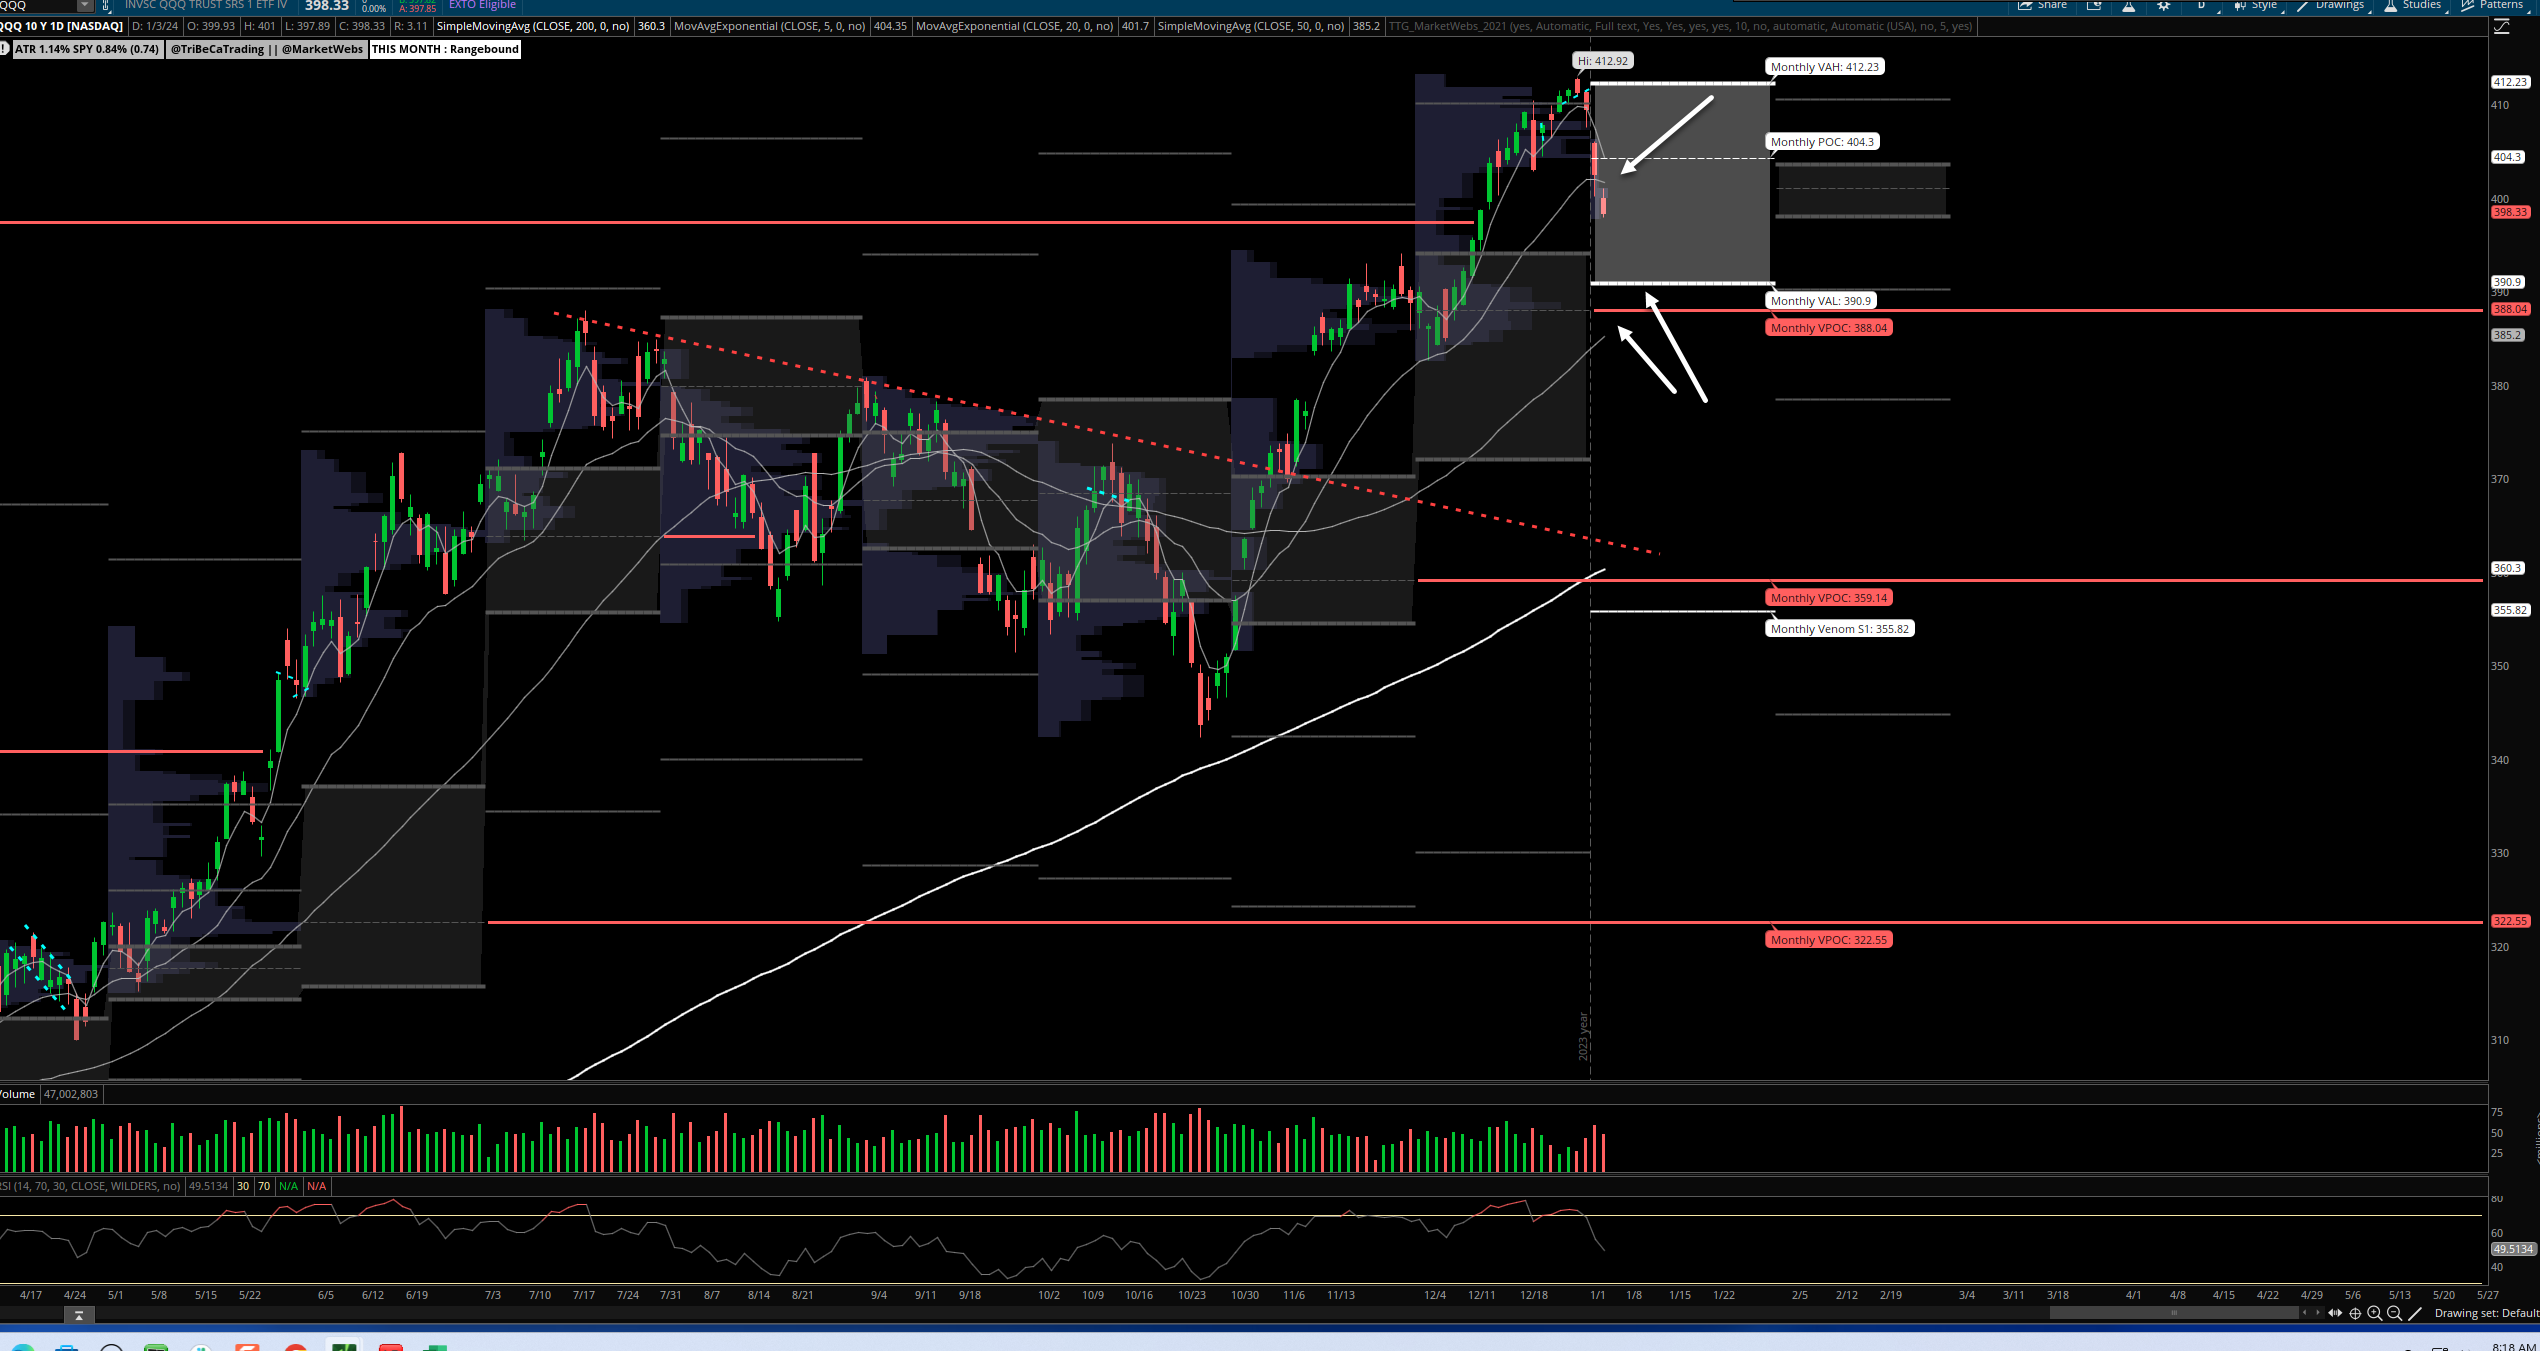
QQQ - NDX 100 ETF - Daily chart: Price has been very weak to start the year and now below its 20d EMA - next support on the Daily chart is $390.9
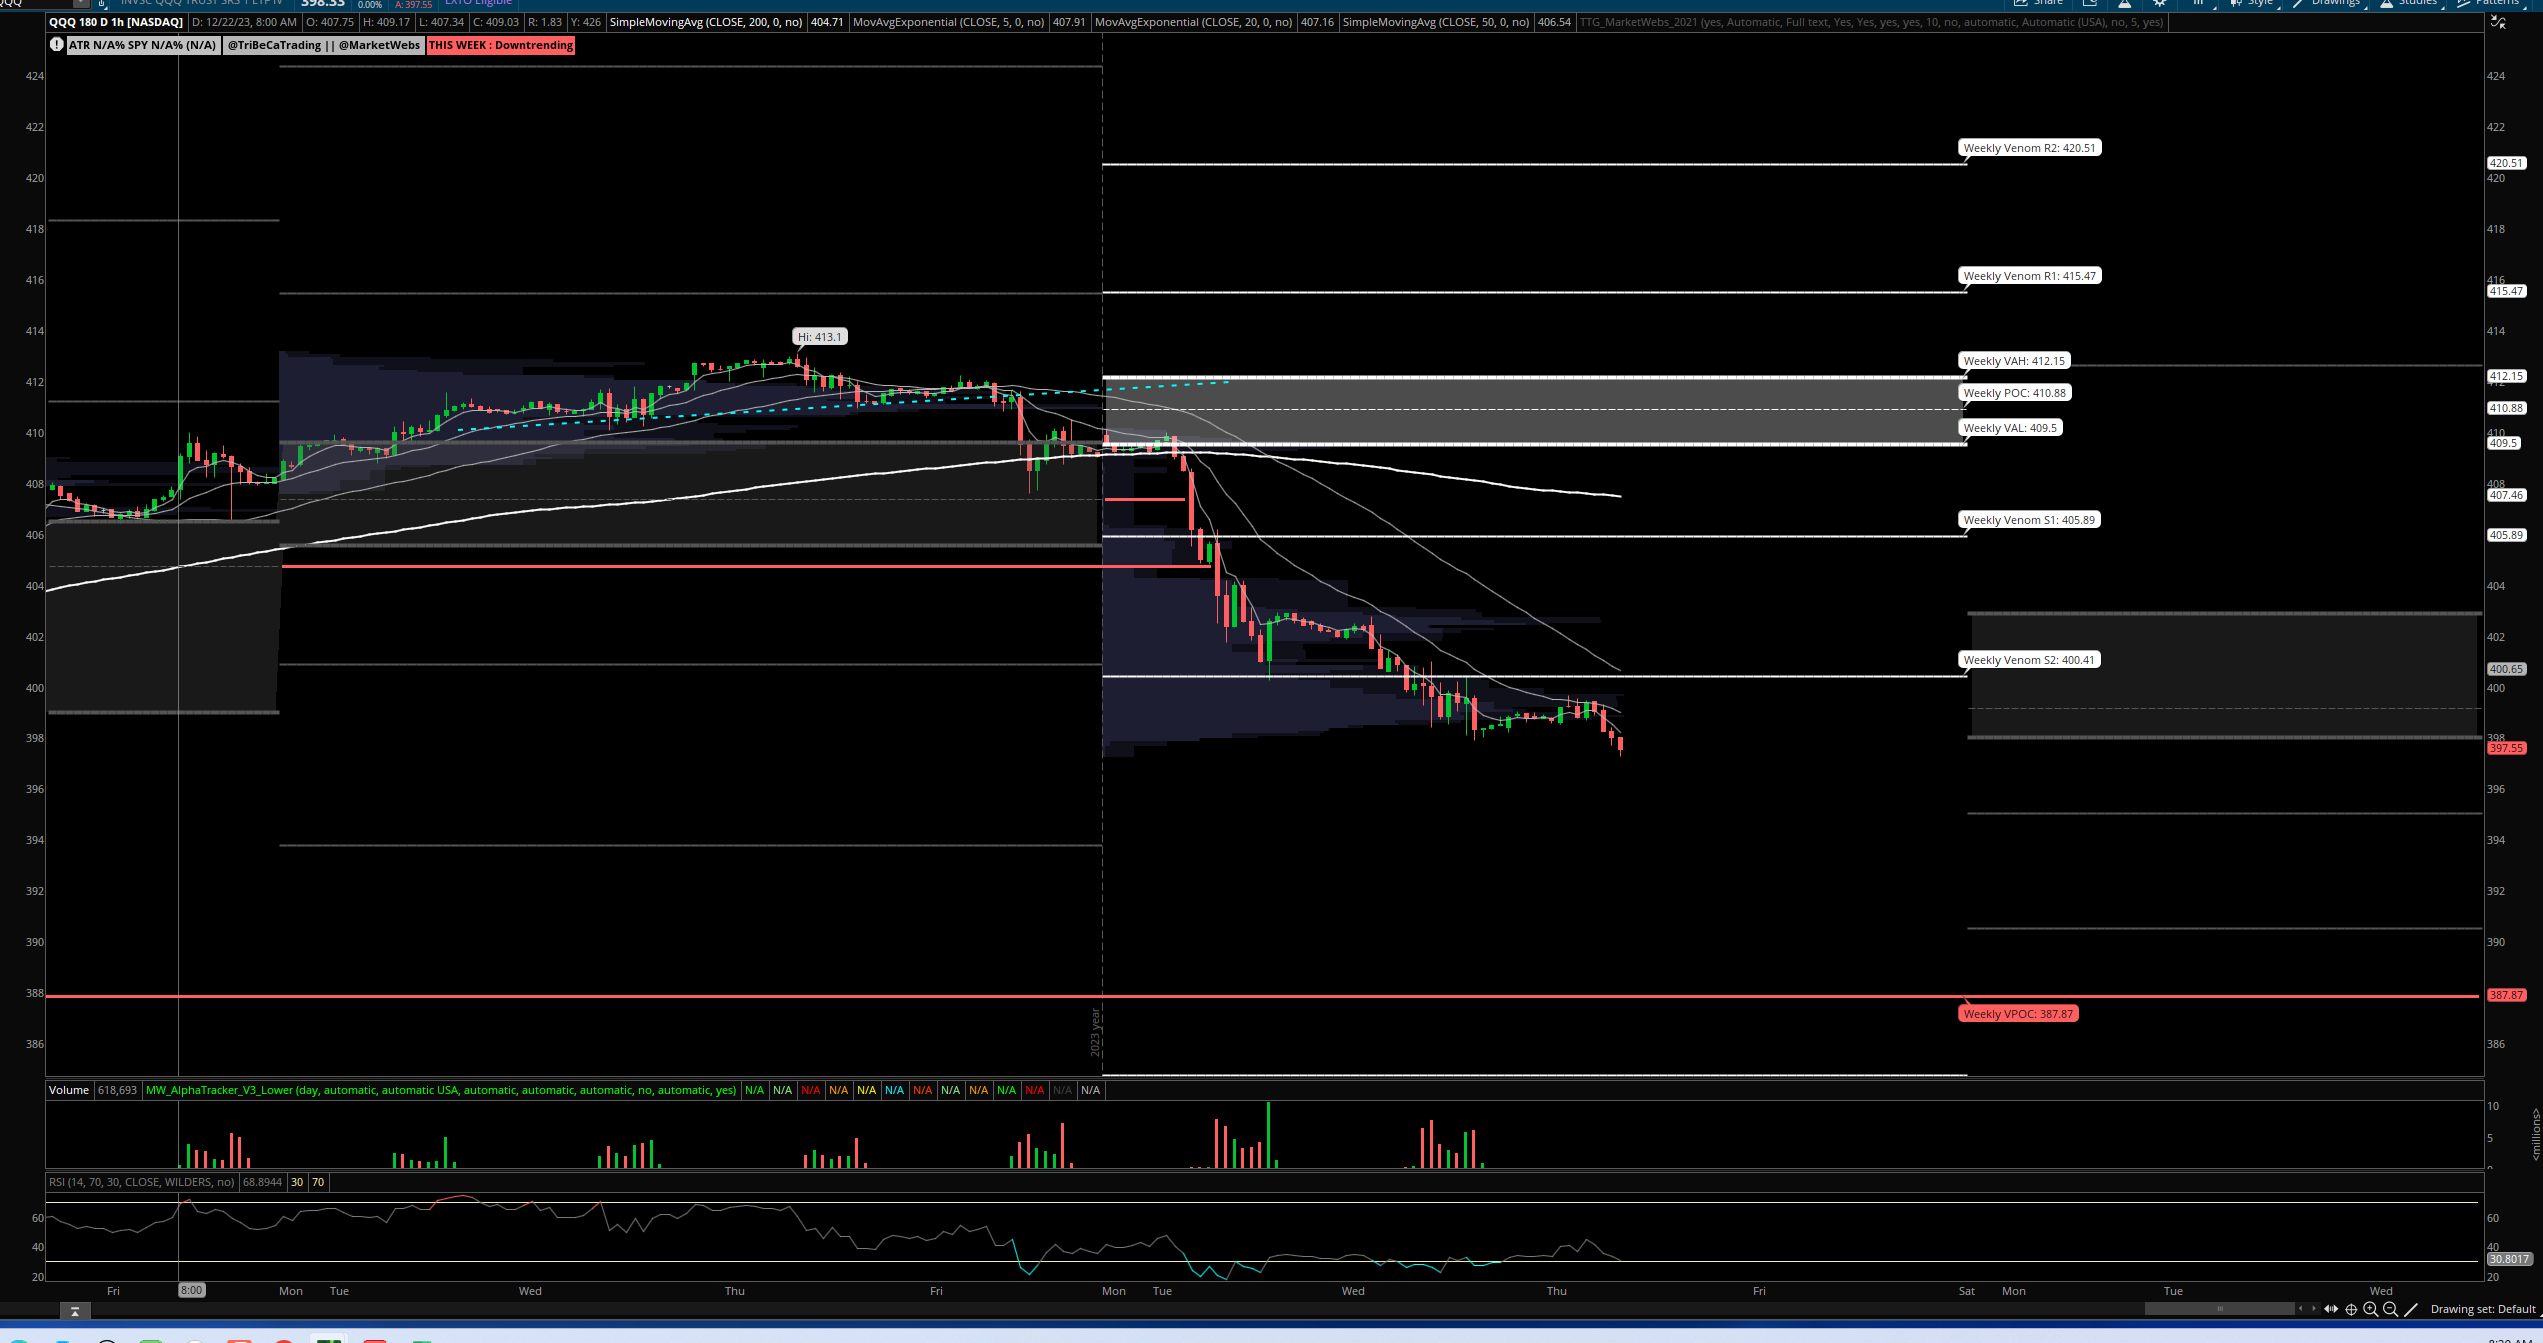
1hr chart: Price continues to trend lower with no major support nearby , lower VPOC down at $387.87
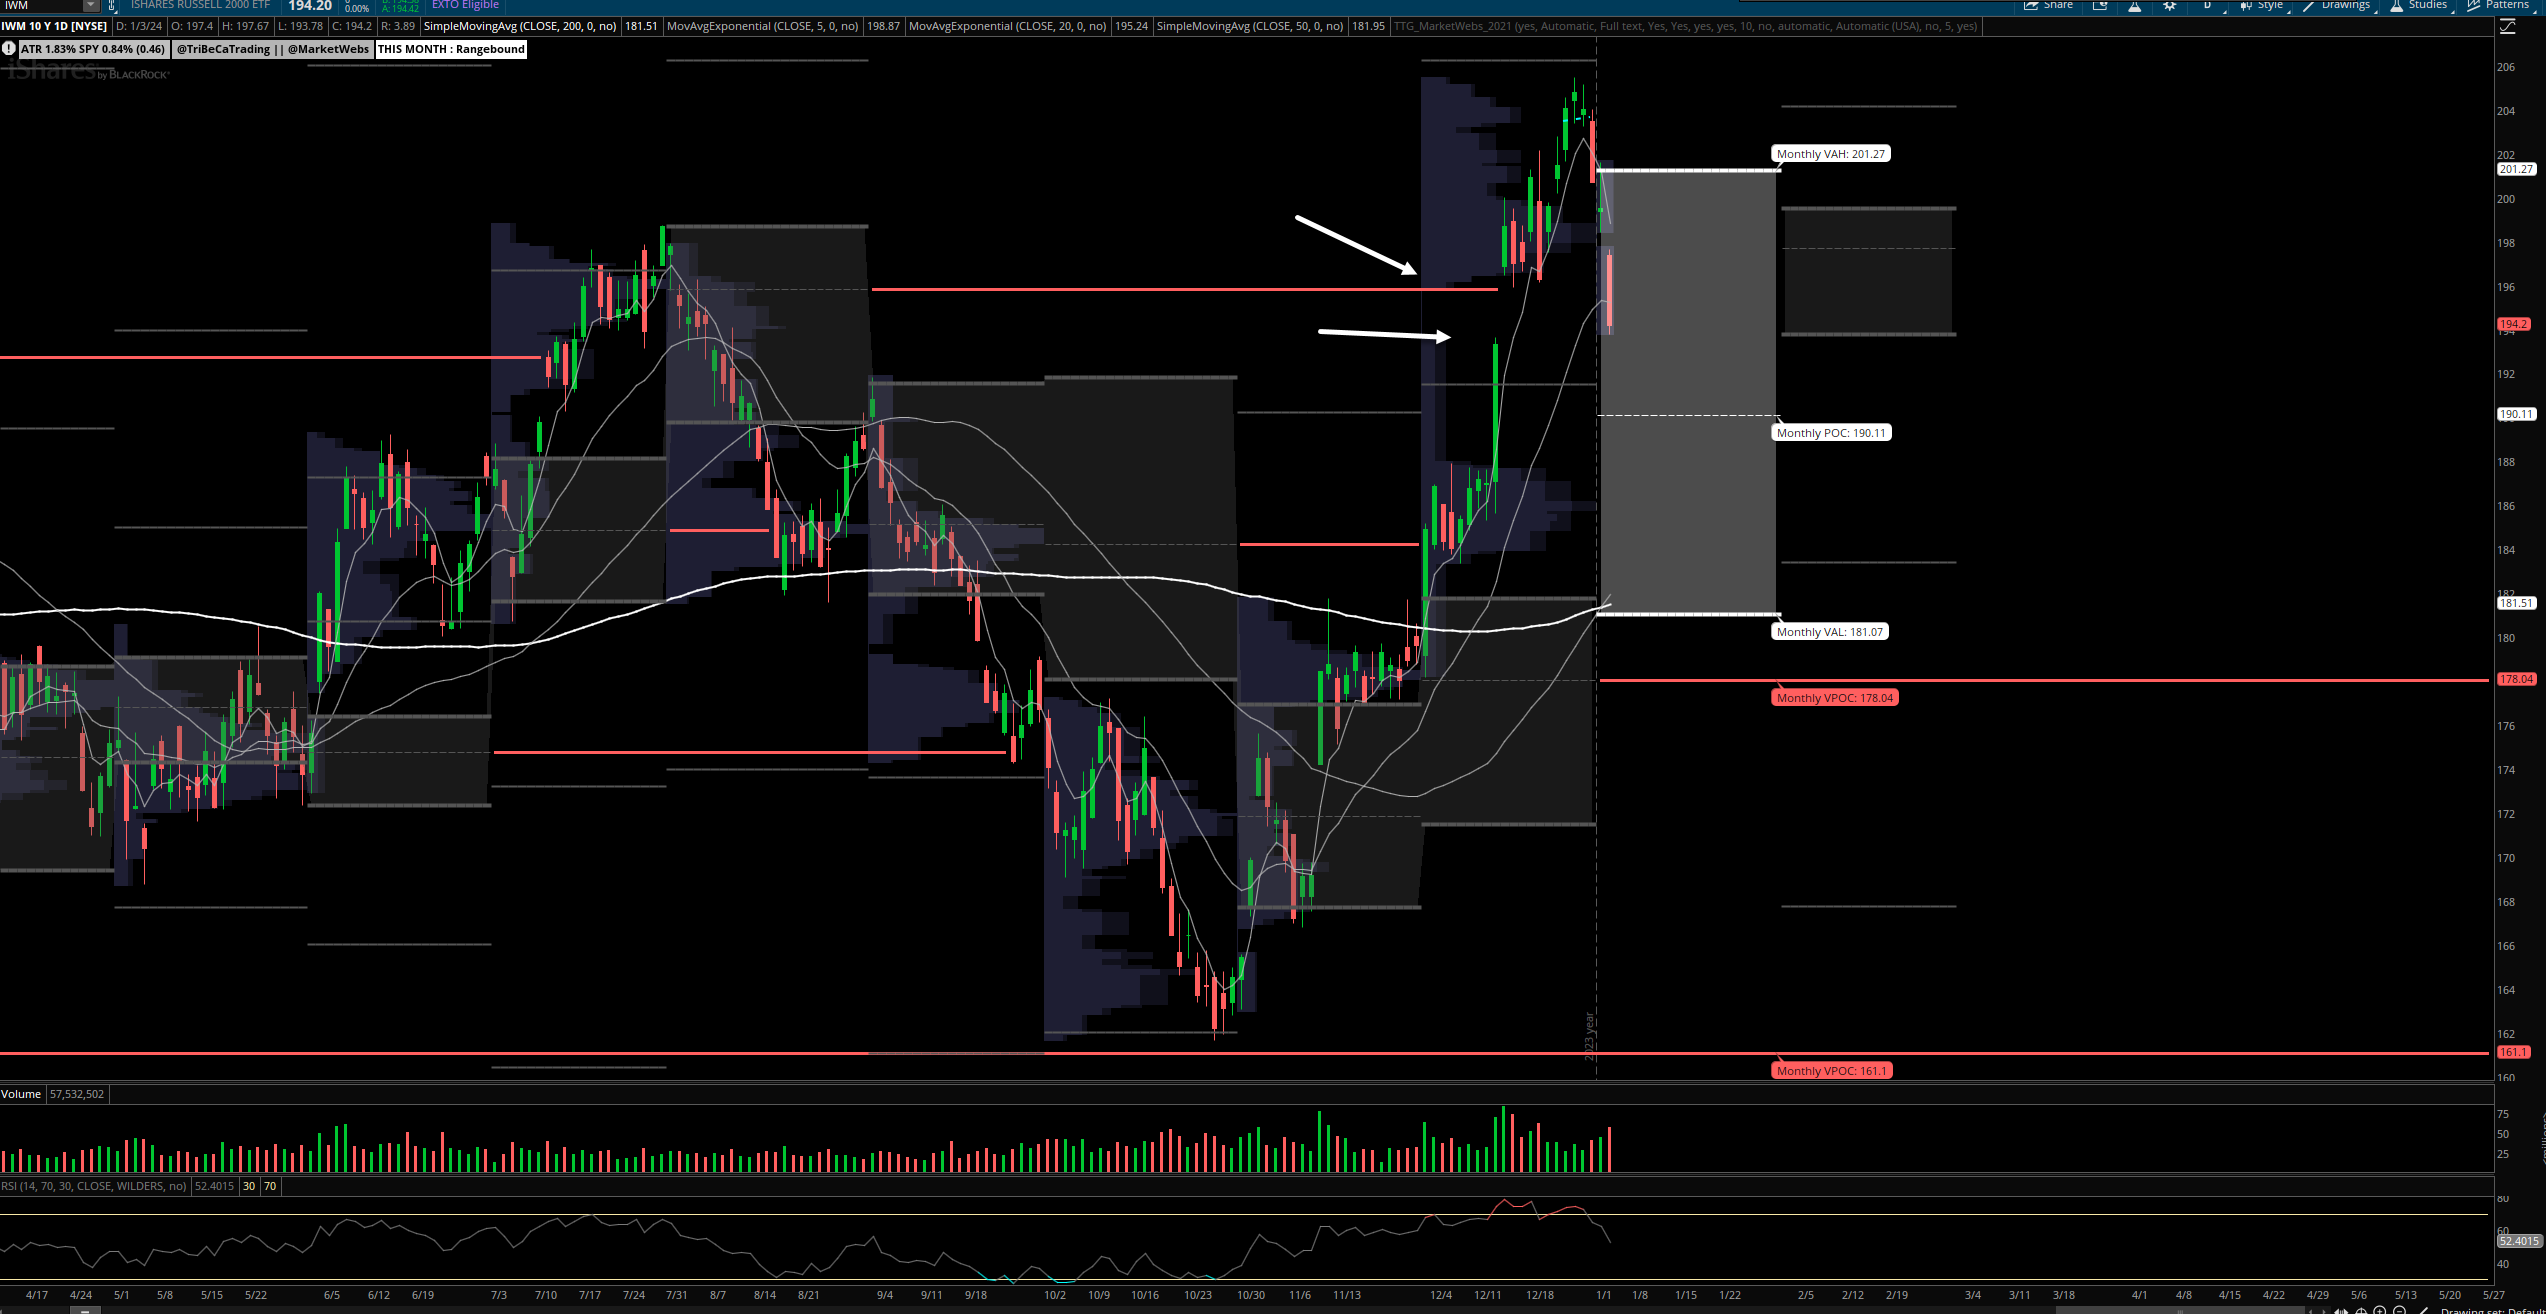
IWM - Russell Small Cap ETF- Daily Chart: Small Caps really got hit hard yesterday IWM -2.7% and almost filling that gap post FOMC day last month
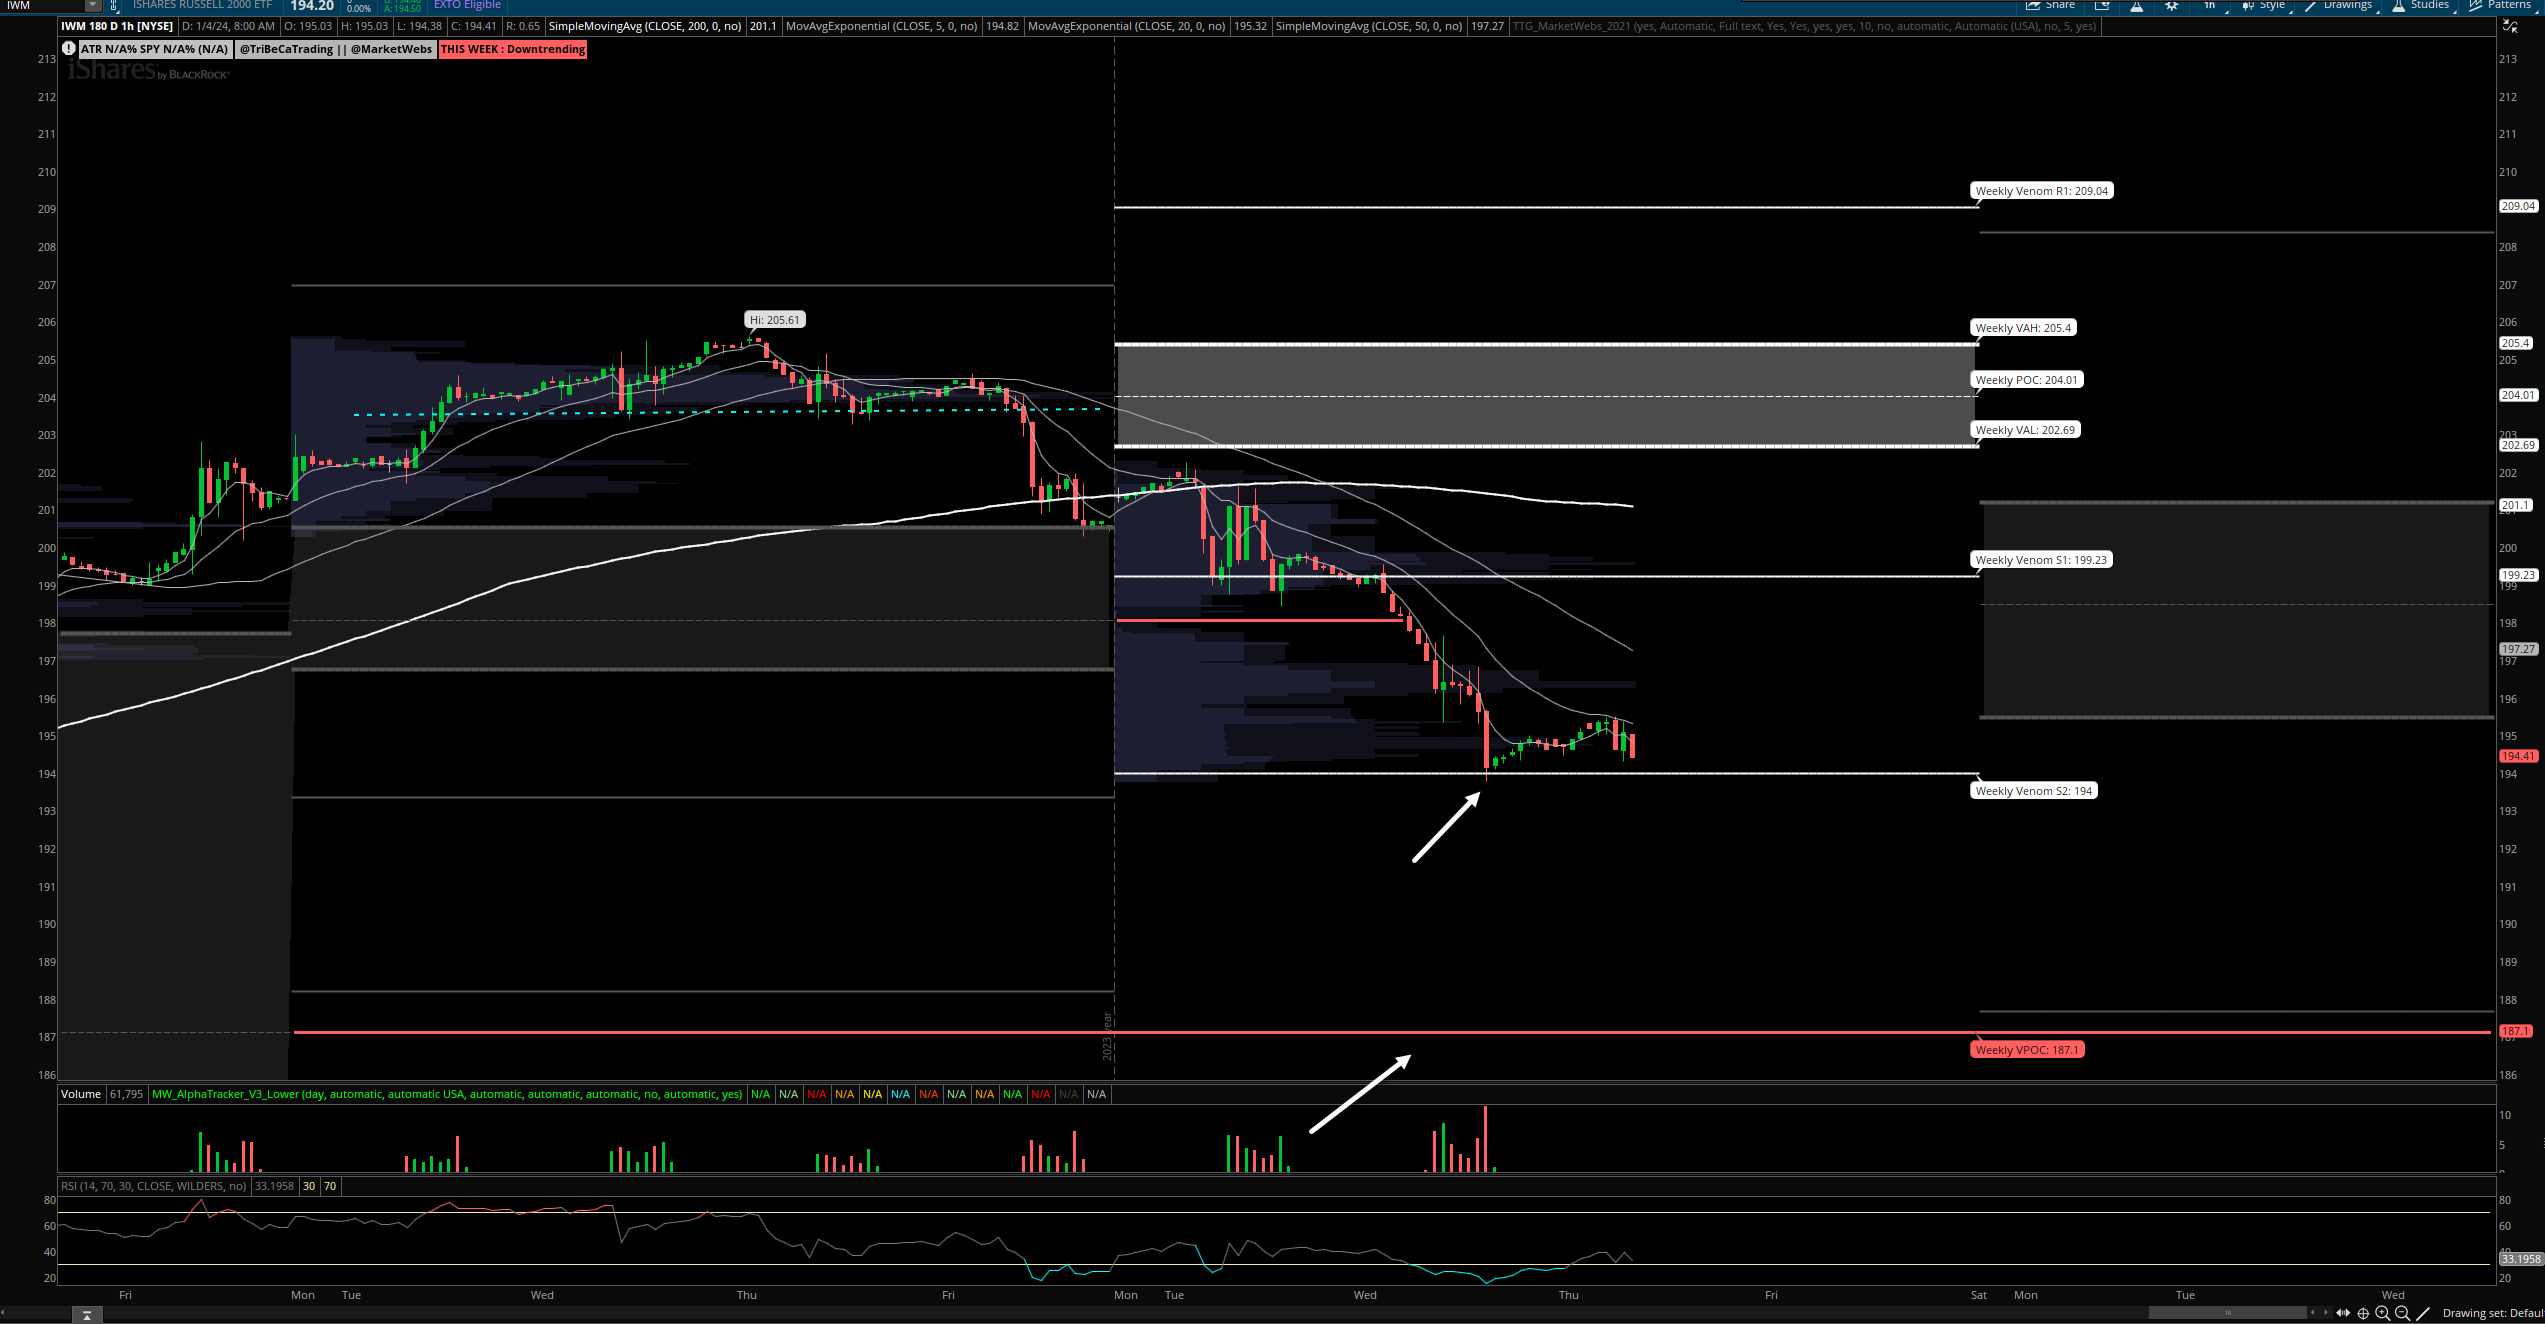
1hr chart: Price pausing at S2 (the second extension from this week's Value Area), but note that is not major support...
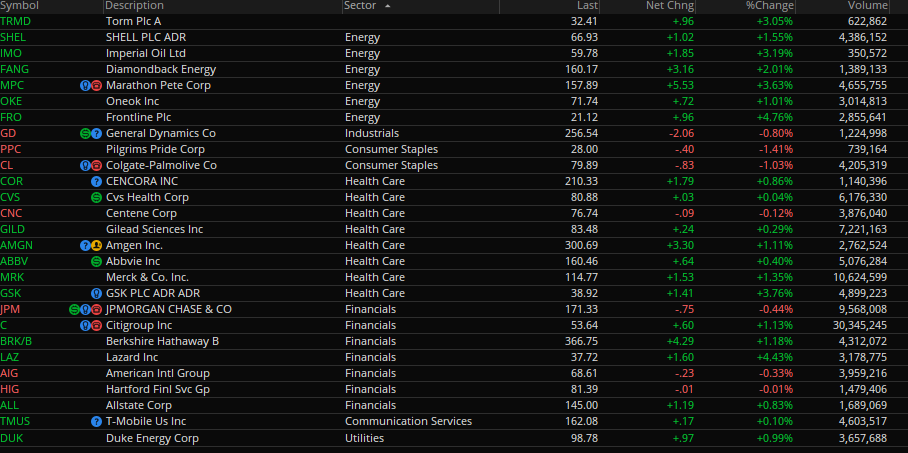
Here is today’s TTG Proprietary Stock Screen “Out of the Box” using Volume At Price
names trending above their Value Areas (on 3 multiple timeframes & not super extended)
Keep reading with a 7-day free trial
Subscribe to The Tribeca Trade Group to keep reading this post and get 7 days of free access to the full post archives.