

TTG Index Charts & Out of the Box Stock Screen 01/22/24 New Watchlist for Week
TTG Index Charts & Out of the Box Stock Screen 01/22/24 New Watchlist for Week
Out of the Box MarketWebs Screen
US Dollar -0.1% / 30yr Bonds +0.7% / Crude +0.1% & Nat Gas -5.2% / Gold -0.1% / Copper -0.7% / BTC -1.2%
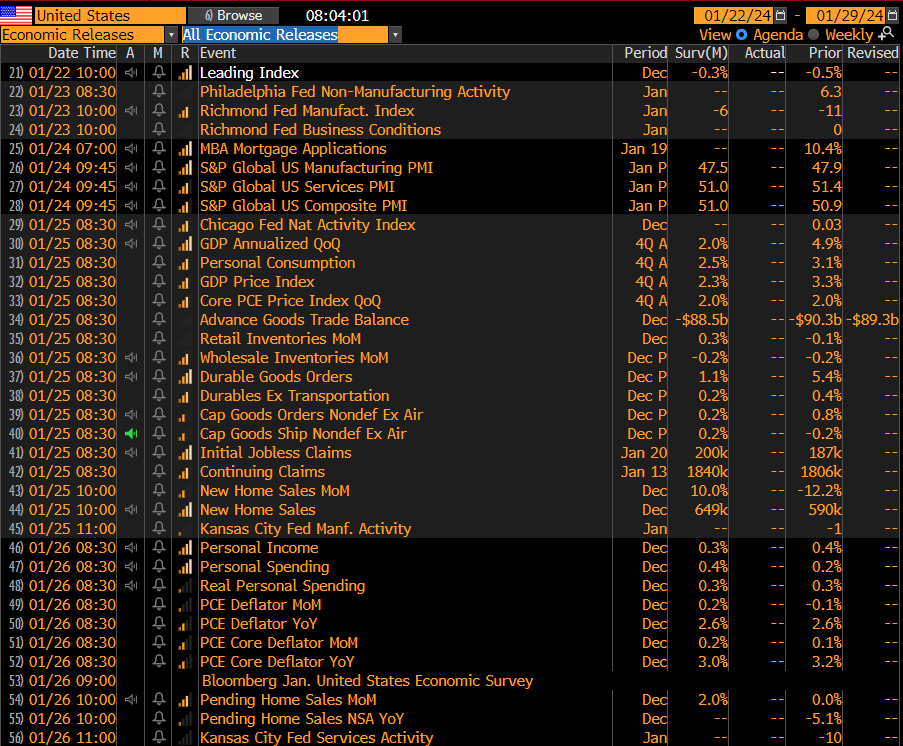
US Upcoming Economics
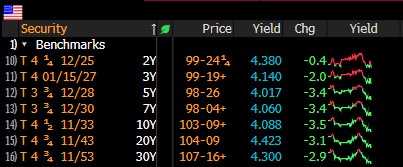
US Bond Yields
Index Updates
At TTG, I use Volume At Price in my chart analysis and I use the MarketWebs Indicator to provide Value Areas & VPOCs which indicate significant support & resistance levels. Learn More Here about Volume At Price and the MarketWebs.
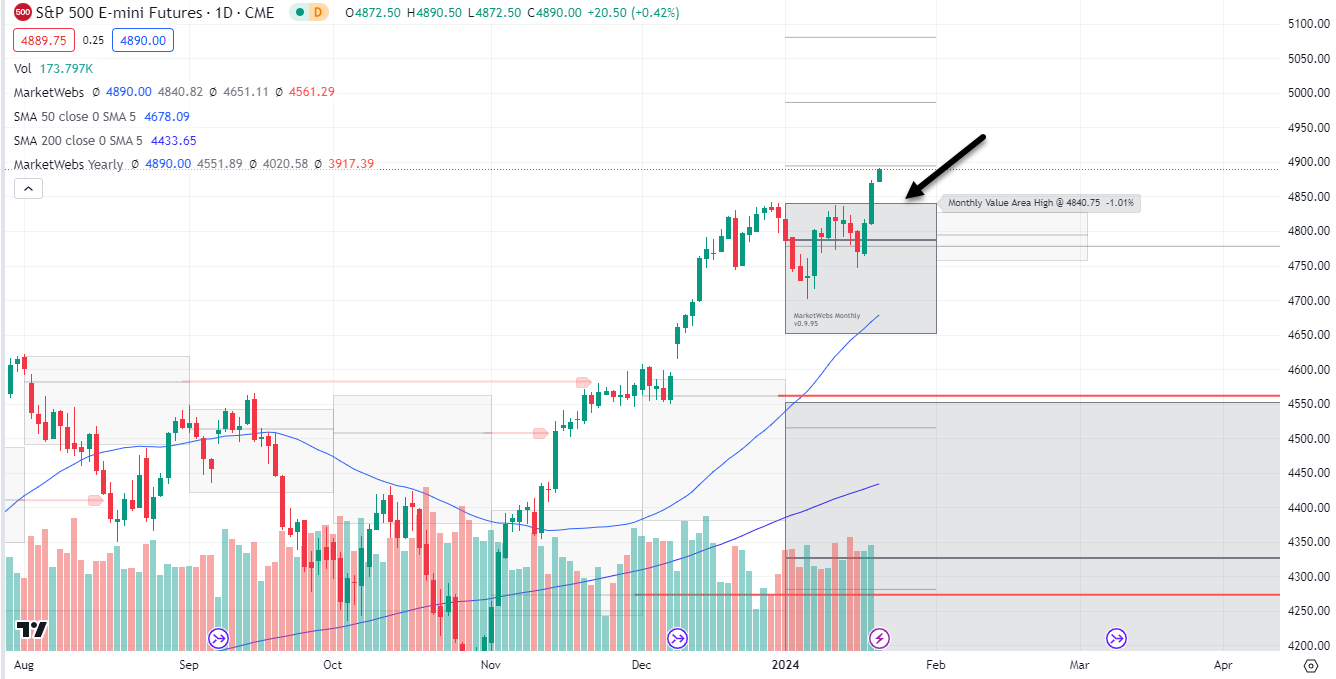
$ES_F- S&P Futures - On Friday, I talked about the possibility of new highs and we certainly got them on Friday! Price has broken out above its Jan Value Area , support to be long against is 4821 . I also like that Bond yields are lower this morning to start the day.
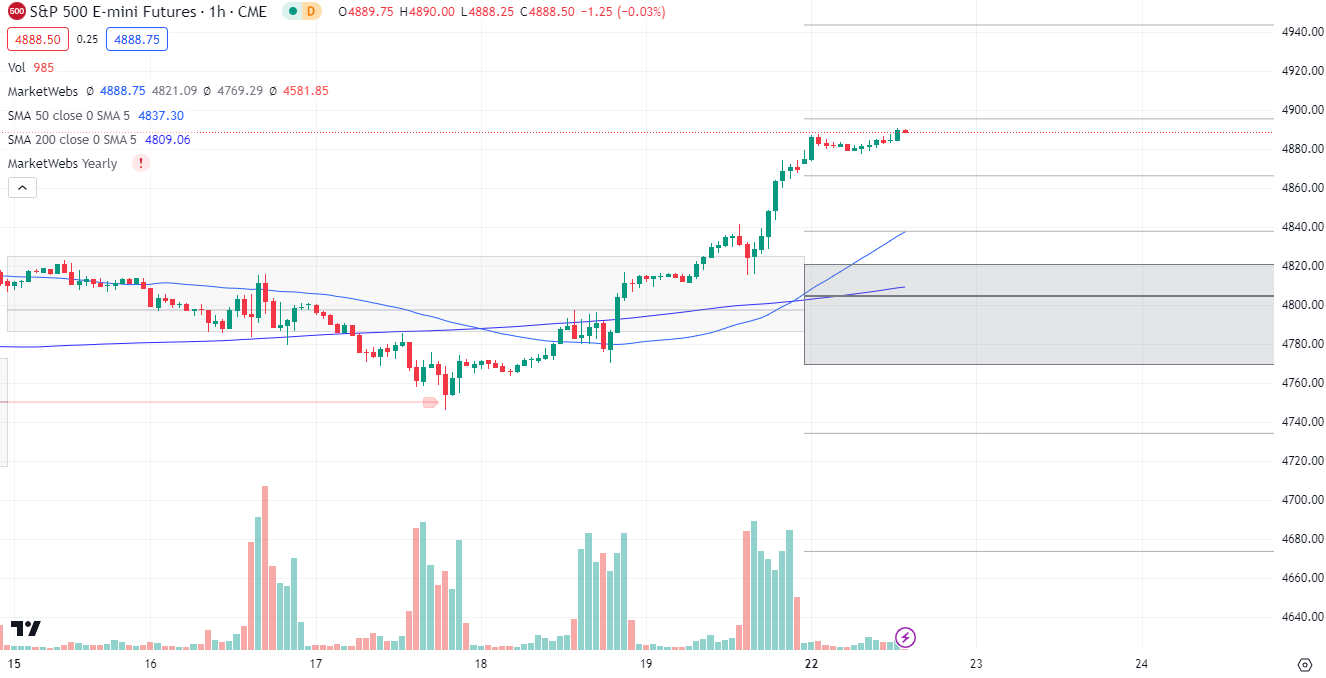
1hr chart: Price starts week above its Value Area for the new week, support also 4821
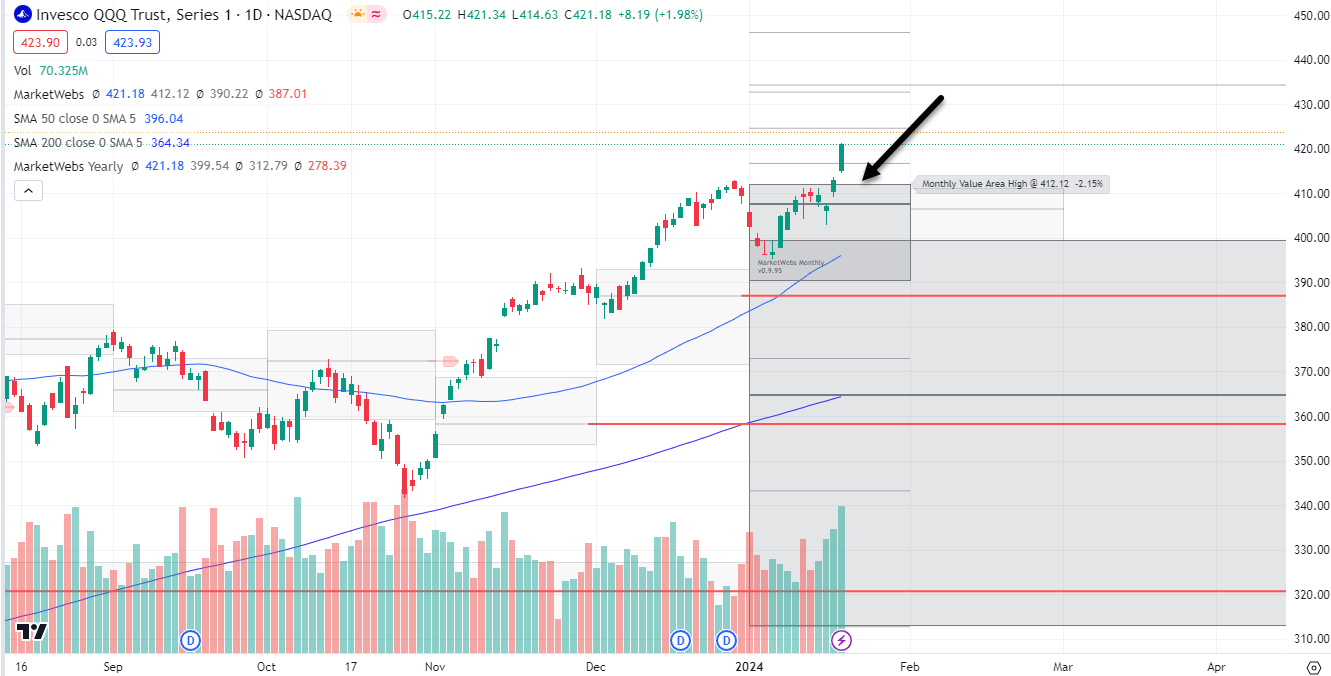
QQQ - NDX 100 ETF - Daily chart: Price breaking out to new highs, ind. +0.6% , support to trade against $412.12
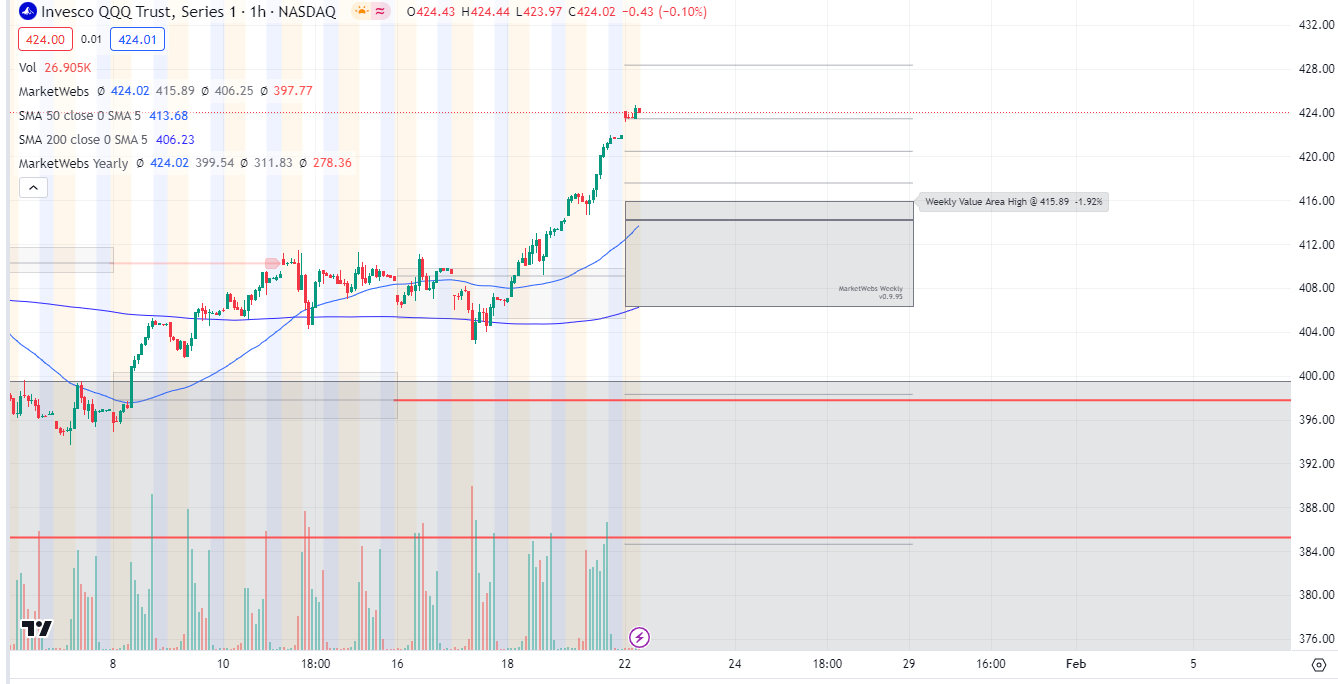
1hr chart: Price starting the week decently above its new Value Area for the week
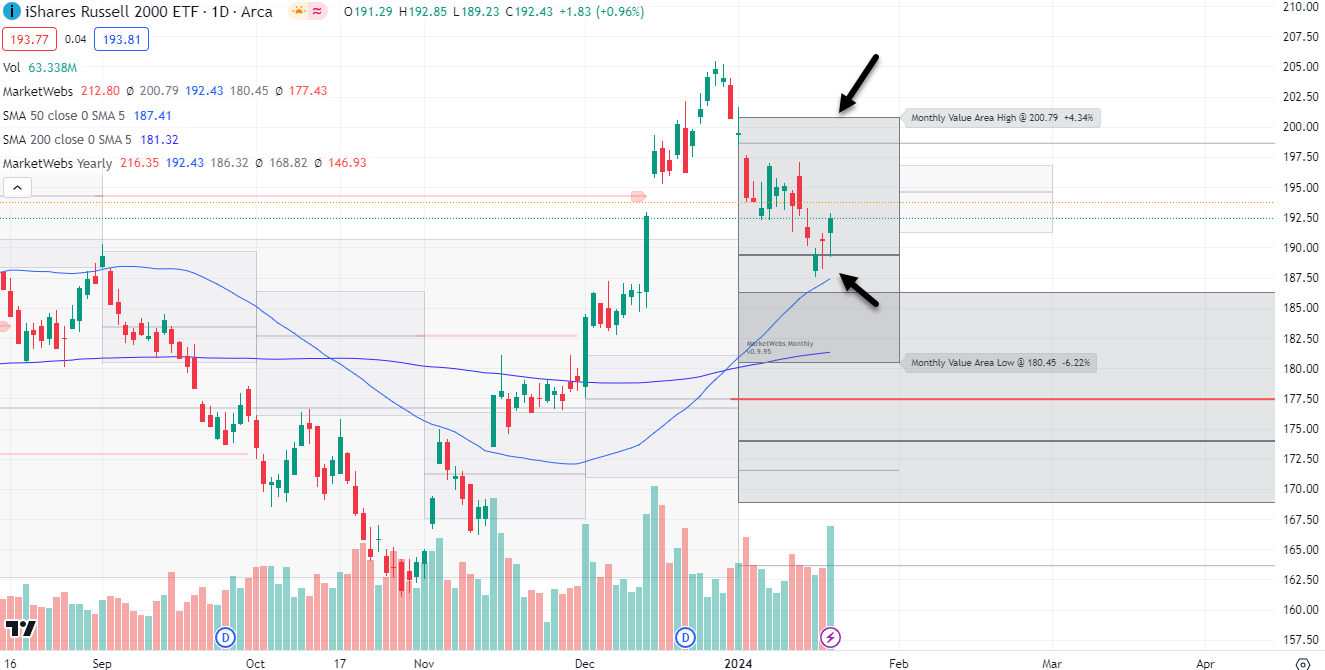
IWM - Russell Small Cap ETF- Price ind. +0.7% and Bond Yields moving lower are helping. Could Small Caps begin to perform here? I think we are going to see a further move lower in rates to help
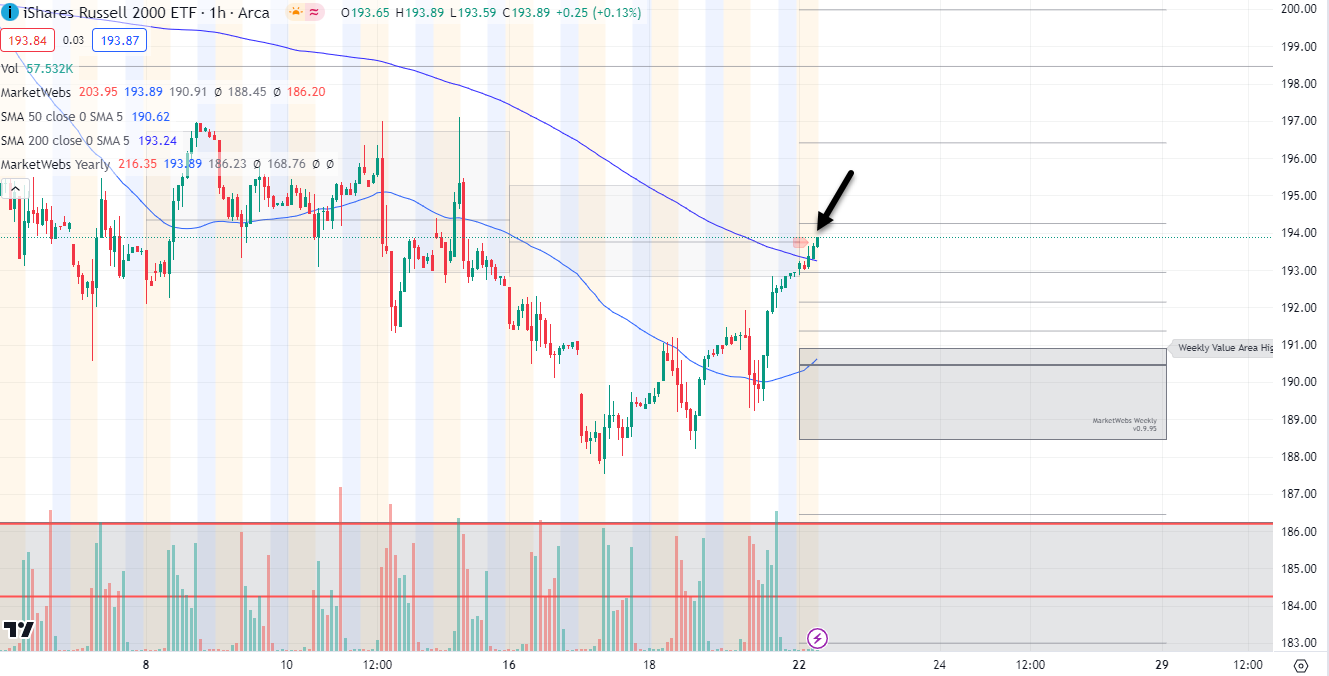
1hr chart: The first test for an advance in Small Caps is that 1hr VPOC take out (last week's POC - Point of Control) let's see if price can stay above $193.8
Here is today’s TTG Proprietary Stock Screen “Out of the Box” using Volume At Price
names trending above their Value Areas (on 3 multiple timeframes & not super extended)
Keep reading with a 7-day free trial
Subscribe to The Tribeca Trade Group to keep reading this post and get 7 days of free access to the full post archives.