

TTG Index Charts & Out of the Box Stock Screen 3/1/24 $CNQ
TTG Index Charts & Out of the Box Stock Screen 3/1/24 $CNQ
Out of the Box MarketWebs Screen
US Dollar flat / 30yr Bonds -0.2% / Crude +1.8% & Nat Gas -0.8% / Gold +0.3% / Copper -0.3% / BTC +0.5%
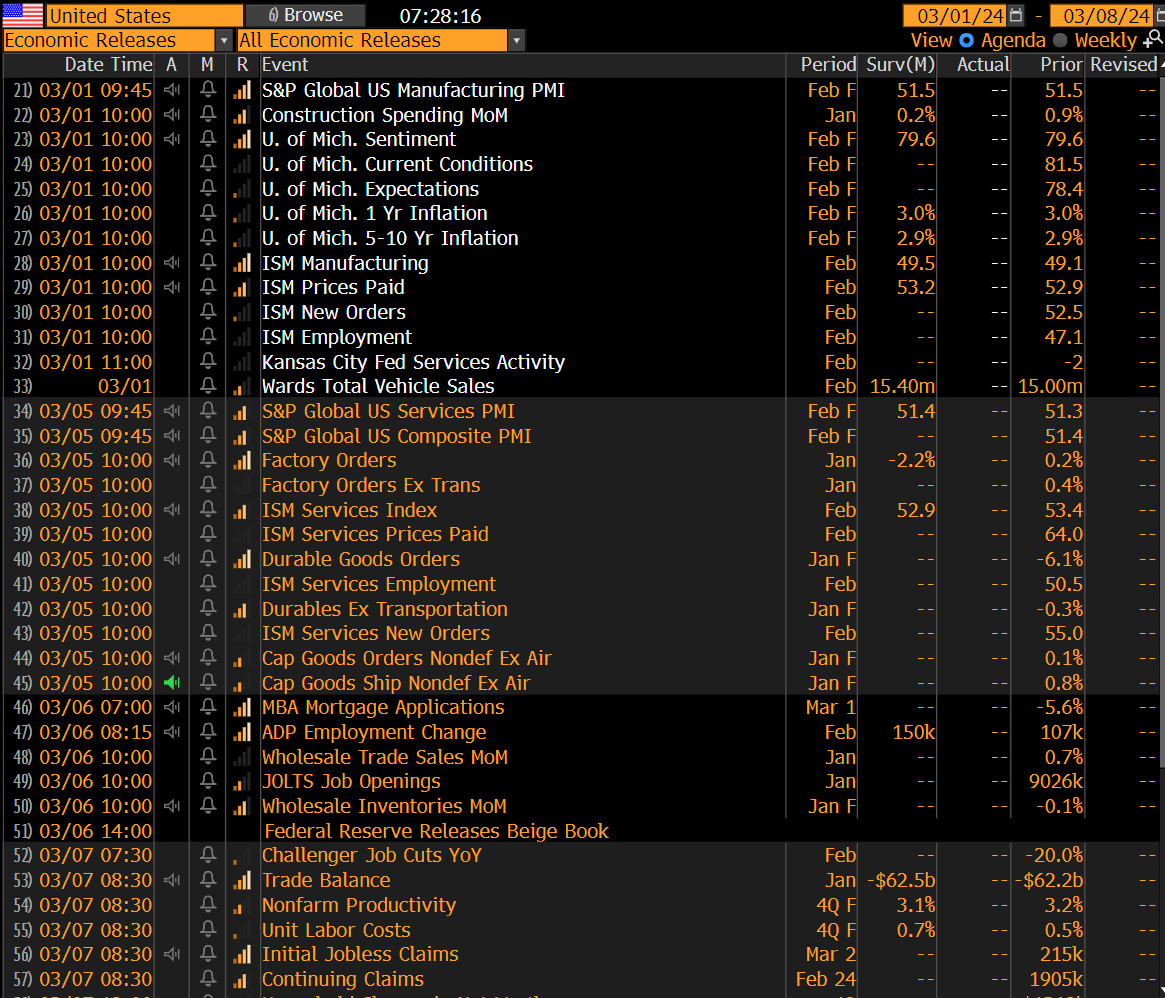
US Upcoming Economics
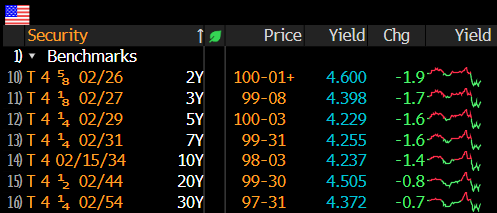
US Bond Yields
Index Updates
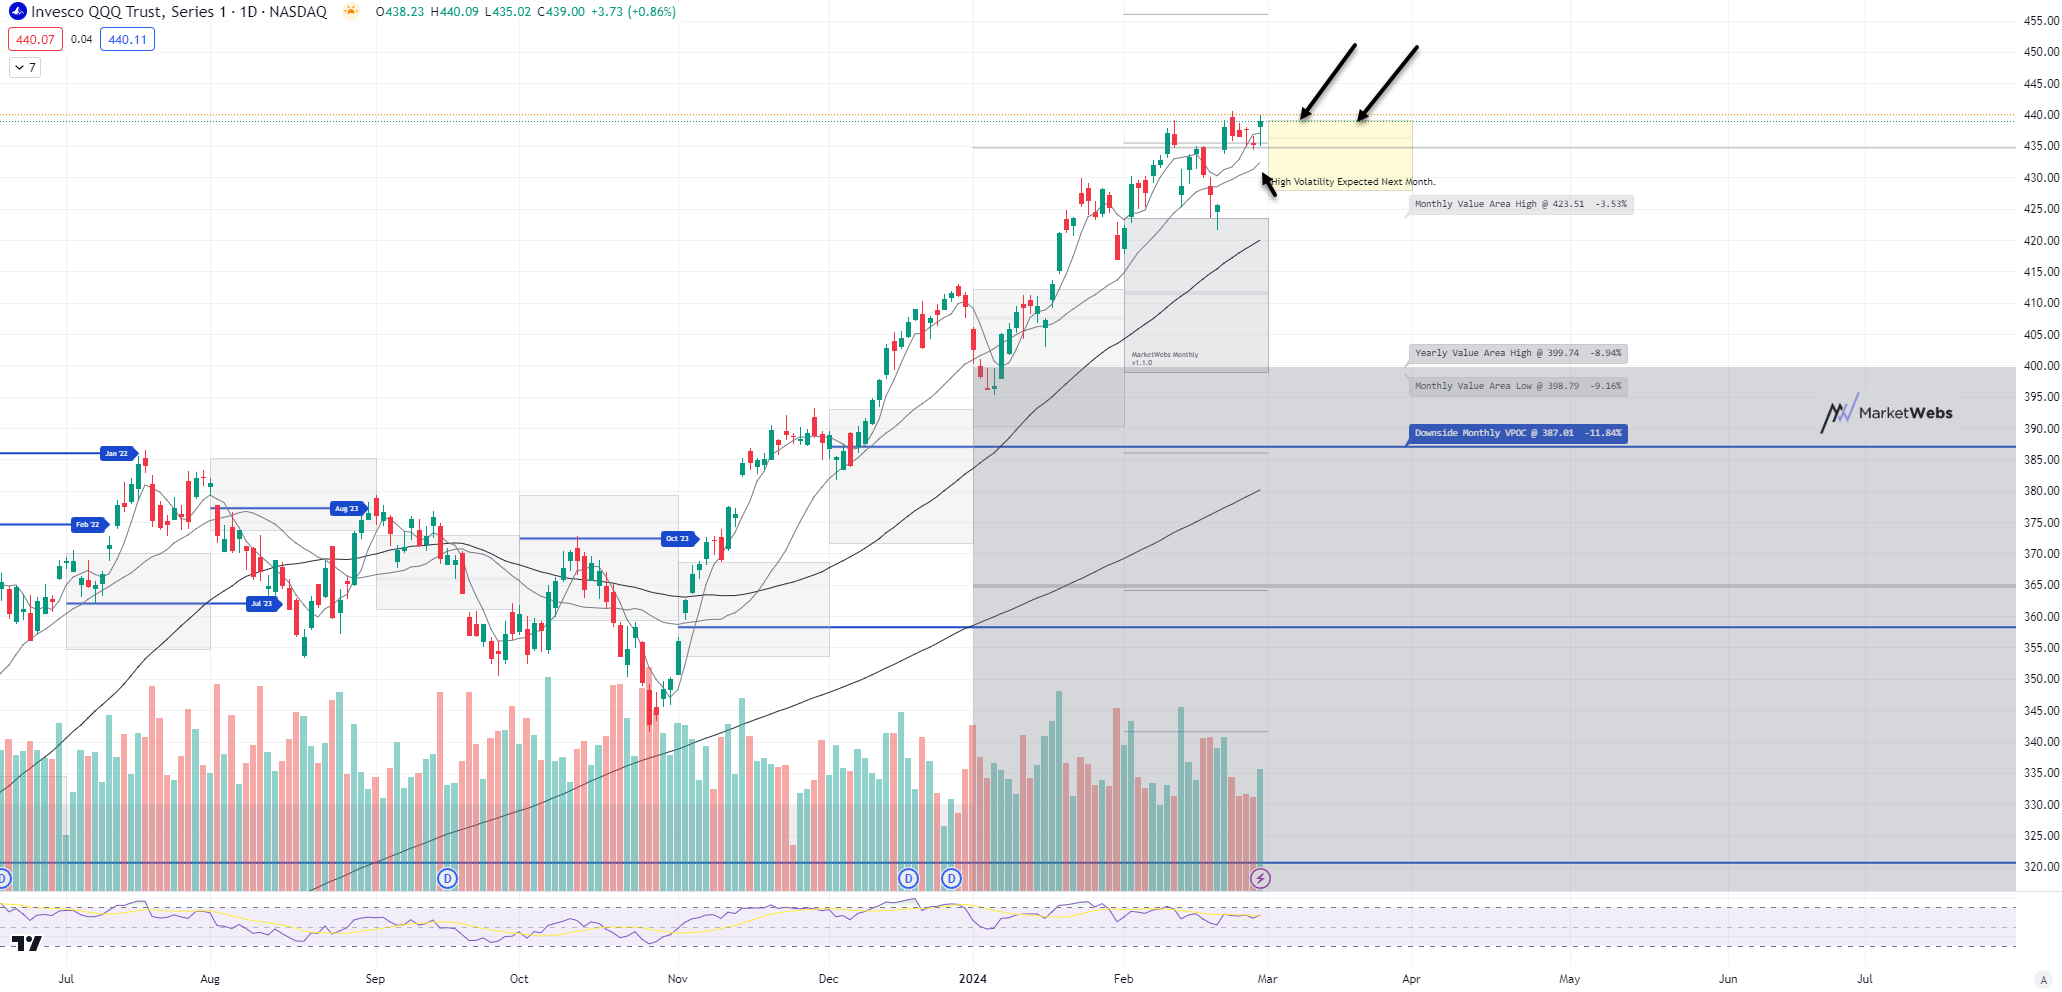
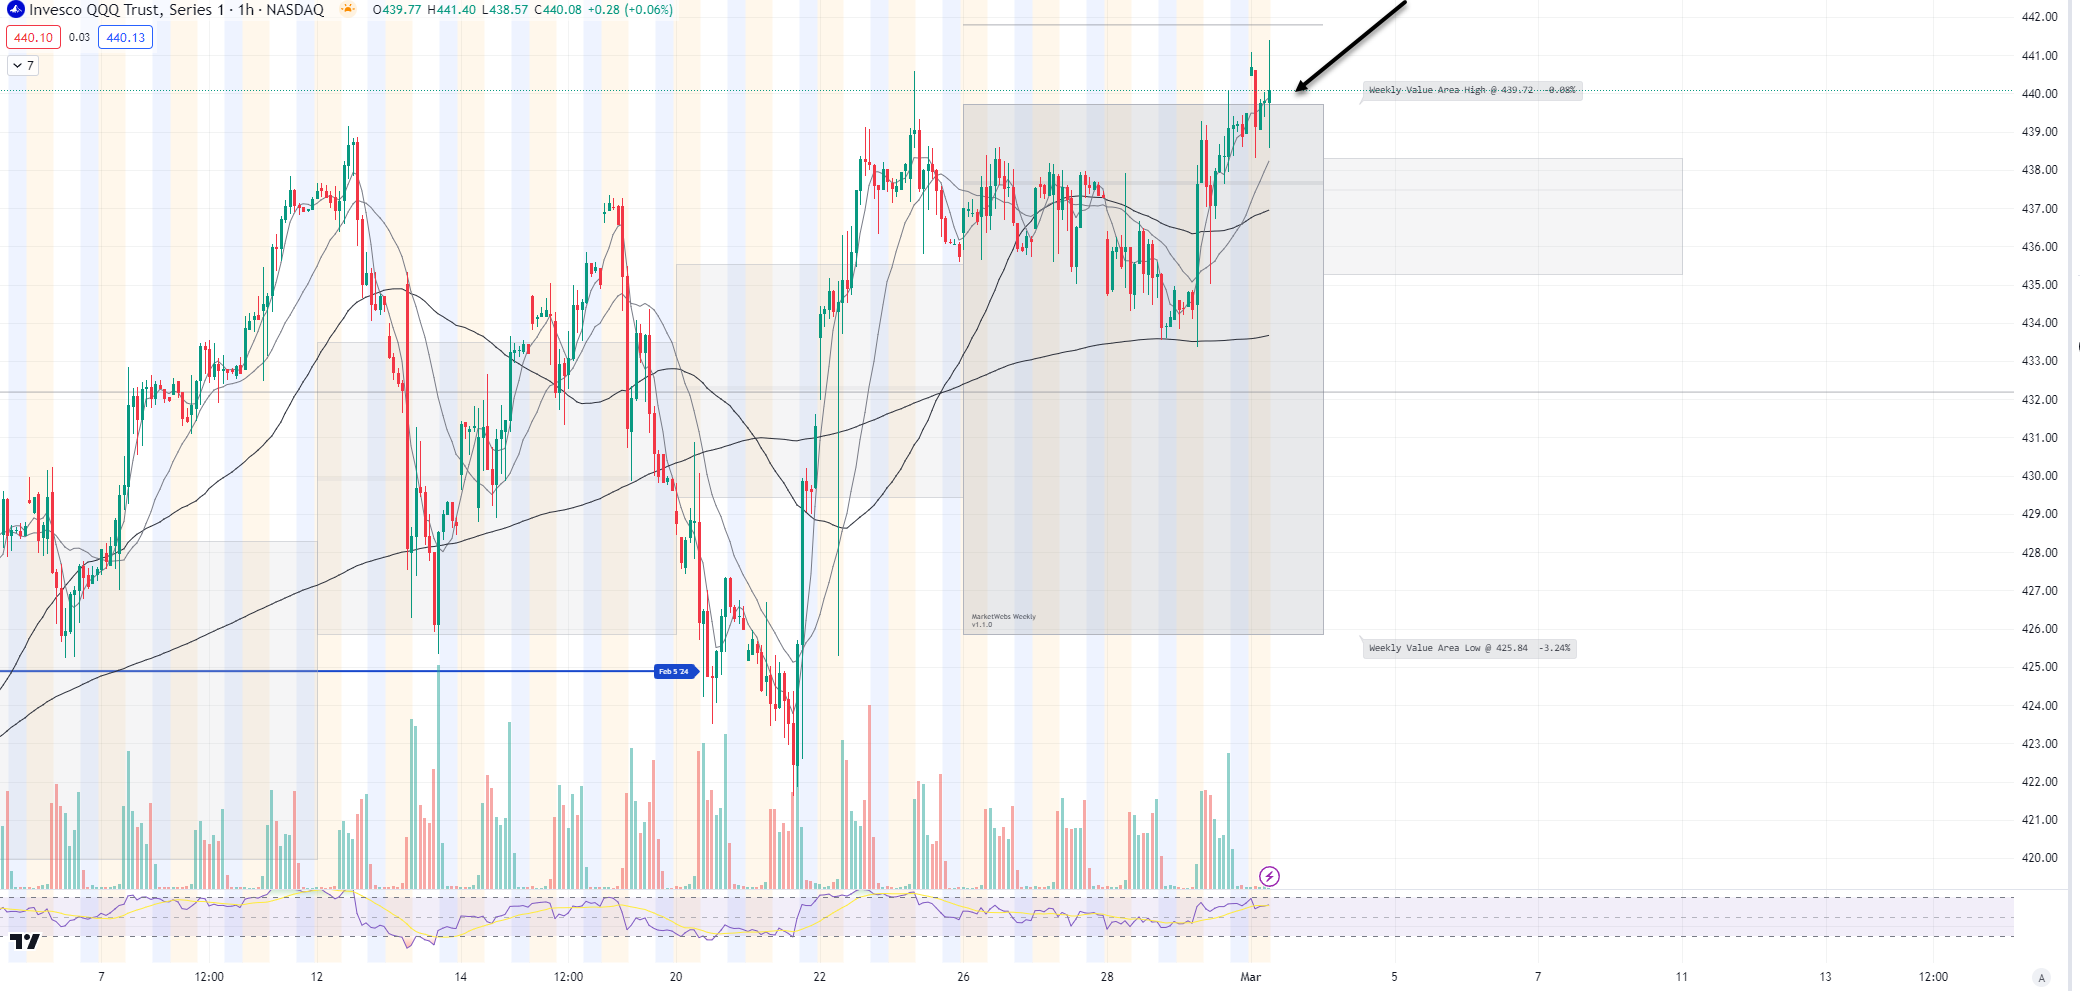
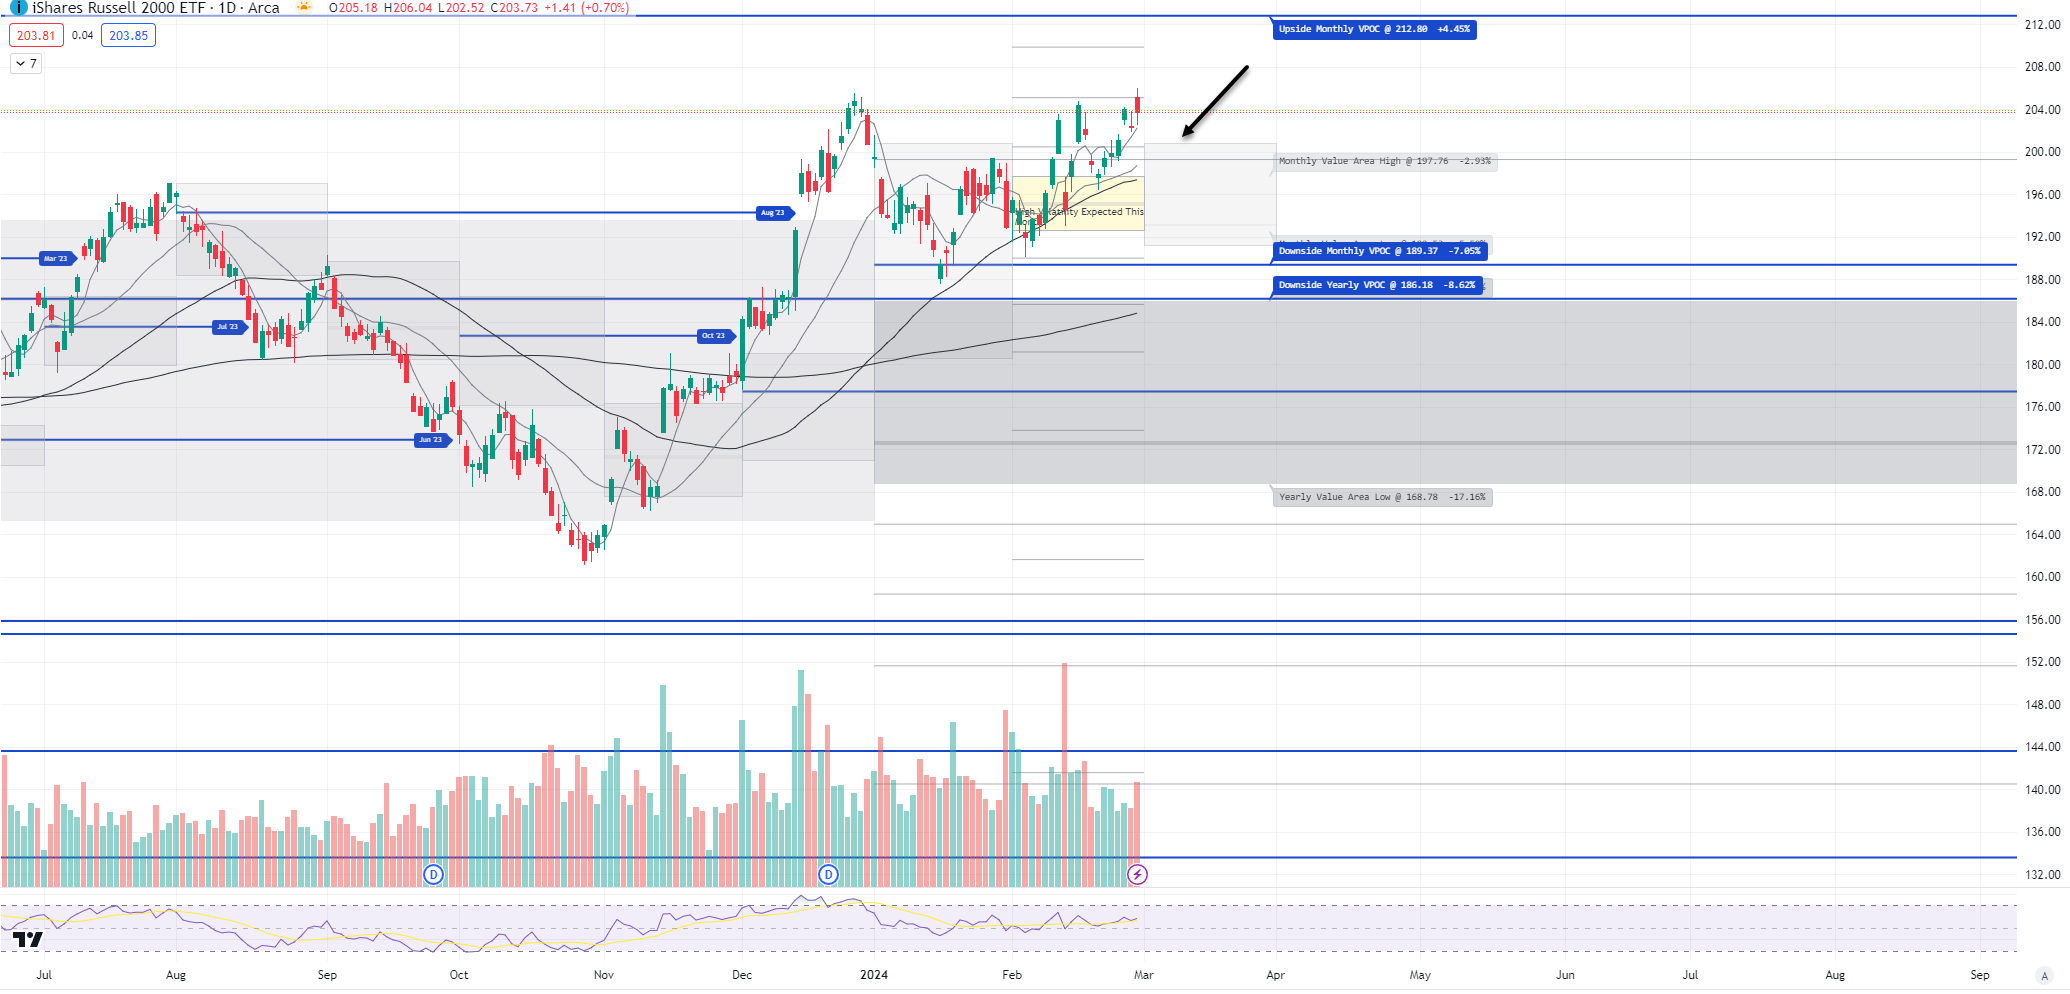
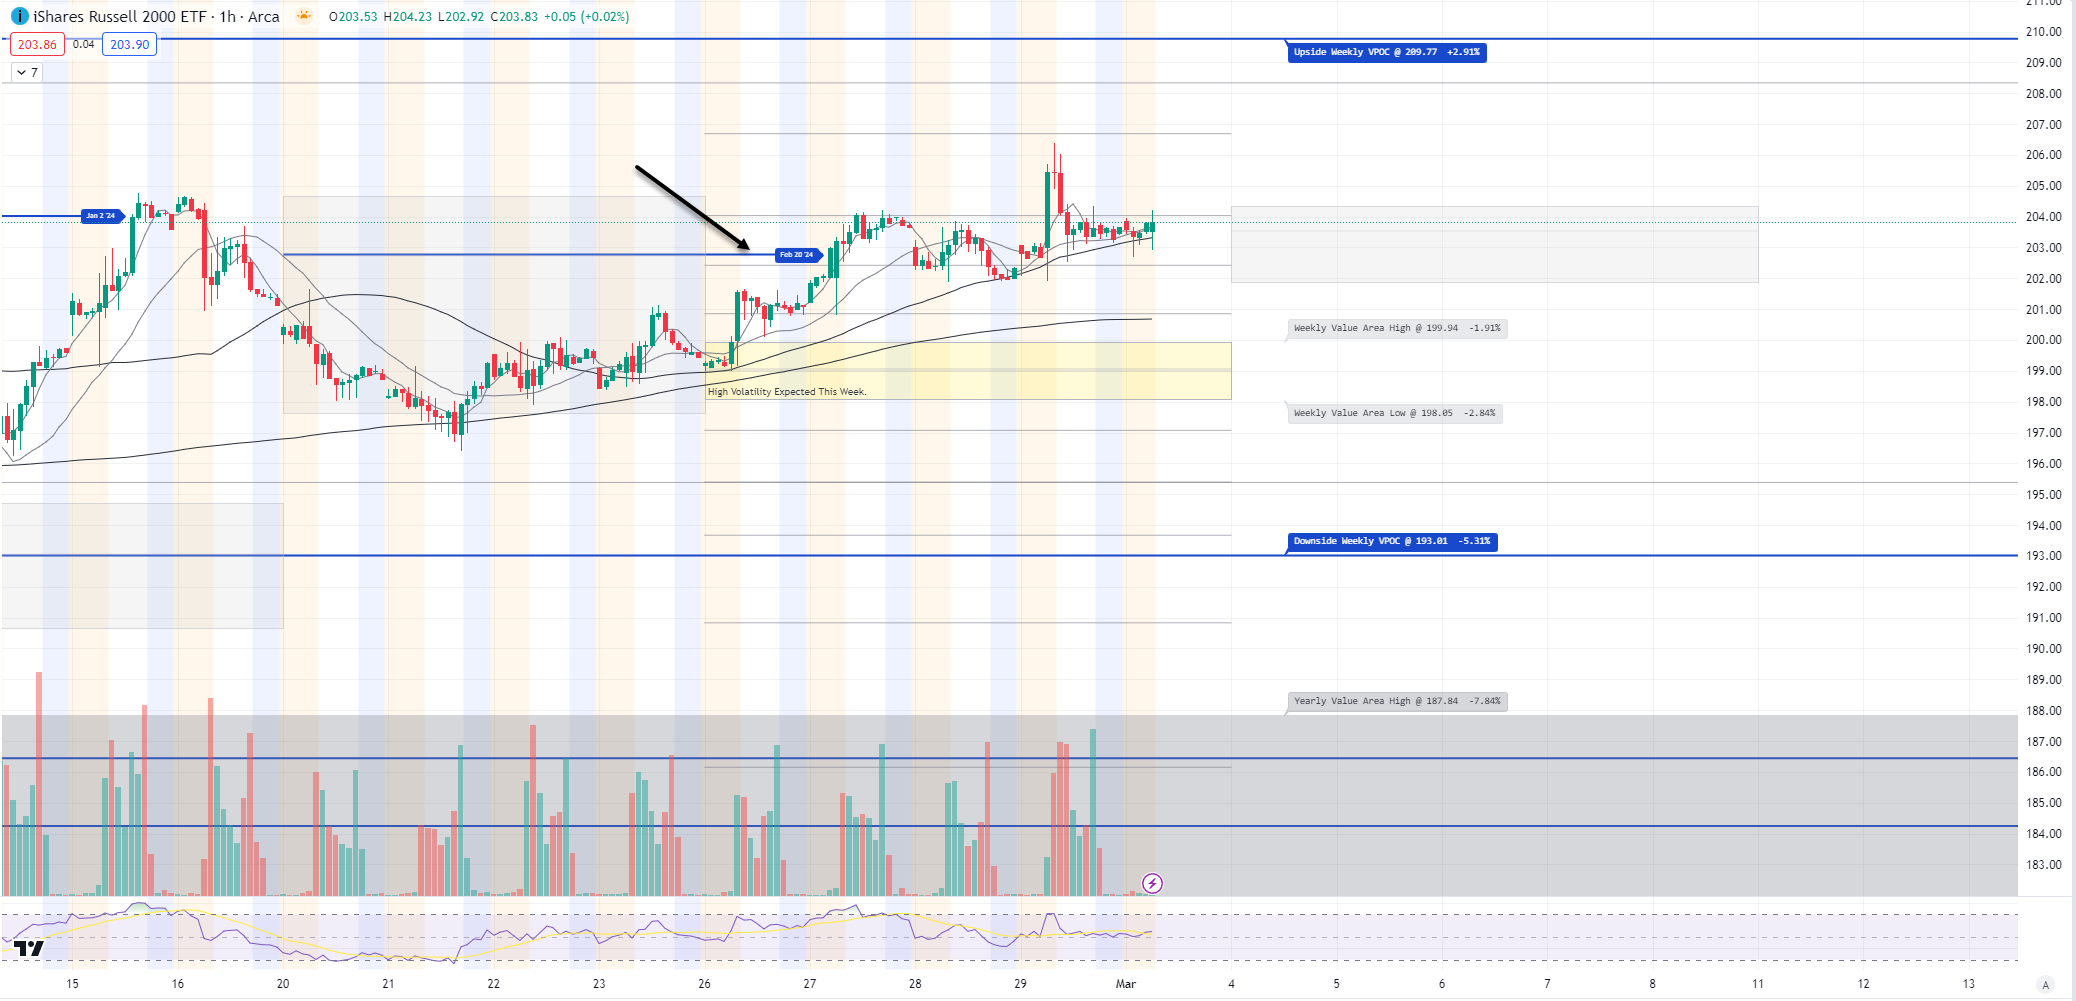
At TTG, I use Volume At Price in my chart analysis and I use the MarketWebs Indicator to provide Value Areas & VPOCs which indicate significant support & resistance levels. Learn More Here about Volume At Price and the MarketWebs.
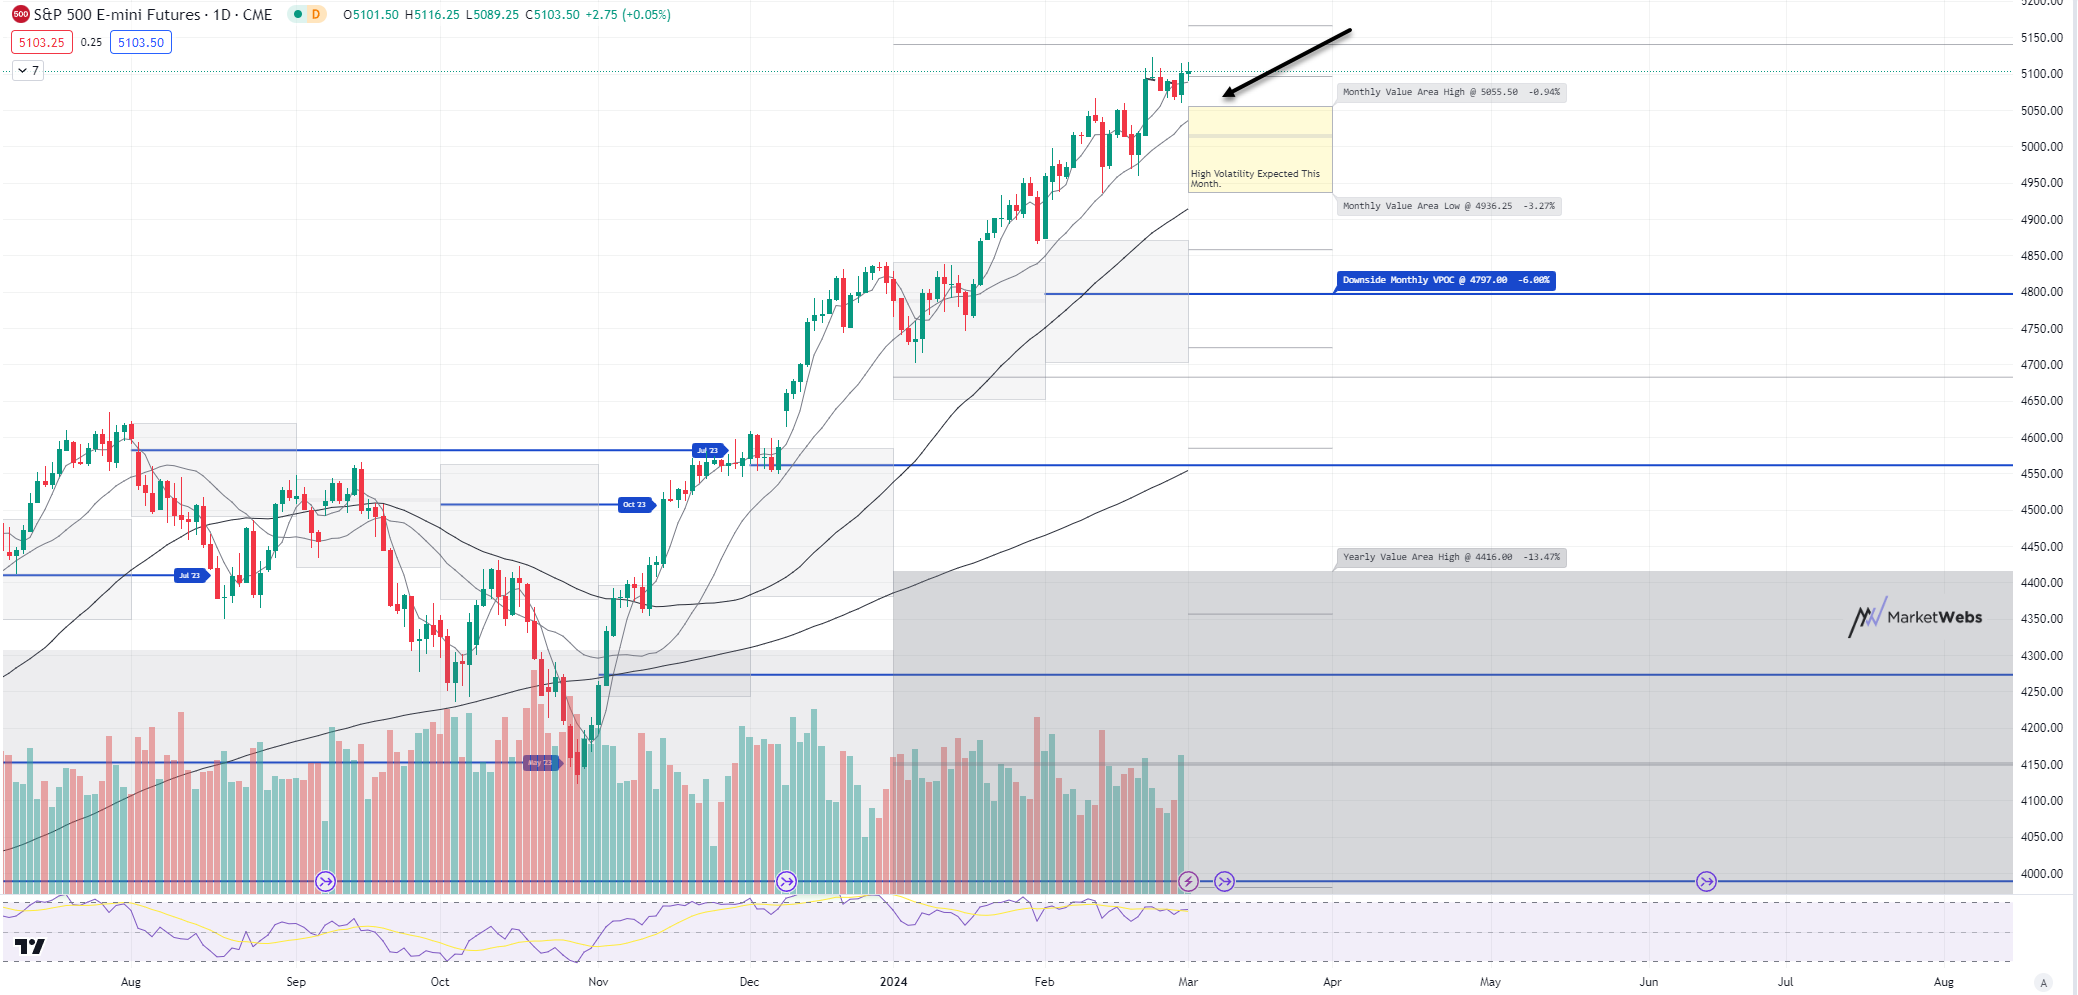
ES_F - SPX Futures - Price ~ flat as we start the new month and price starts above the new Value Area for the month of March. Support to watch will be 5055.5
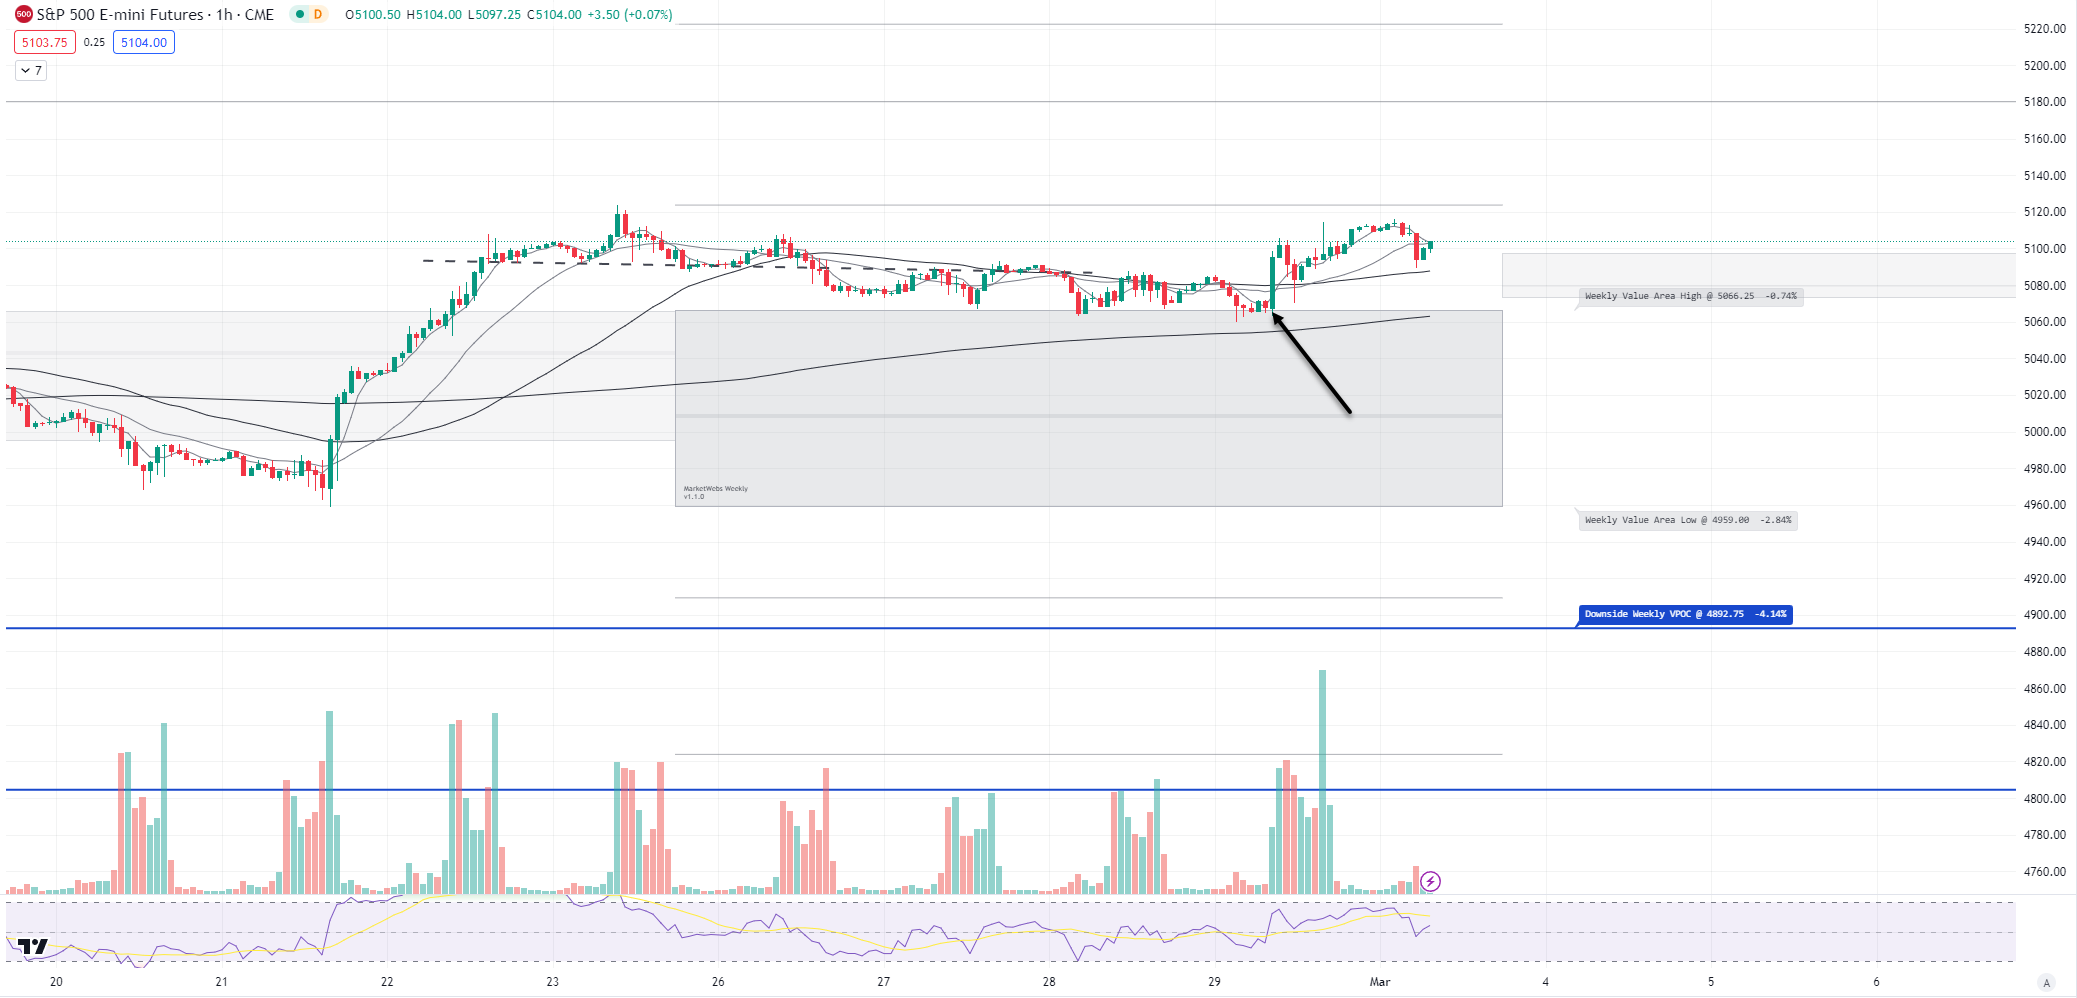
1hr chart: Price got a nice bounce at the top of this week's Value Area after yesterday's economics. Support for the week remains 5066
QQQ - NDX 100 ETF - Daily chart: Price ind. +0.1% to start March. Price will start right at the top of its new Value Area for the month, watch $439 top of Value Area
1hr chart: Price rallied yesterday +0.9% and is now at the top of its Value Area for the week, watch $439.72
IWM - Russell Small Cap ETF- Price also ~ flat this morning and will open the new month above its March Value Area, support to watch will be $200.7
1hr chart: Price remains above its Value Area for the week and slightly above that VPOC takeout (blue line) from earlier in week
Here is today’s TTG Proprietary Stock Screen “Out of the Box” using Volume At Price
names trending above their Value Areas (on 3 multiple timeframes & not super extended)
Keep reading with a 7-day free trial
Subscribe to The Tribeca Trade Group to keep reading this post and get 7 days of free access to the full post archives.