
TTG End of Day Trading Note 1-19-24
TTG End of Day Trading Note 1-19-24
Themes, Out of Box Screen, CF Trading Position's, TTG Watchlist, Chart of the Day
Today's Themes:
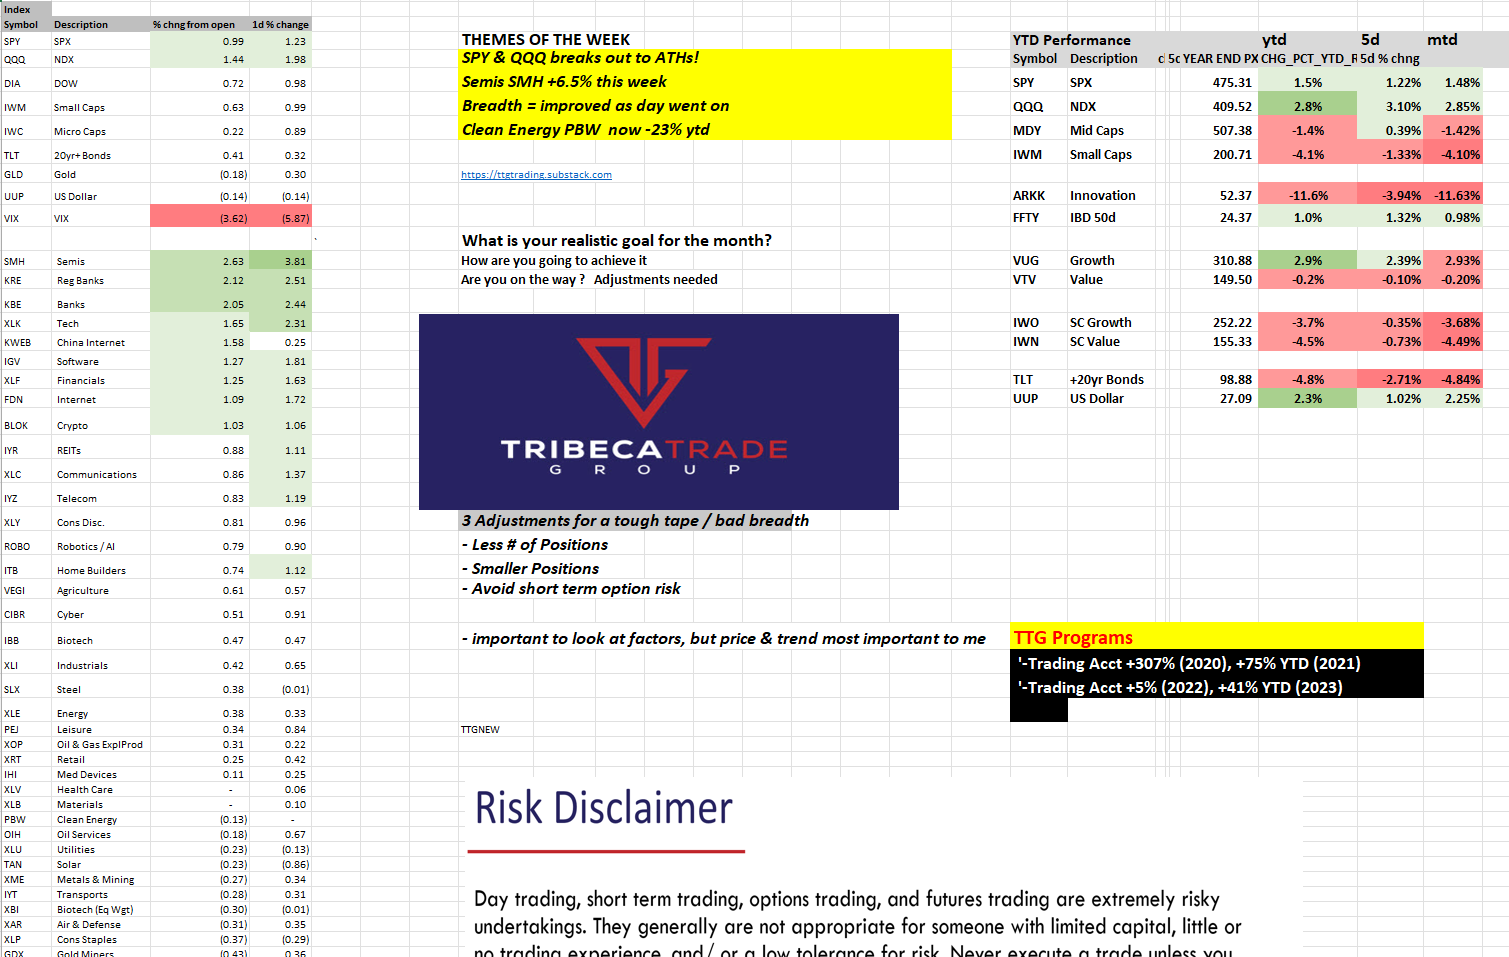
SPY & QQQ breaks out to ATHs!
Semis SMH +6.5% this week
Breadth = improved as day went on
Clean Energy PBW now -23% ytd
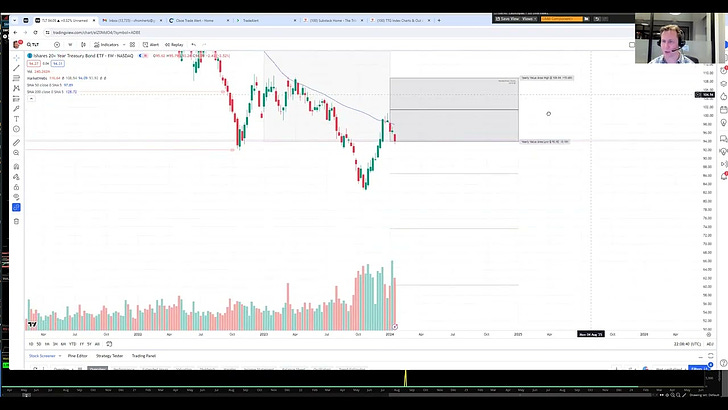
TLT holds on to its yearly Value Area by the skin of its teeth
TTG End of Day Video
Market Performance, % change from open
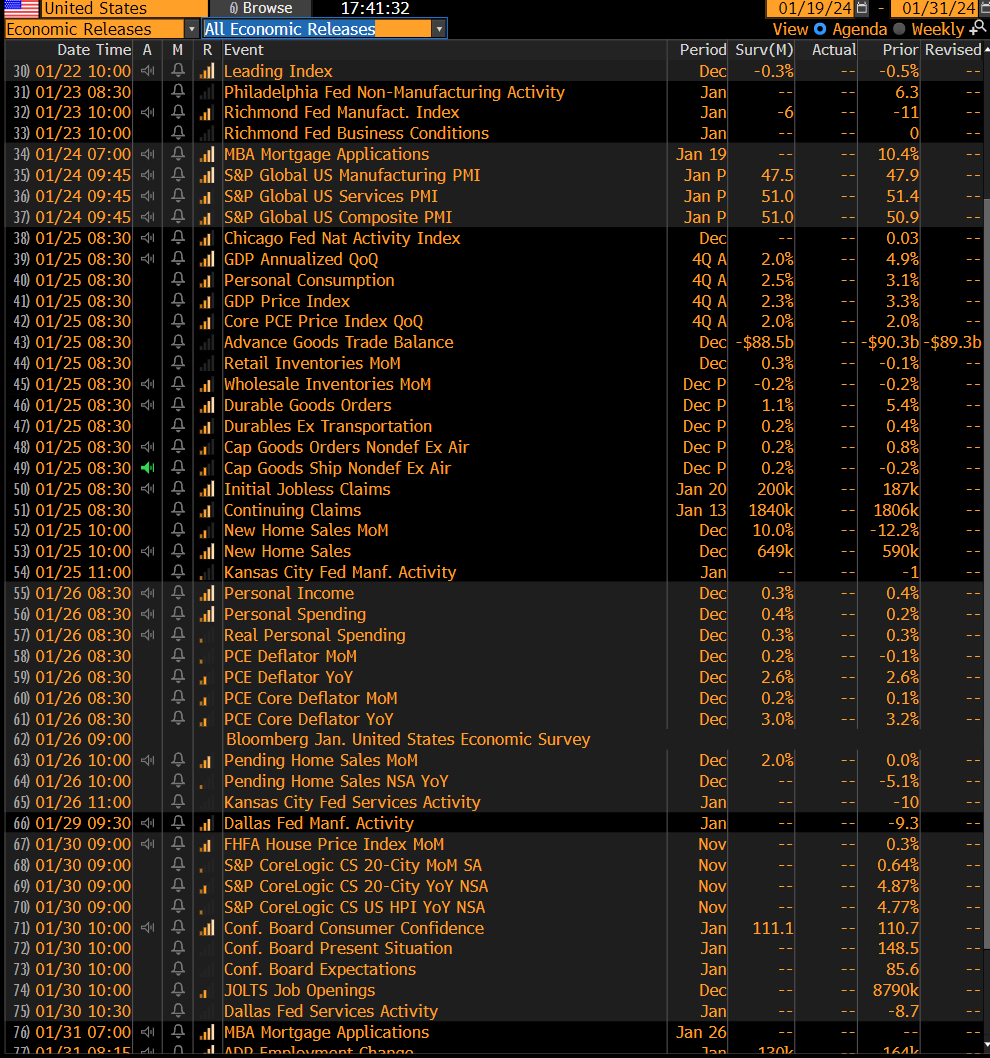
US Upcoming Economics
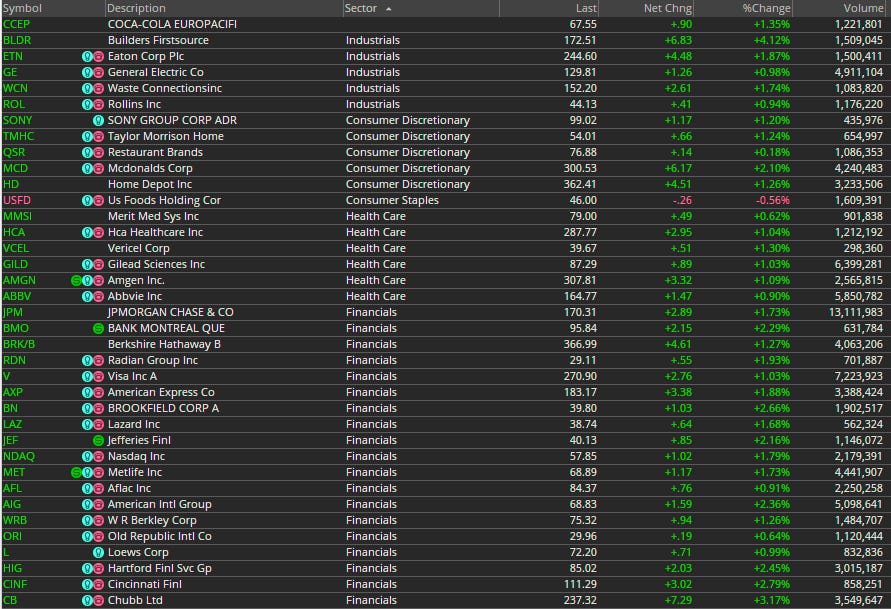
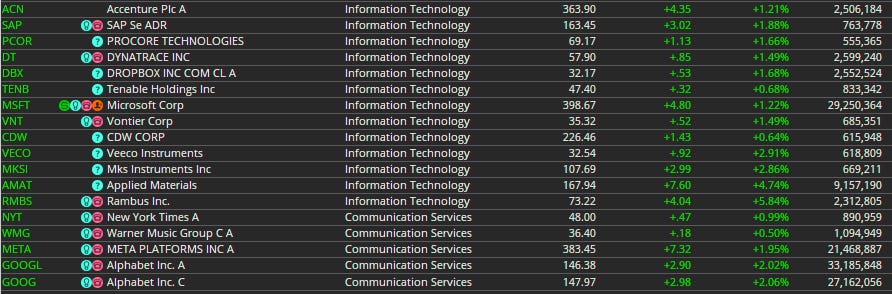
Here is today’s TTG Proprietary Stock Screen “Out of the Box” using Volume At Price
names trending above their Value Areas (on 3 multiple timeframes & not super extended
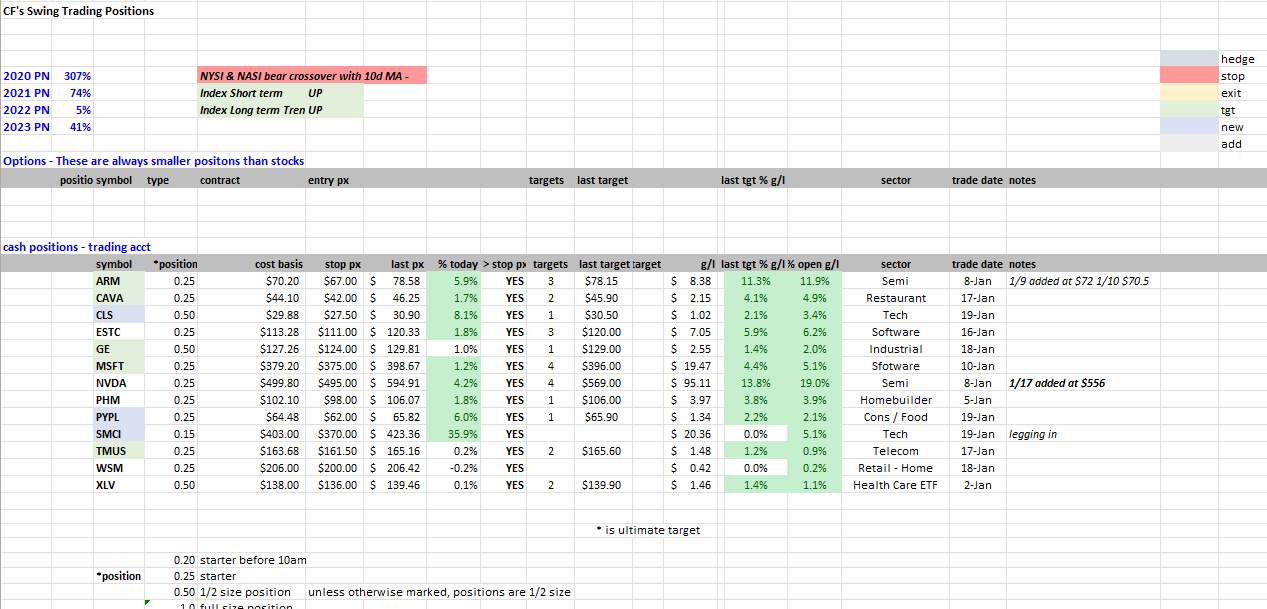
Trading Account Portfolio: Position Sheet
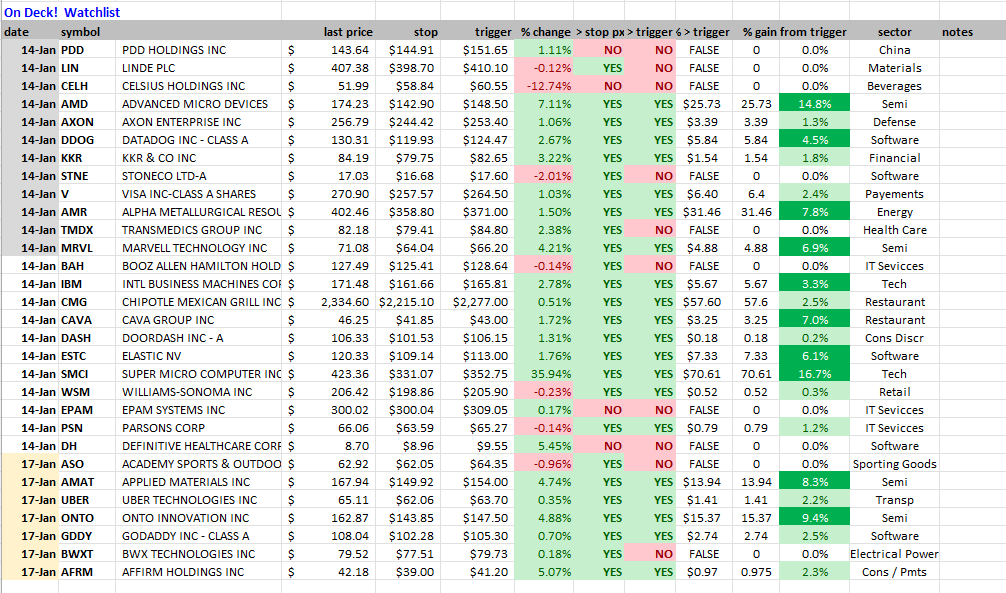
Weekly Watchlist & The Great 8 (note all charts for the watchlist names are posted in the TTG Trading Room)
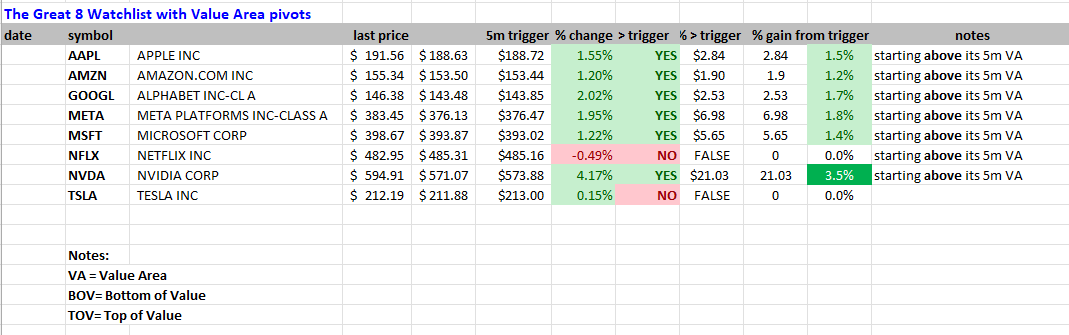
At TTG, I use Volume At Price in my chart analysis and I use the MarketWebs Indicator to provide Value Areas & VPOCs which indicate significant support & resistance levels. Learn More Here about Volume At Price and the MarketWebs.
Chart(s) of the Day
SMCI Daily Chart
- This has to be the stock chart of the day - what a move on HUGE volume.
- This is a major break of the sideways range & its possible name is just starting to trend higher
- For now I added a small position & will look to add on an inside day / small pull back

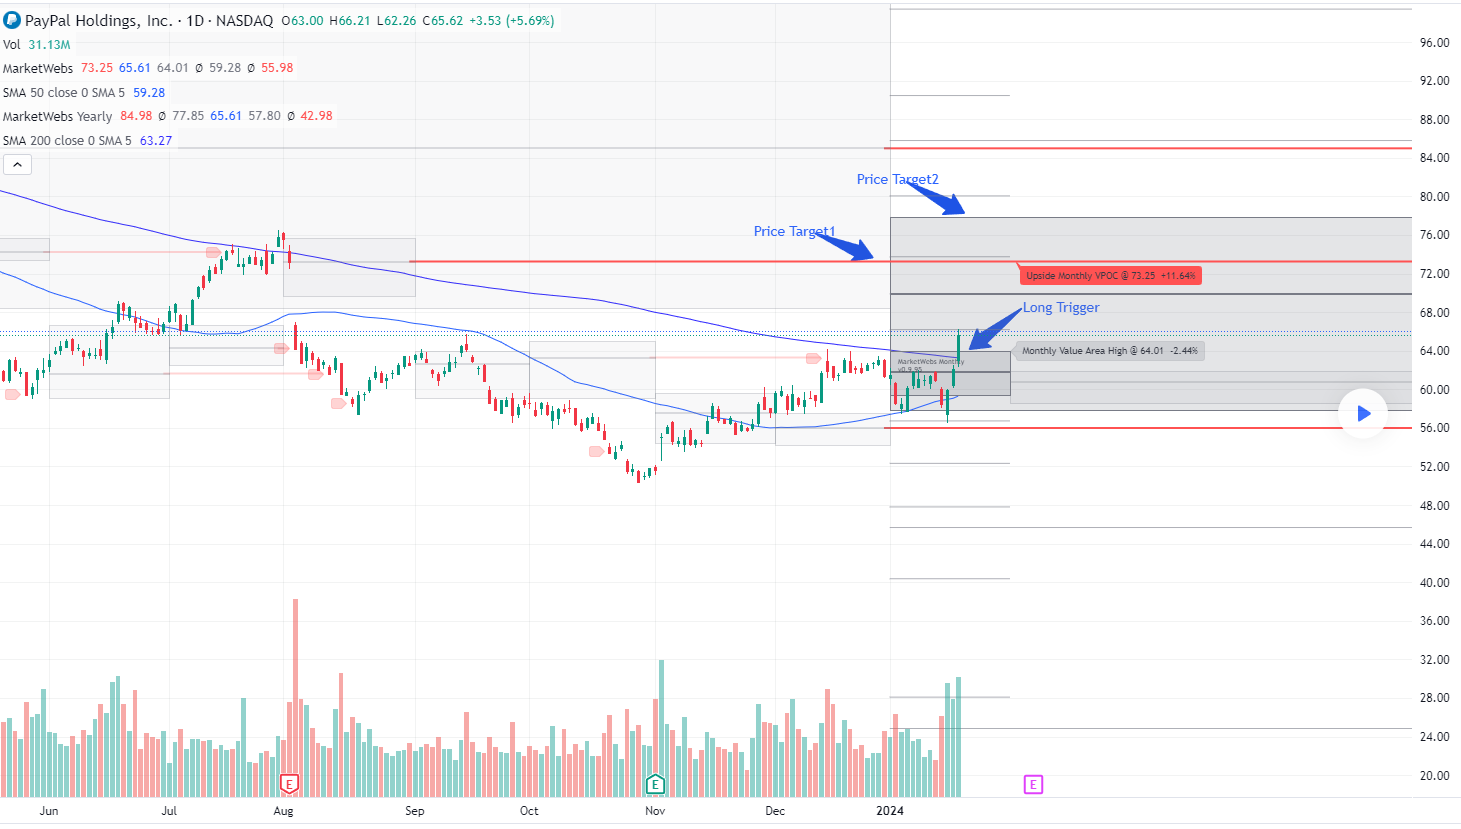
PYPL Daily Chart & Yearly Value Area
- I have avoided PYPL like the plague because it has been in a downtrend for 2yrs and has been a major underperformer. The 200d MA has been the tell as it broke below the 200d MA back in Sept '21 and has continue to trend lower... until recently.
So,what has changed?
The Technicals have changed:
1. Simply, today it has reclaimed its 200d MA
2. It has rallied above its Jan Value Area using VolumeAtPrice concepts using the "MarketWebs" Indicator.
- this means it is breaking above its previous price & volume December range.
So, it appears it is changing character!
My Price targets are also based on Volume At Price "MarketWebs" = $73.25 VPOC from Daily Chart & $77.85 top of the yearly Value Area
Where does this Trade Idea go wrong? If it falls back below the 200d MA or back inside its Jan Value Area $64. Which I would use as a stop price ($64)
TLT Daily Chart & Yearly Value Area
- TLT was -2.5% this week and is testing the bottom of this year’s Value Area. If it breaks further, I would imagine it will put further pressure in Small Caps and higher beta areas of the marker so TLT will be a must watch next week.

Here is what you can do to help make them possible and support my work.
Leave a like on this post below
Share the post
Subscribe!
Click here if interested in more analysis via the TTG Trading Room!
Copyright © Tribeca Trade Group. All of the information in this newsletter is for entertainment and educational purposes only and is not to be construed as investment or trading advice. None of the information in this newsletter is guaranteed to be accurate, complete, useful or timely. IMPORTANT NOTICES AND DISCLAIMERS TriBeCa Trade Group is not an investment advisor and is not registered with the U.S. Securities and Exchange Commission or the Financial Industry Regulatory Authority. Further, owners, employees, agents or representatives of TriBeCa Trade Group are not acting as investment advisors and might not be registered with the U.S. Securities Authority