


The TTG Market Pulse 7-11-25
Get up to speed on all the most important Market Trends & Themes + Trade Ideas, Watchlist & Open Positions
Breadth
-34% Up Volume = Weak Breadth
- TICKs also weaker today


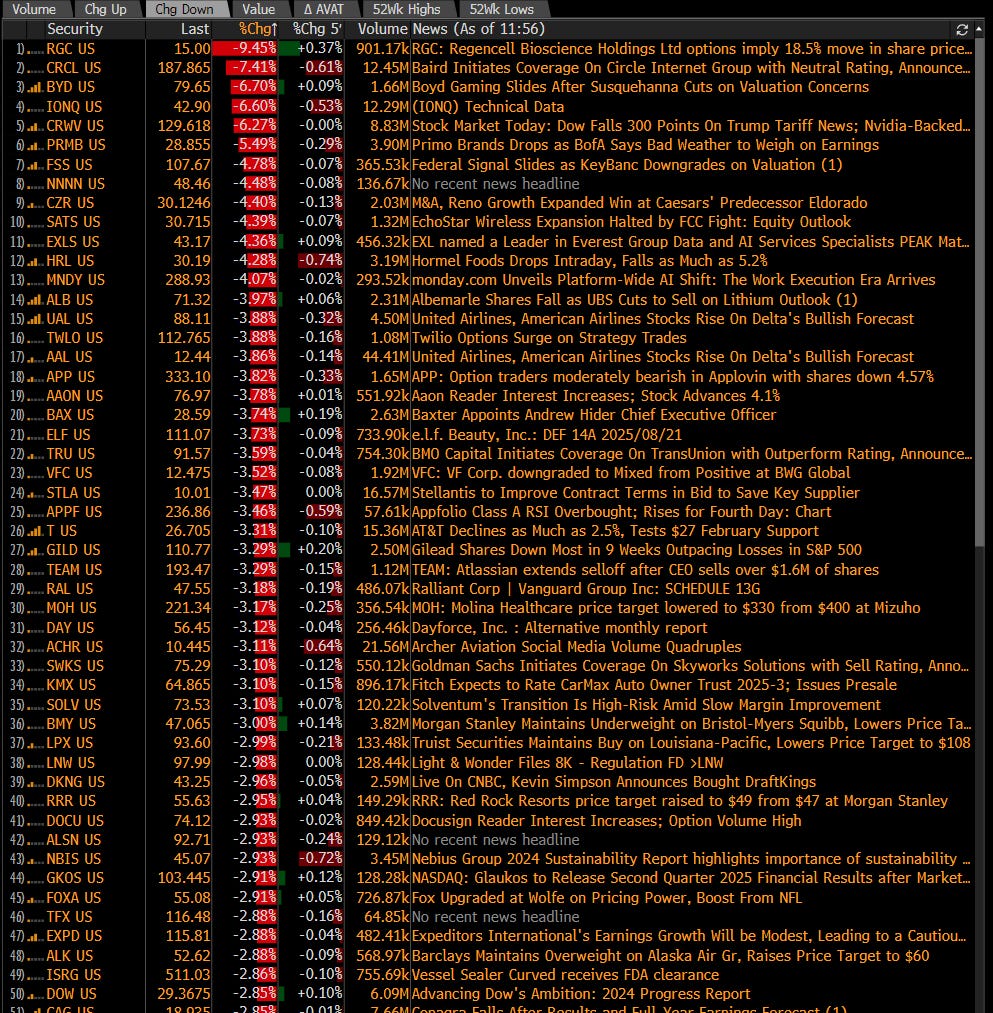
Movers (Mkt Cap > $5B)
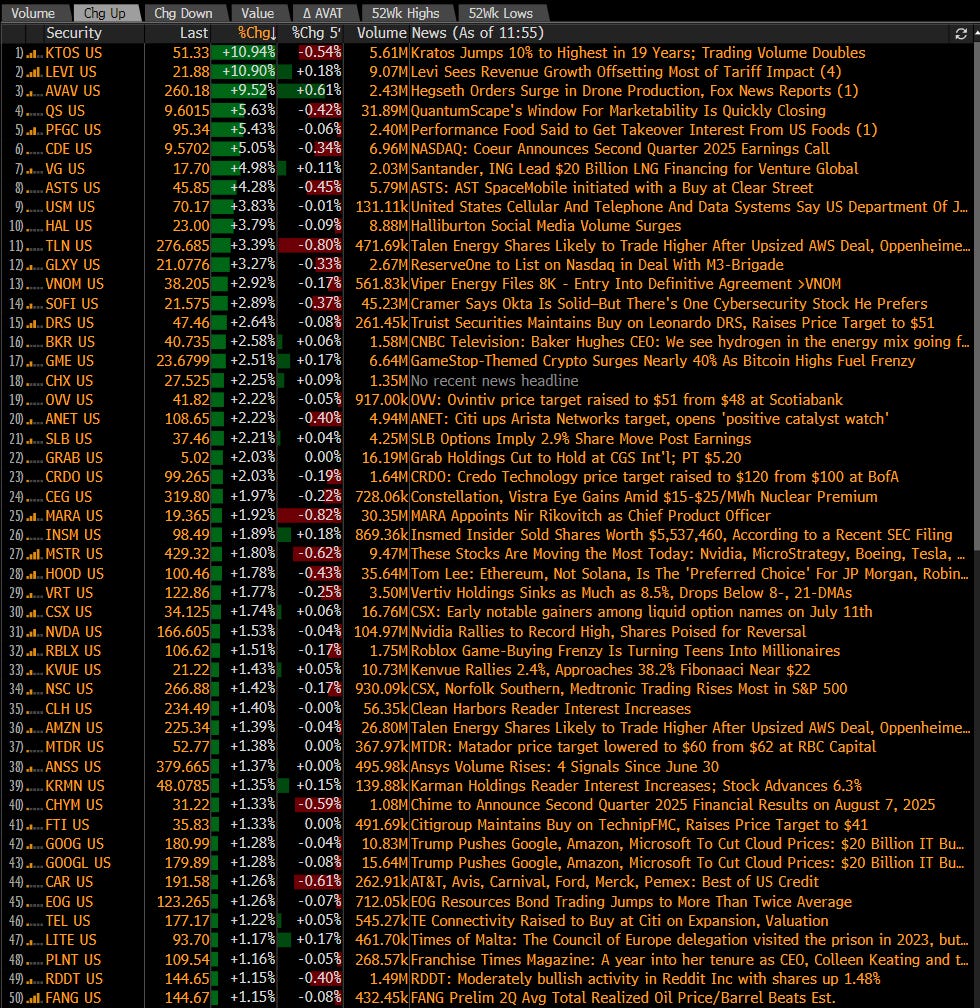
Mag 7 names - NVDA AMZN GOOGL leading

% Change From Open & Themes (see yellow box)
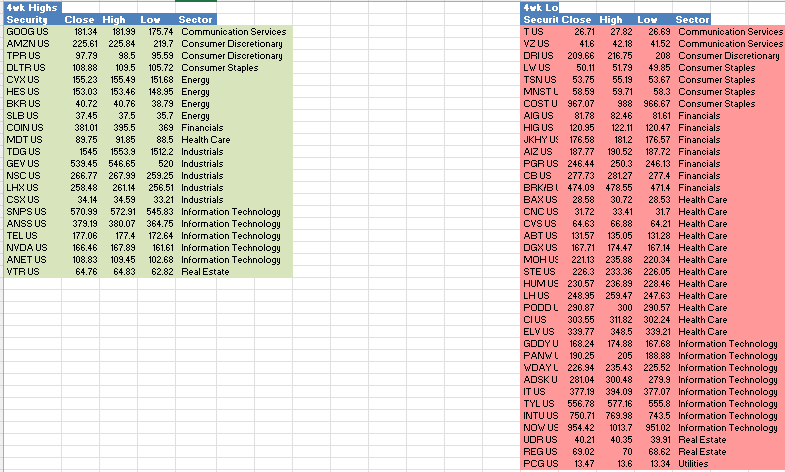
SPX 4wk new highs vs new lows (chart below lags by 1d)
21 new highs / 39 new lows
1st time new lows > new highs since mid June

At TTG, I use Volume At Price in my chart analysis and I use the MarketWebs Indicator to provide Value Areas & VPOCs which indicate significant support & resistance levels. Learn More Here about Volume At Price and the MarketWebs.
Charts (Trade Ideas in Next Section)
SPY Daily chart (note the Daily Chart contains this month’s Value Area)
Price beginning to stall out and note price is at the 4th extension (horizontal lines) above the July Value Area indicating a decent move has been made this month… also note distance between the 5d and 20d MA which is partly why I added some SPY puts as a hedge for my portfolio yesterday

QQQ Daily chart (note the Daily Chart contains this month’s Value Area)
Price remains ABOVE is at its 5d MA & similar to SPY the 5d MA is decently above that 20d MA , to me indicating a short-term extended market

IWM Daily chart (note the Daily Chart contains this month’s Value Area)
Price took out upside VPOC (resistance) $224.7 which could be an area of digestion / rejection. If price can continue watch next VPOC @ $223.88

TTG Trading Edge Program
Click Here to be a Full TTG Member
Charts I am watching / Trade Ideas + Position Update
Keep reading with a 7-day free trial
Subscribe to The Tribeca Trade Group to keep reading this post and get 7 days of free access to the full post archives.