


The TTG Market Pulse 7-1-25
Get up to speed on all the most important Market Trends & Themes + Trade Ideas, Watchlist & Open Positions
Breadth
-69% Up Volume = strong Breadth, but rotation amongst exchanges / groups
- TICKs > currently high of day


Movers (Mkt Cap > $5B)


Mag 7 names - AAPL outperforming / profit taking in most of group

NFLX Daily chart (note the Daily Chart contains this month’s Value Area)
I would look for support and look at a long at $1257 top of July Value Area

% Change From Open & Themes (see yellow box)

SPX 4wk new highs vs new lows (chart below lags by 1d)
207 new highs / 7 new lows Huge Expansion in New highs


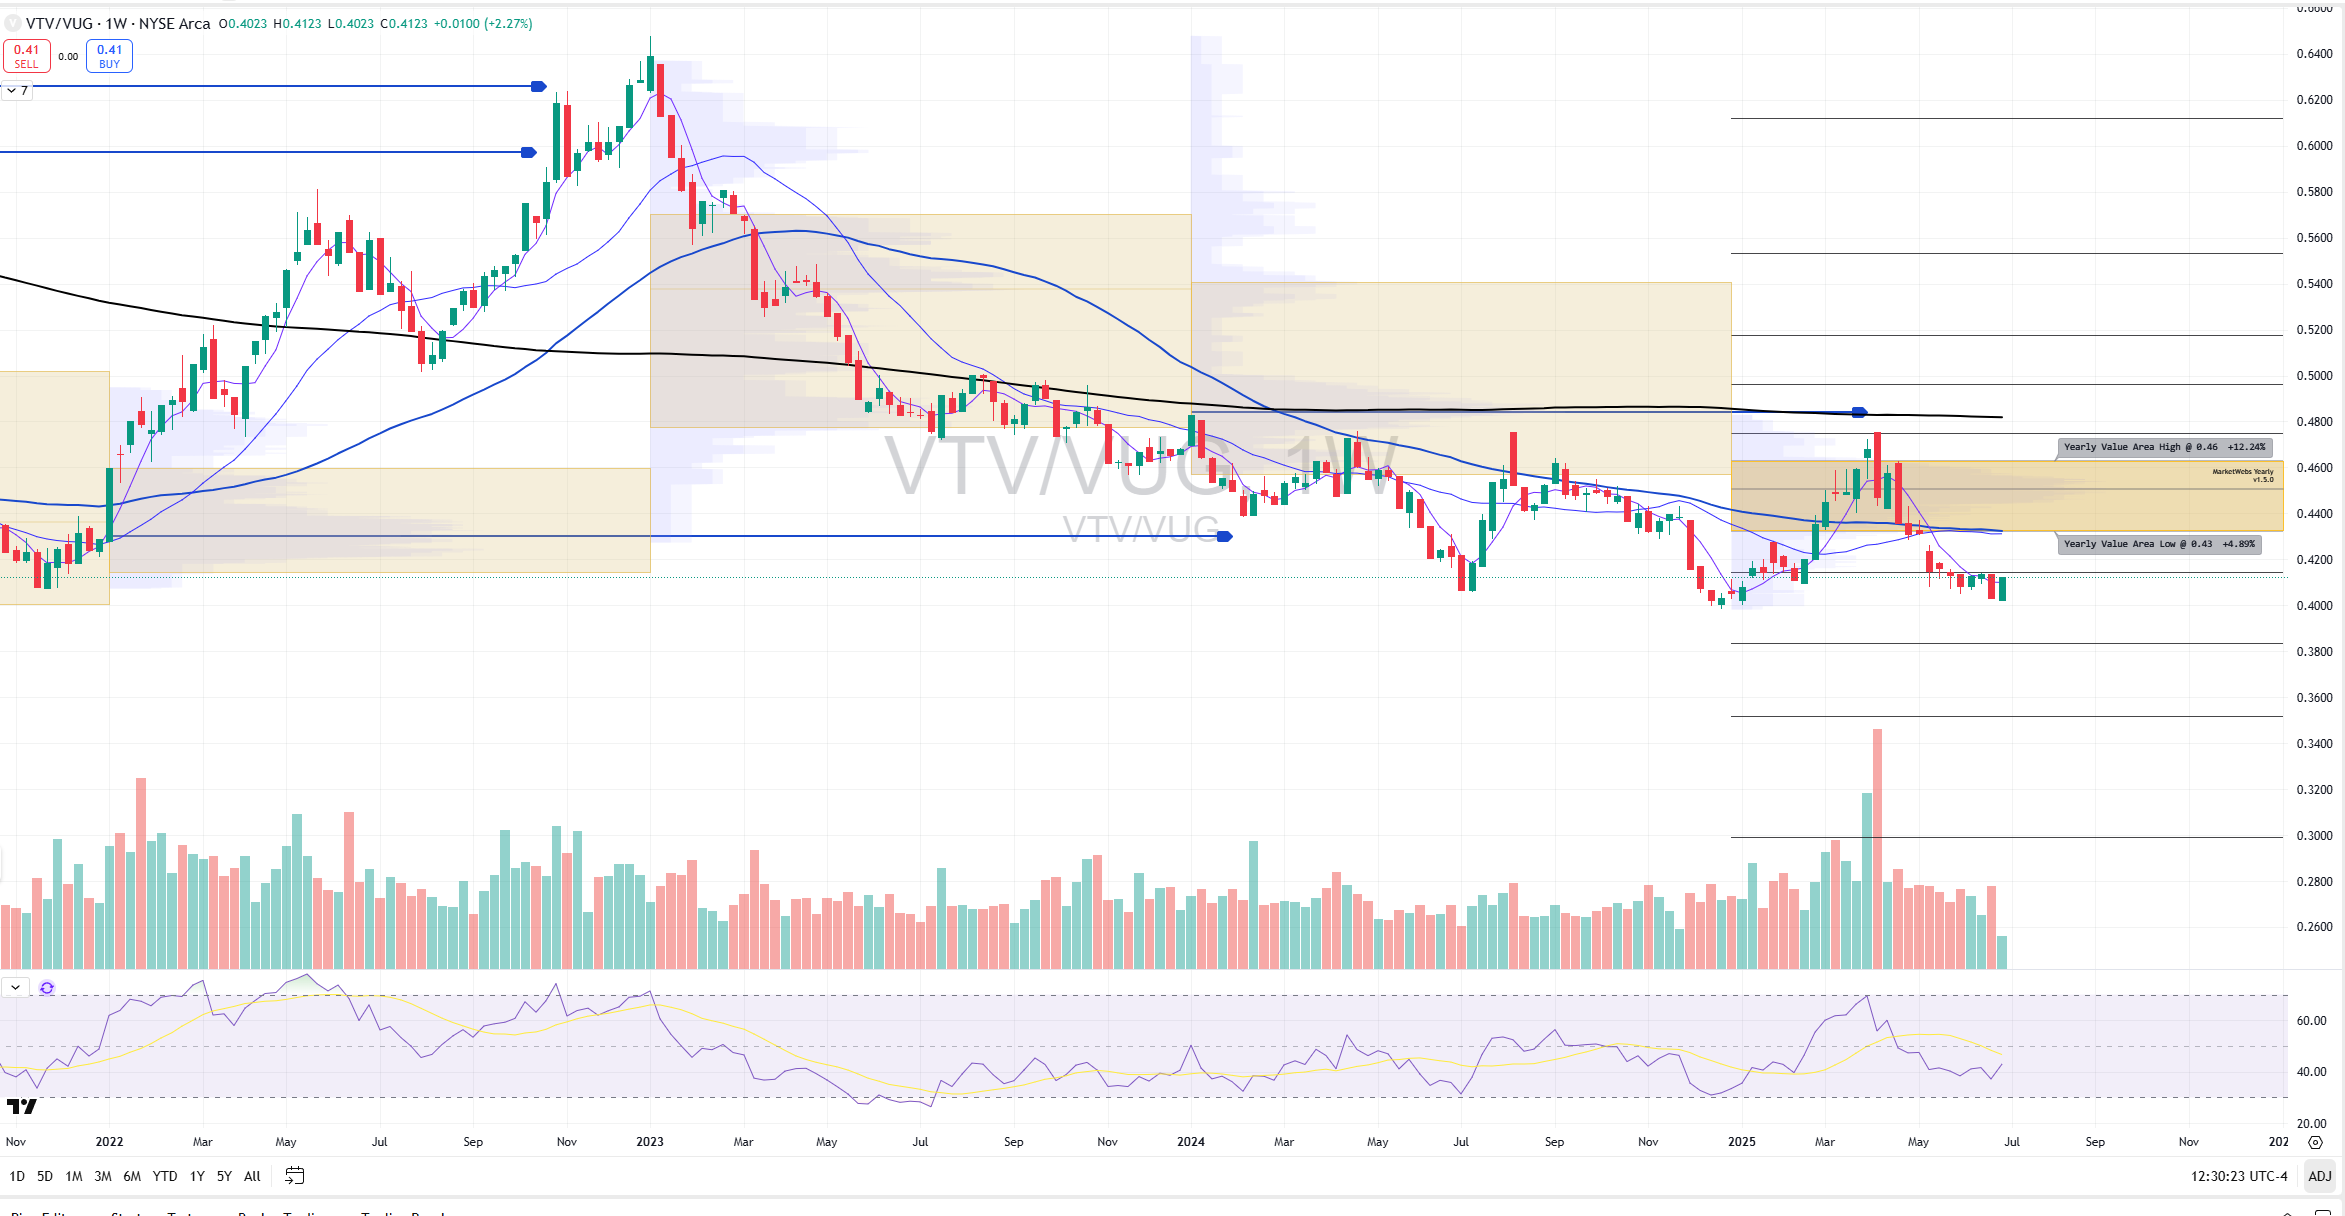
At TTG, I use Volume At Price in my chart analysis and I use the MarketWebs Indicator to provide Value Areas & VPOCs which indicate significant support & resistance levels. Learn More Here about Volume At Price and the MarketWebs.
Charts (Trade Ideas in Next Section)
VTV/VUG Value vs Growth Weekly Chart
clear 1st of the month Rotation here as VTV is +1.1% and VUG -1.1% and looking at a Weekly Chart indicates a possible double bottom on chart
SPY Daily chart (note the Daily Chart contains this month’s Value Area)
Price trending ABOVE its new July Value Area and 5d MA , support is $602.17
QQQ Daily chart (note the Daily Chart contains this month’s Value Area)
QQQs underperforming and seeing some 1st of the month rotation out of , watch to see if price can maintain above its 5d MA
Support is $534.38 new July top of Value Area

IWM Daily chart (note the Daily Chart contains this month’s Value Area)
Big change here as the Small Caps are seeing a rotation into today. Watch to see if price can close above its yearly Value Area , $217.36

TTG Trading Edge Program
Click Here to be a Full TTG Member
Charts I am watching / Trade Ideas + Position Update
Keep reading with a 7-day free trial
Subscribe to The Tribeca Trade Group to keep reading this post and get 7 days of free access to the full post archives.