


The TTG Market Pulse 6-20-25
Get up to speed on all the most important Market Trends & Themes + Trade Ideas, Watchlist & Open Positions
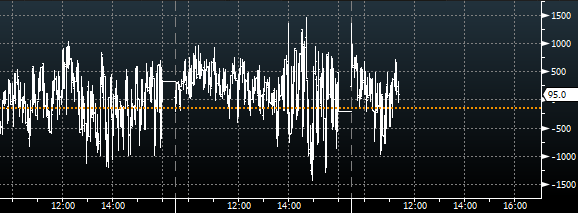
Breadth
-52% Up Volume = Decent breadth today
- TICKs extreme upside on open ~ 1400 and sometimes these extreme prints around open can be susceptible of fades

Movers (Mkt Cap > $5B)

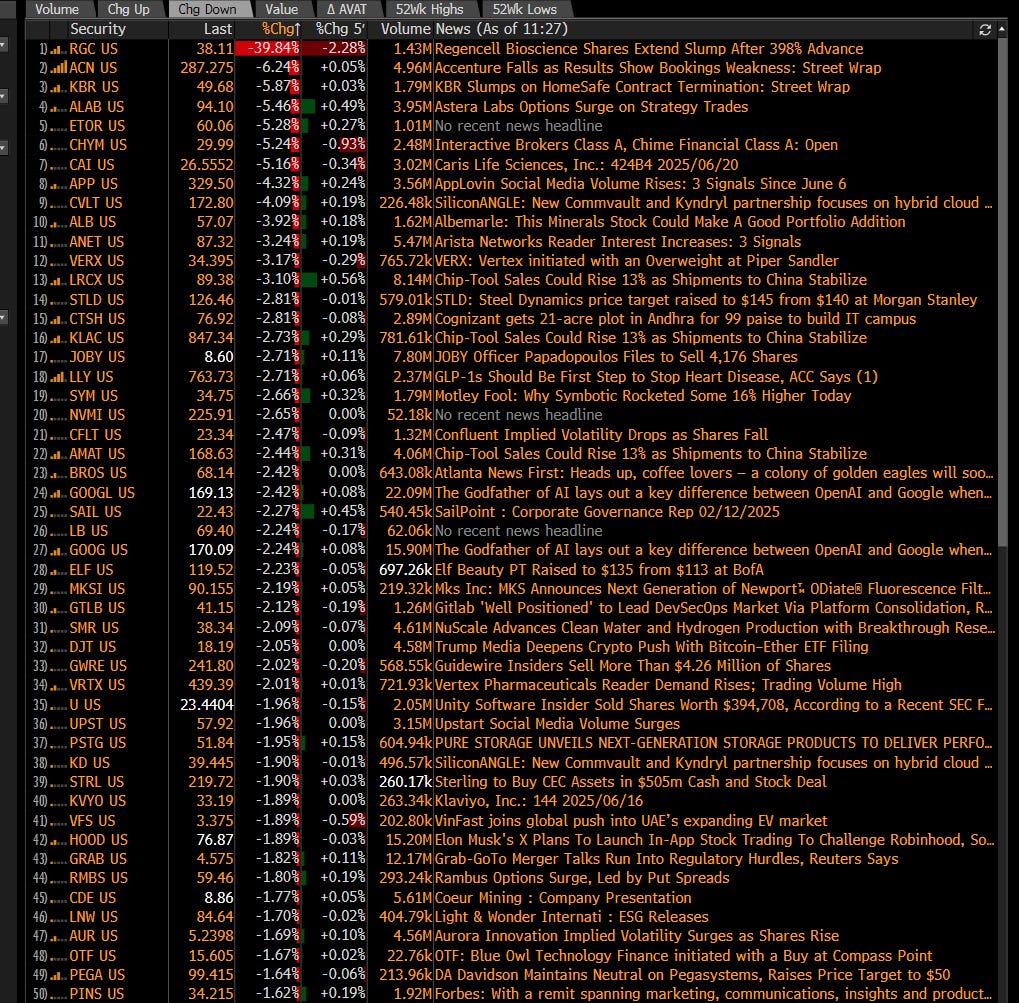
Mag 7 names - NFLX AAPL leading / GOOGL lagging
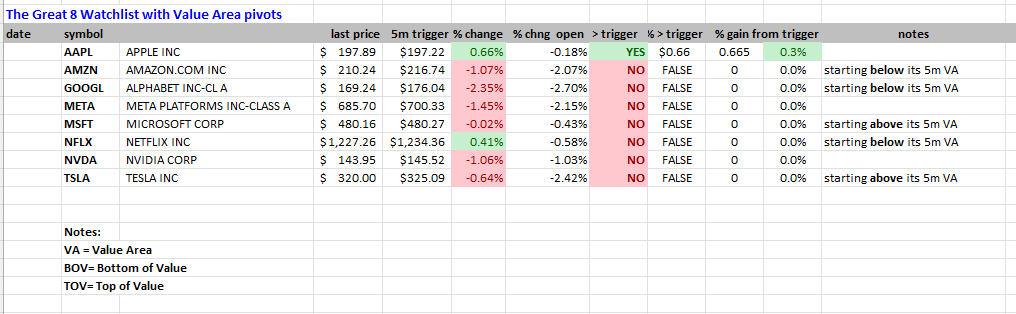
% Change From Open & Themes (see yellow box)

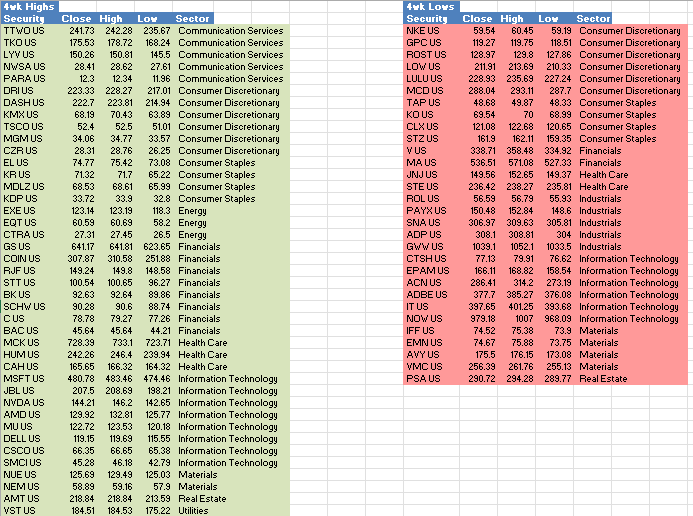
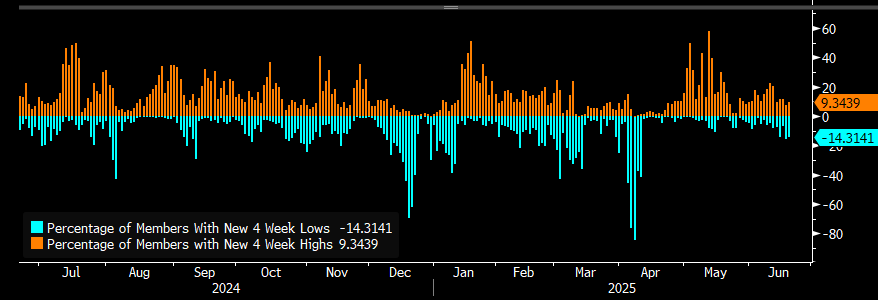
SPX 4wk new highs vs new lows (chart below lags by 1d)
41 new highs / 30 new lows New highs > New lows
not big #’s overall indicating chop overall
At TTG, I use Volume At Price in my chart analysis and I use the MarketWebs Indicator to provide Value Areas & VPOCs which indicate significant support & resistance levels. Learn More Here about Volume At Price and the MarketWebs.
Charts (Trade Ideas in Next Section)
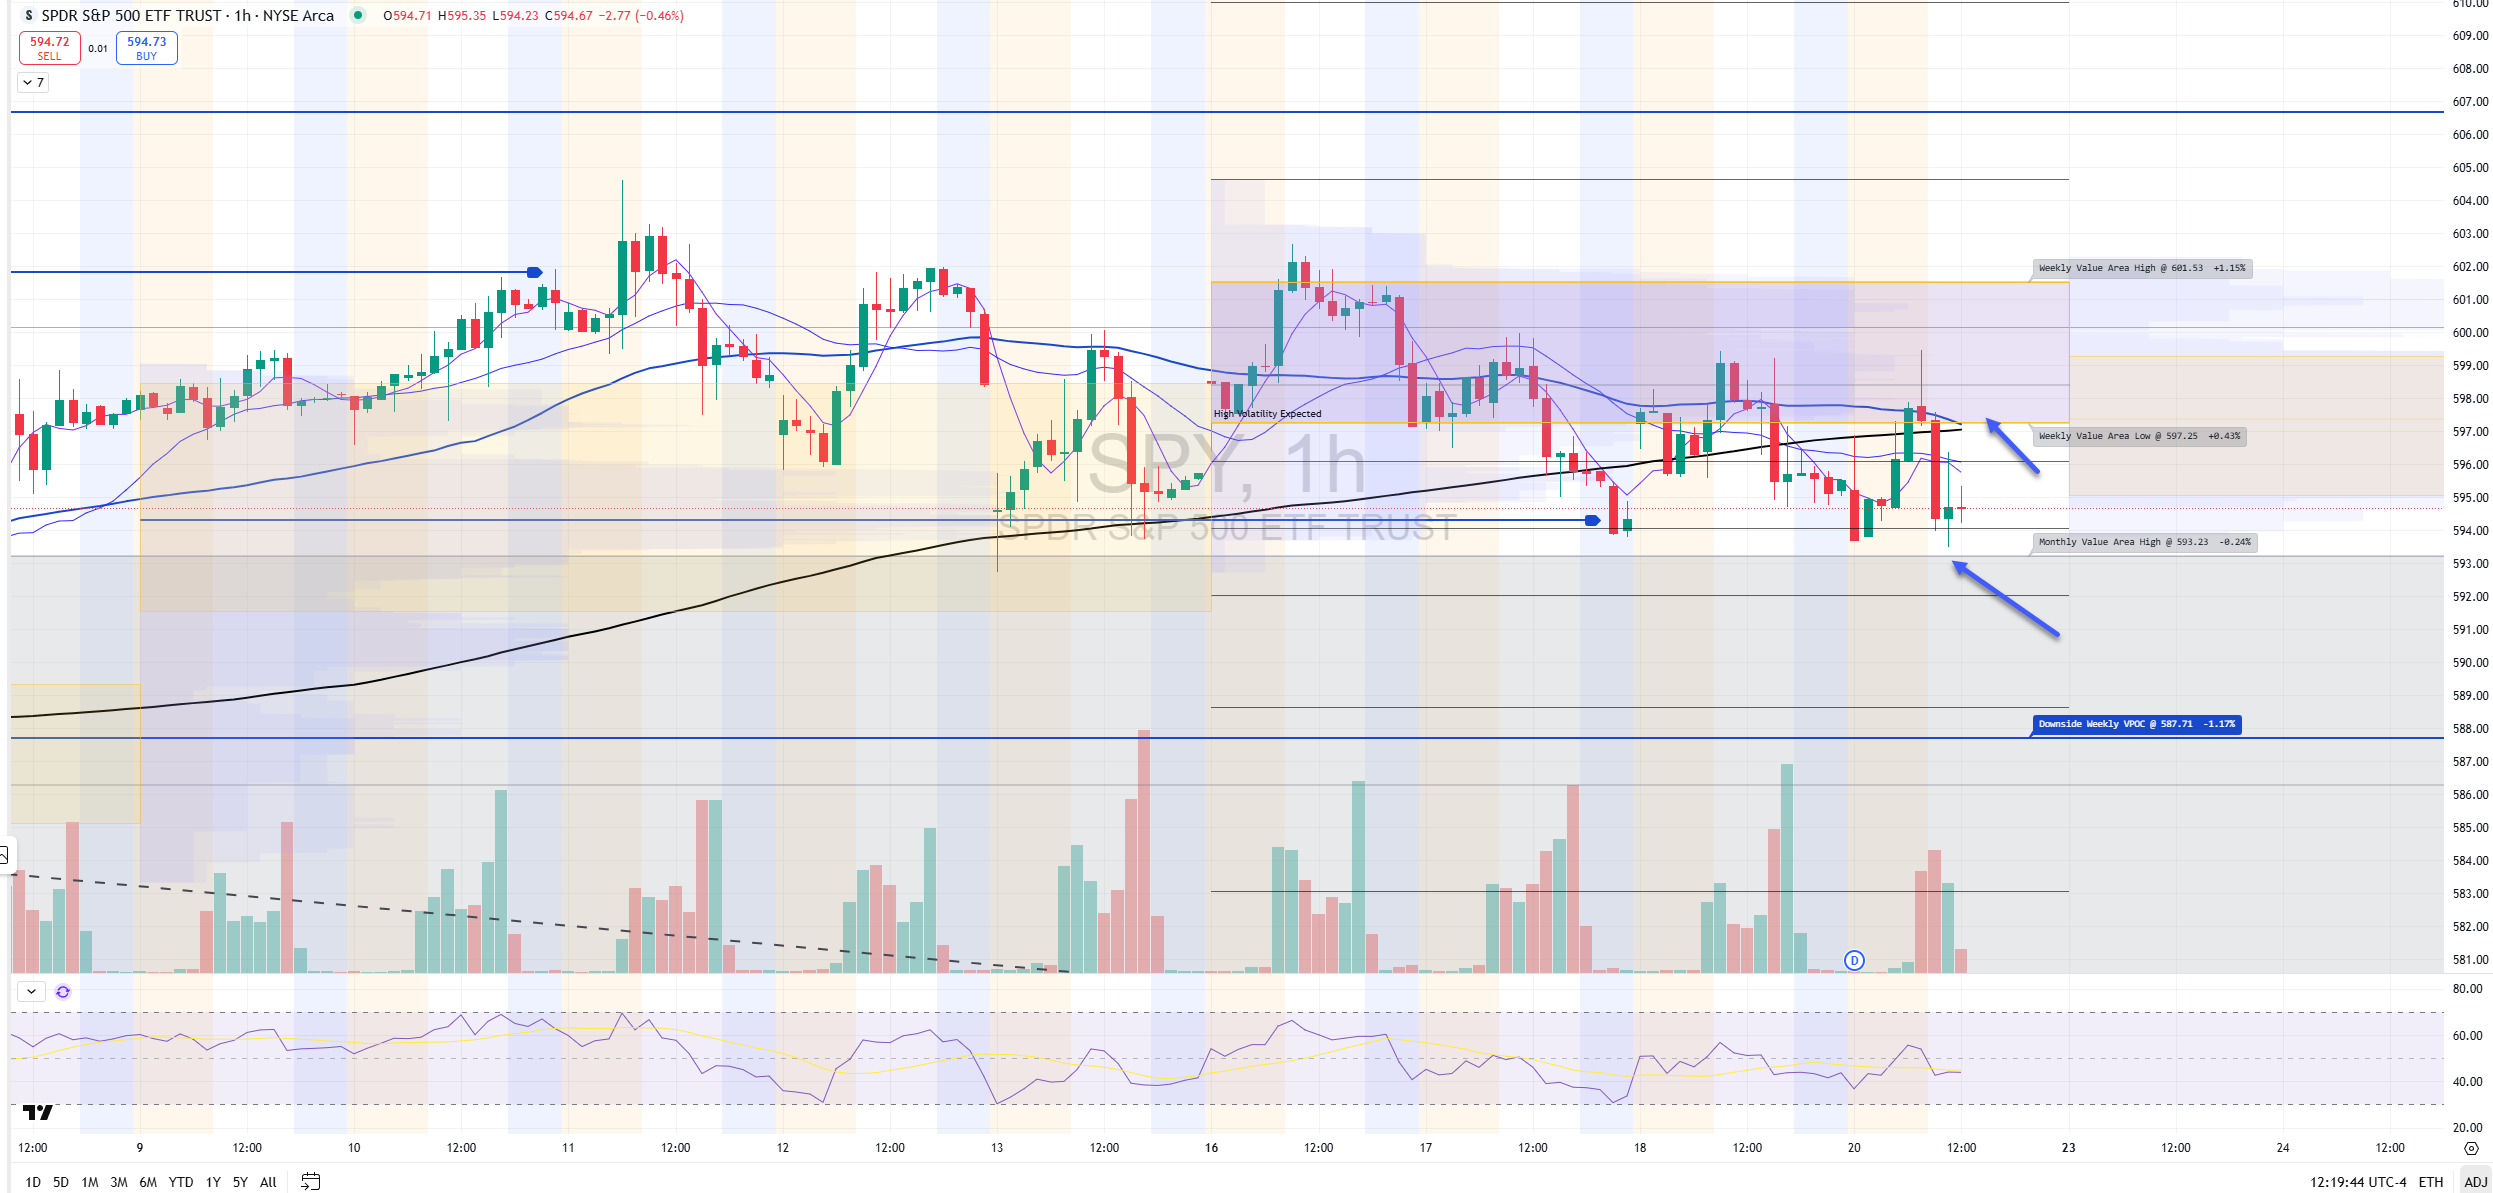
SPY Daily chart (note the Daily Chart contains this month’s Value Area)
Price now starting to come down and test the top of the June Value Area , a big level to watch here is $593.23
2nd chart (1hr chart): Price now BELOW its Value Area for week.
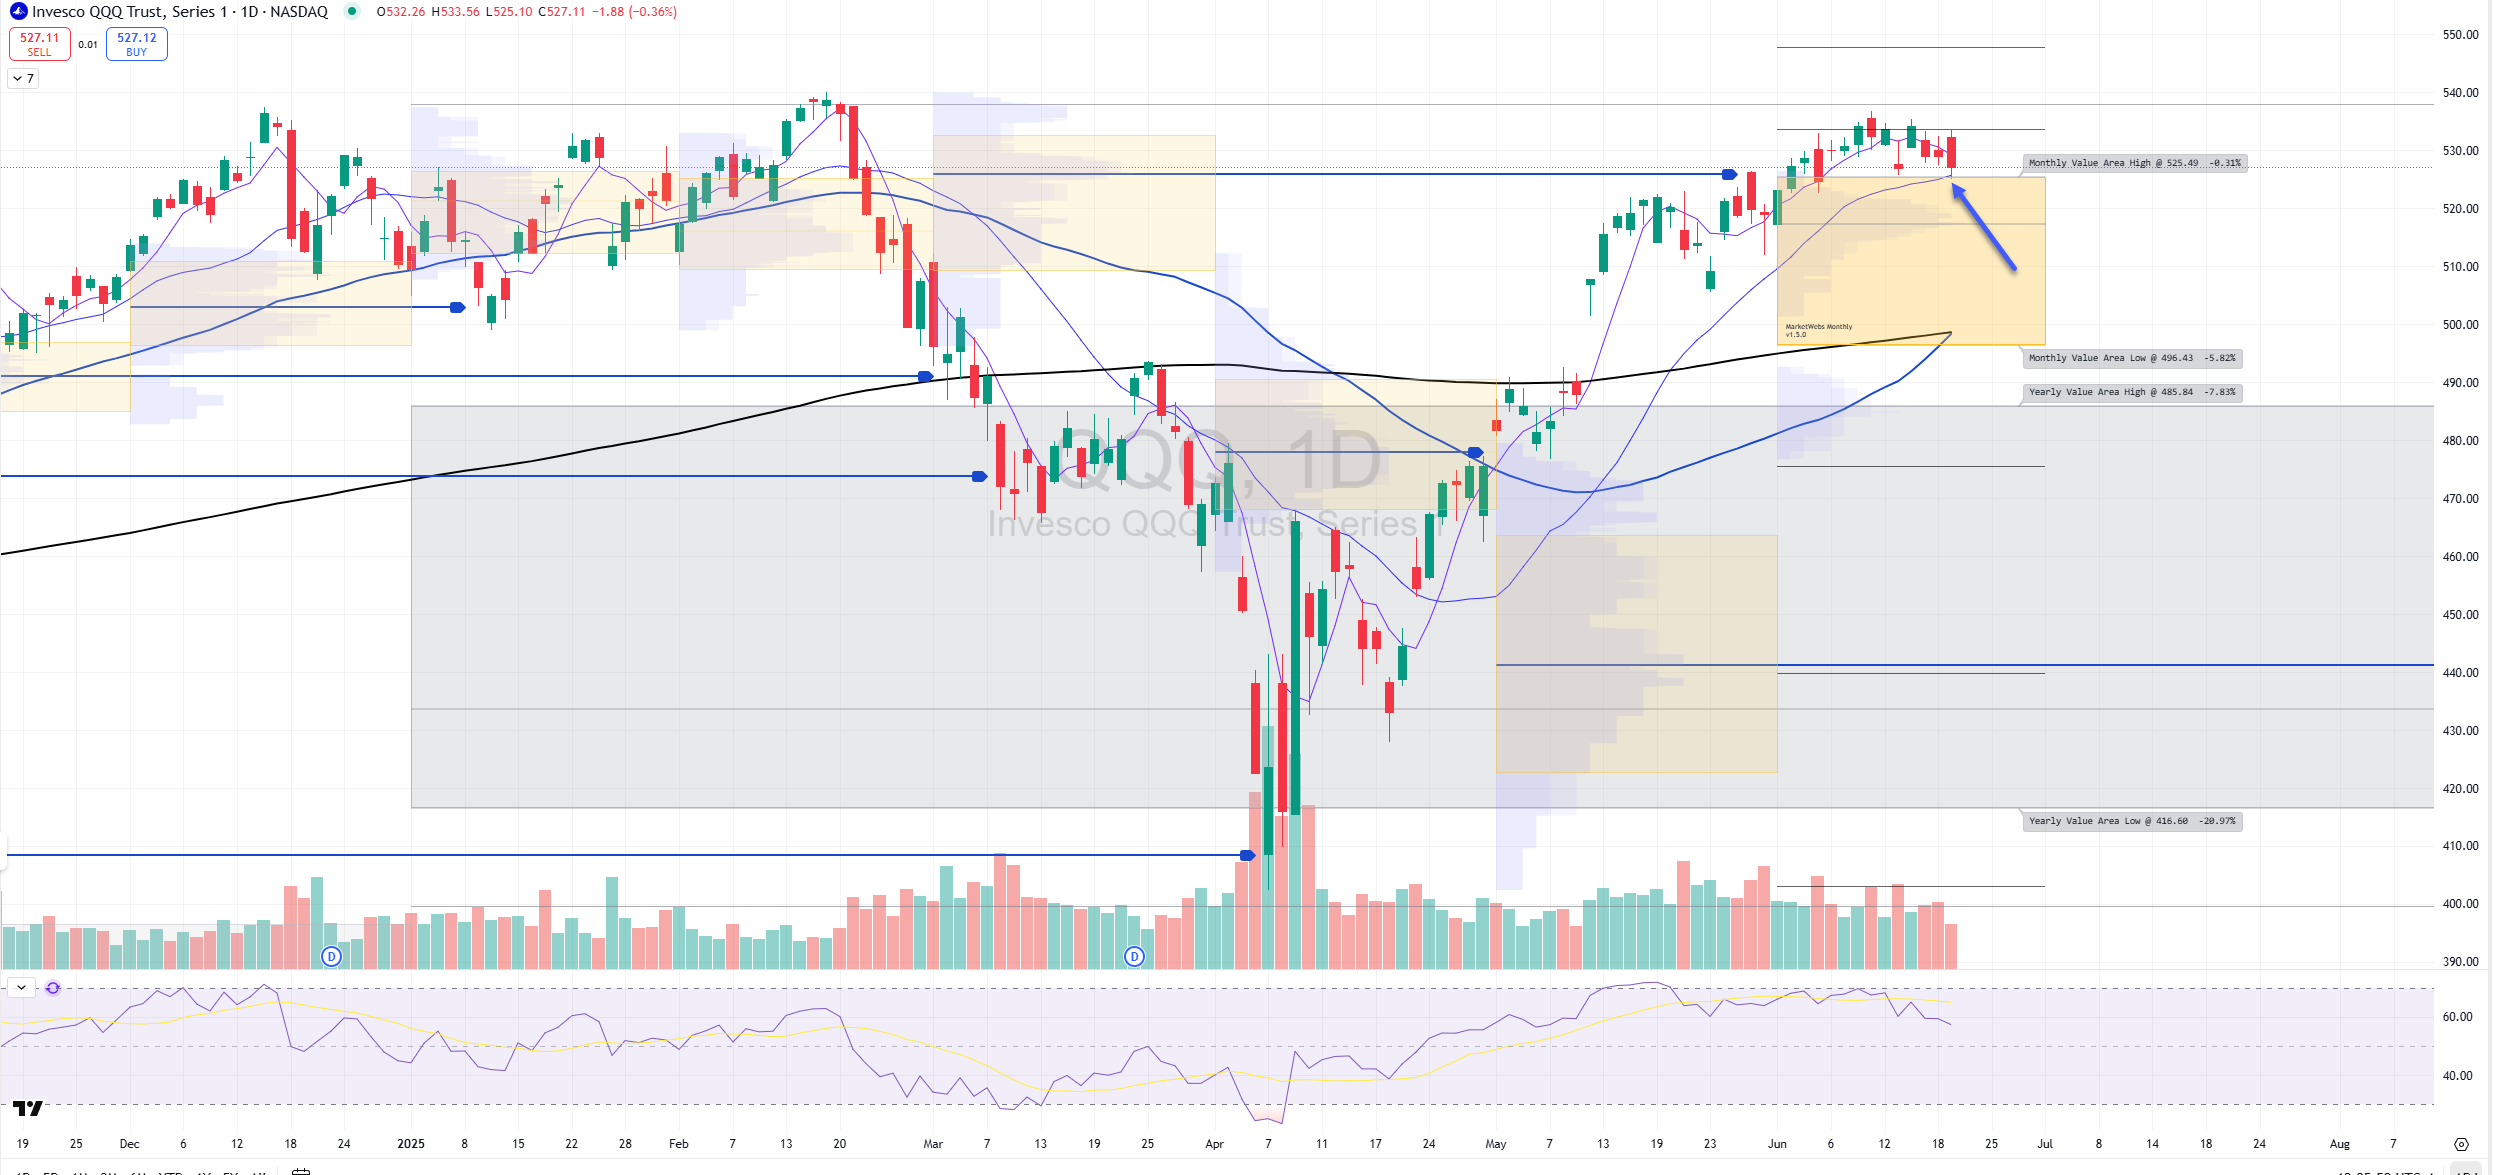
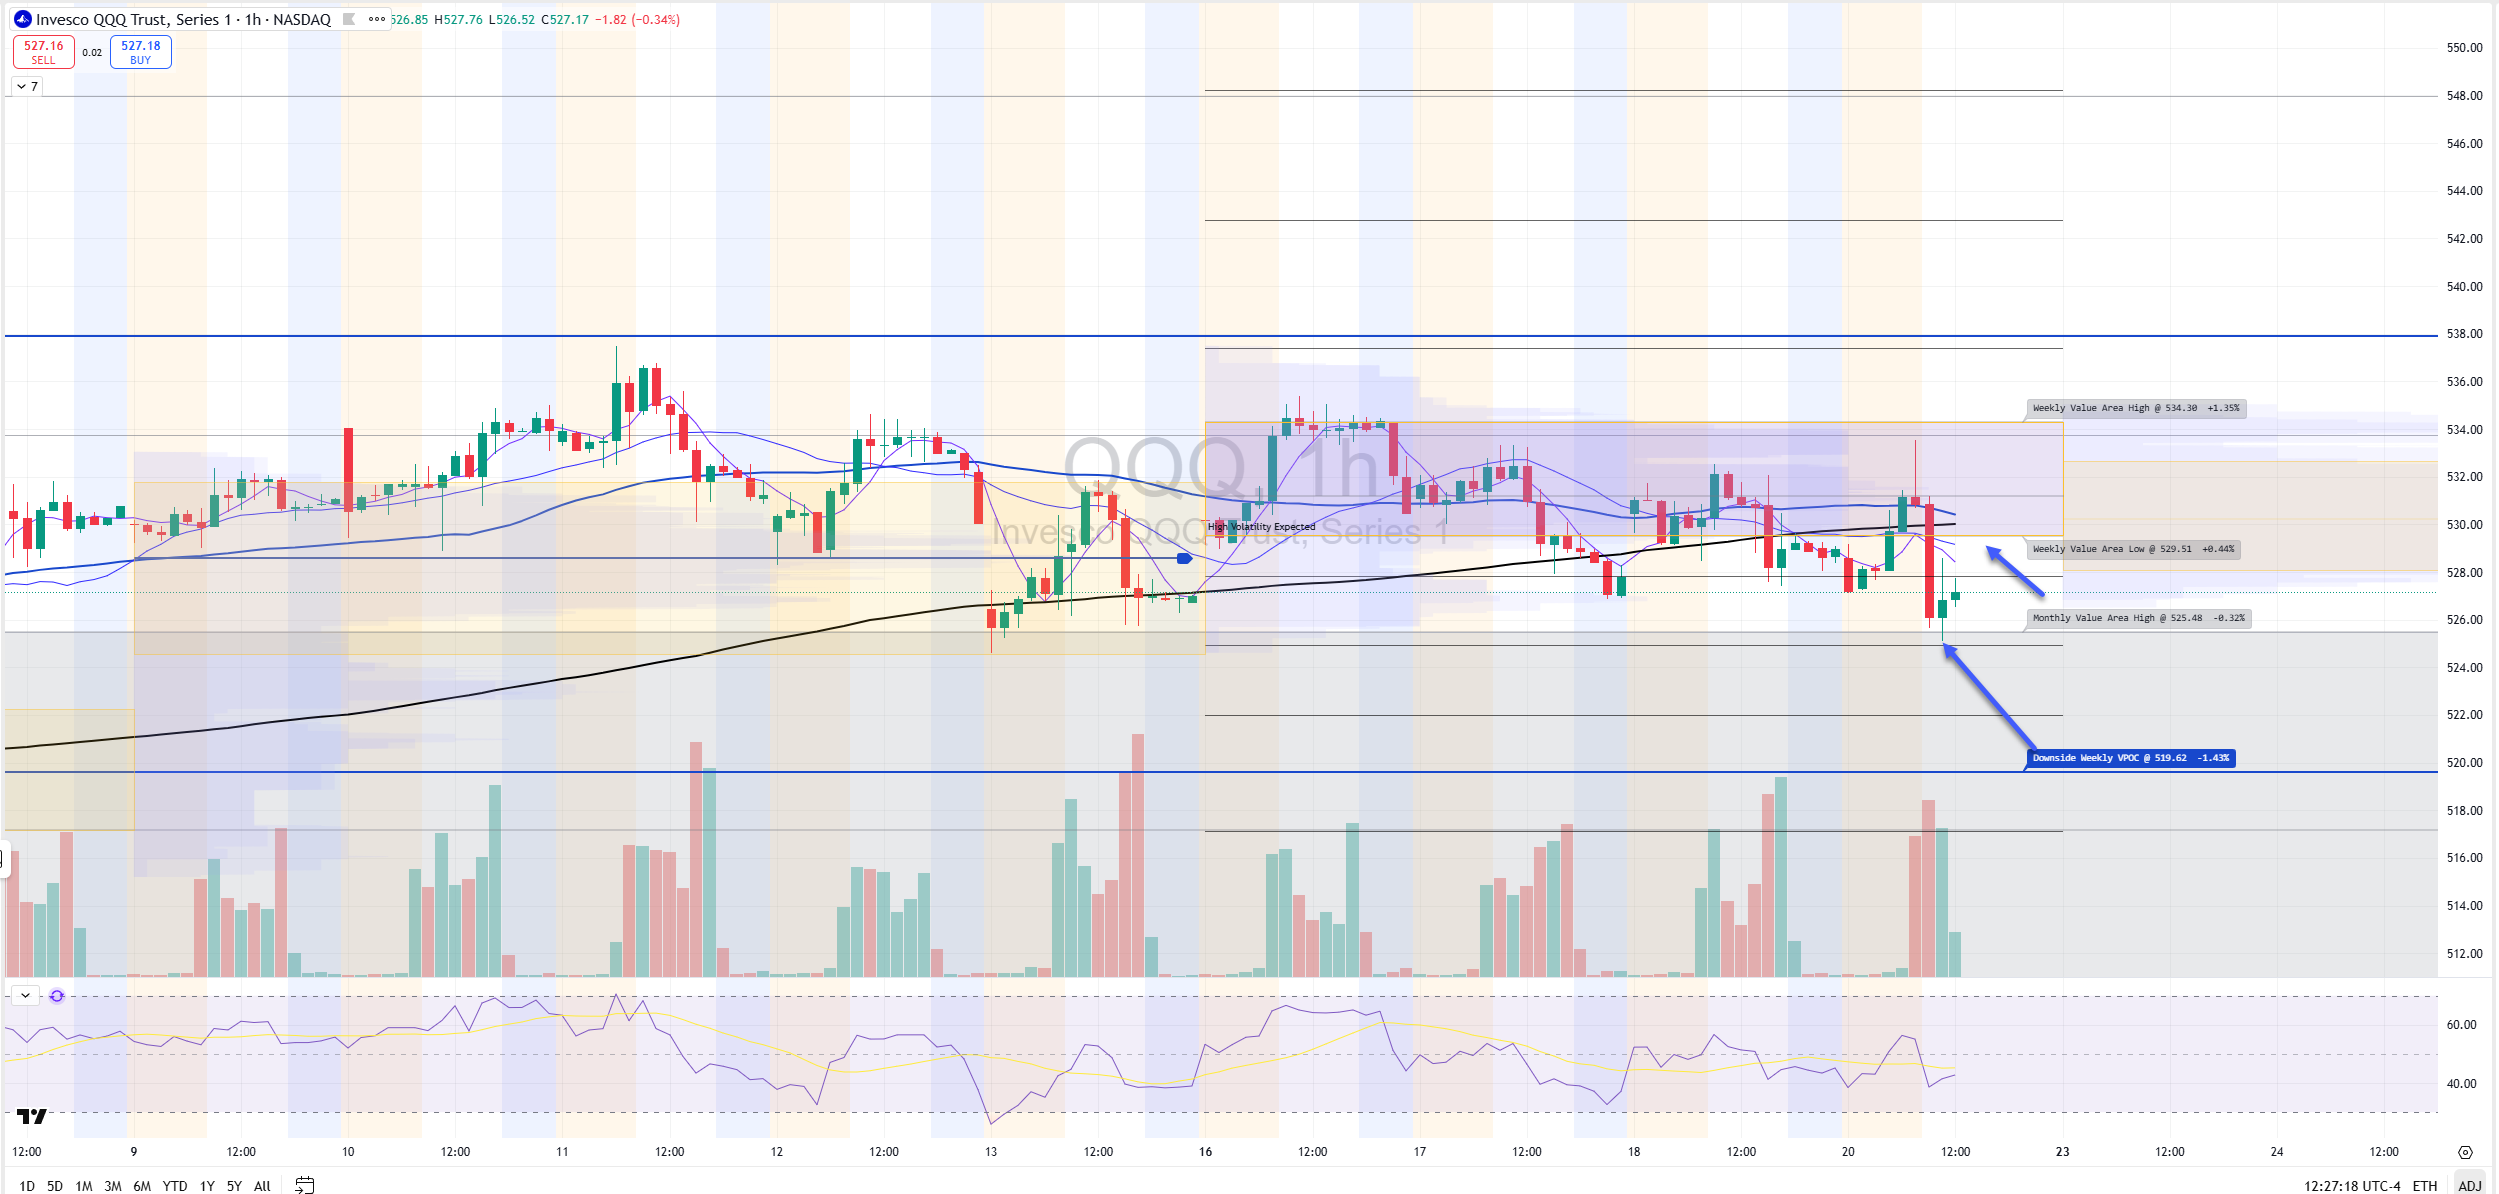
QQQ Daily chart (note the Daily Chart contains this month’s Value Area)
Similar to SPY, reversal today and now coming down to test the top of its June Value Area, must watch level here is $525.49
2nd chart (1hr chart): Price now BELOW its Value Area for week.
IWM Daily chart (note the Daily Chart contains this month’s Value Area)
Small Caps also coming down to top of June Value Area, watch $209.1 and its 20d MA which has acted as support over last week

TTG Trading Edge Program
Click Here to be a Full TTG Member
Charts I am watching / Trade Ideas + Position Update
Keep reading with a 7-day free trial
Subscribe to The Tribeca Trade Group to keep reading this post and get 7 days of free access to the full post archives.