


The TTG Market Pulse 6-17-25
Get up to speed on all the most important Market Trends & Themes + Trade Ideas, Watchlist & Open Positions
Breadth
-38% Up Volume = Poor breadth today
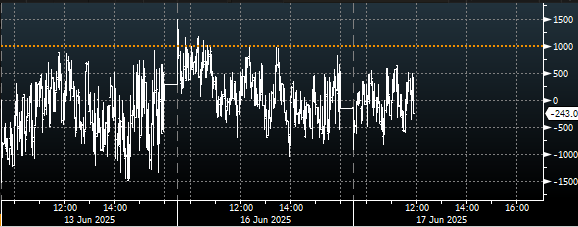
- TICKs mostly < 500 & > -500 indicating a choppy tape

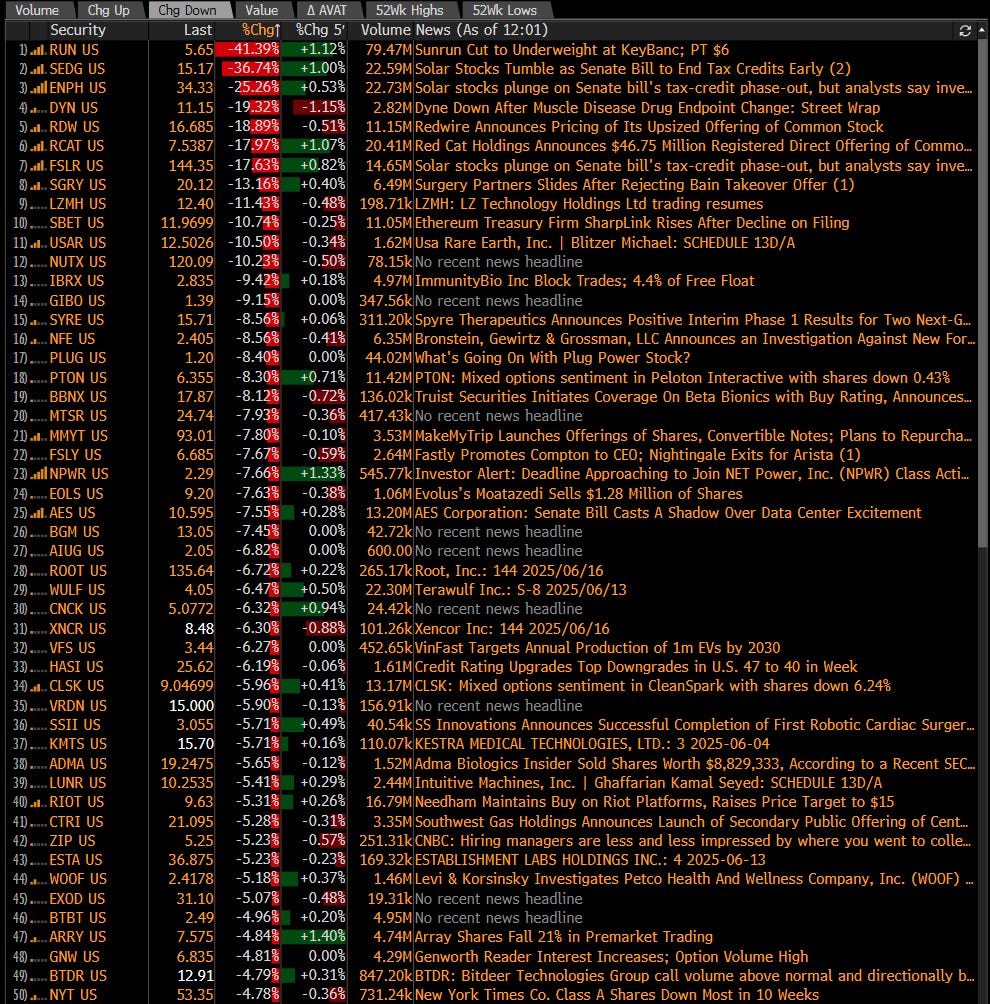
Movers (Mkt Cap > $5B)
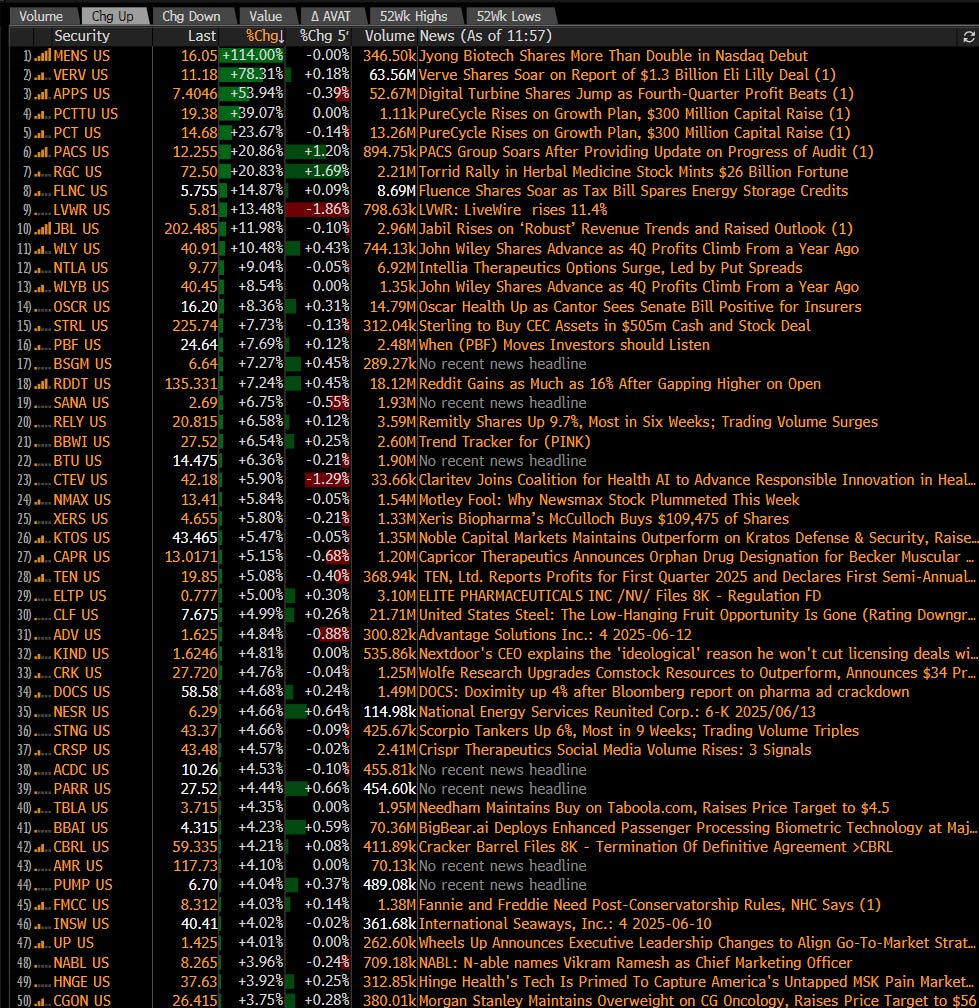
Mag 7 names - GOOGL NFLX leading / TSLA lagging

% Change From Open & Themes (see yellow box)

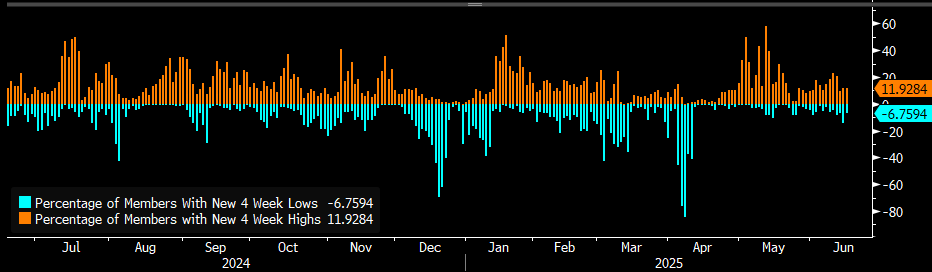
SPX 4wk new highs vs new lows (chart below lags by 1d)
32 new highs / 57 new lows New lows > New highs
Energy new highs increase
Consumer & Utilities two largest new lows sectors

At TTG, I use Volume At Price in my chart analysis and I use the MarketWebs Indicator to provide Value Areas & VPOCs which indicate significant support & resistance levels. Learn More Here about Volume At Price and the MarketWebs.
Charts (Trade Ideas in Next Section)
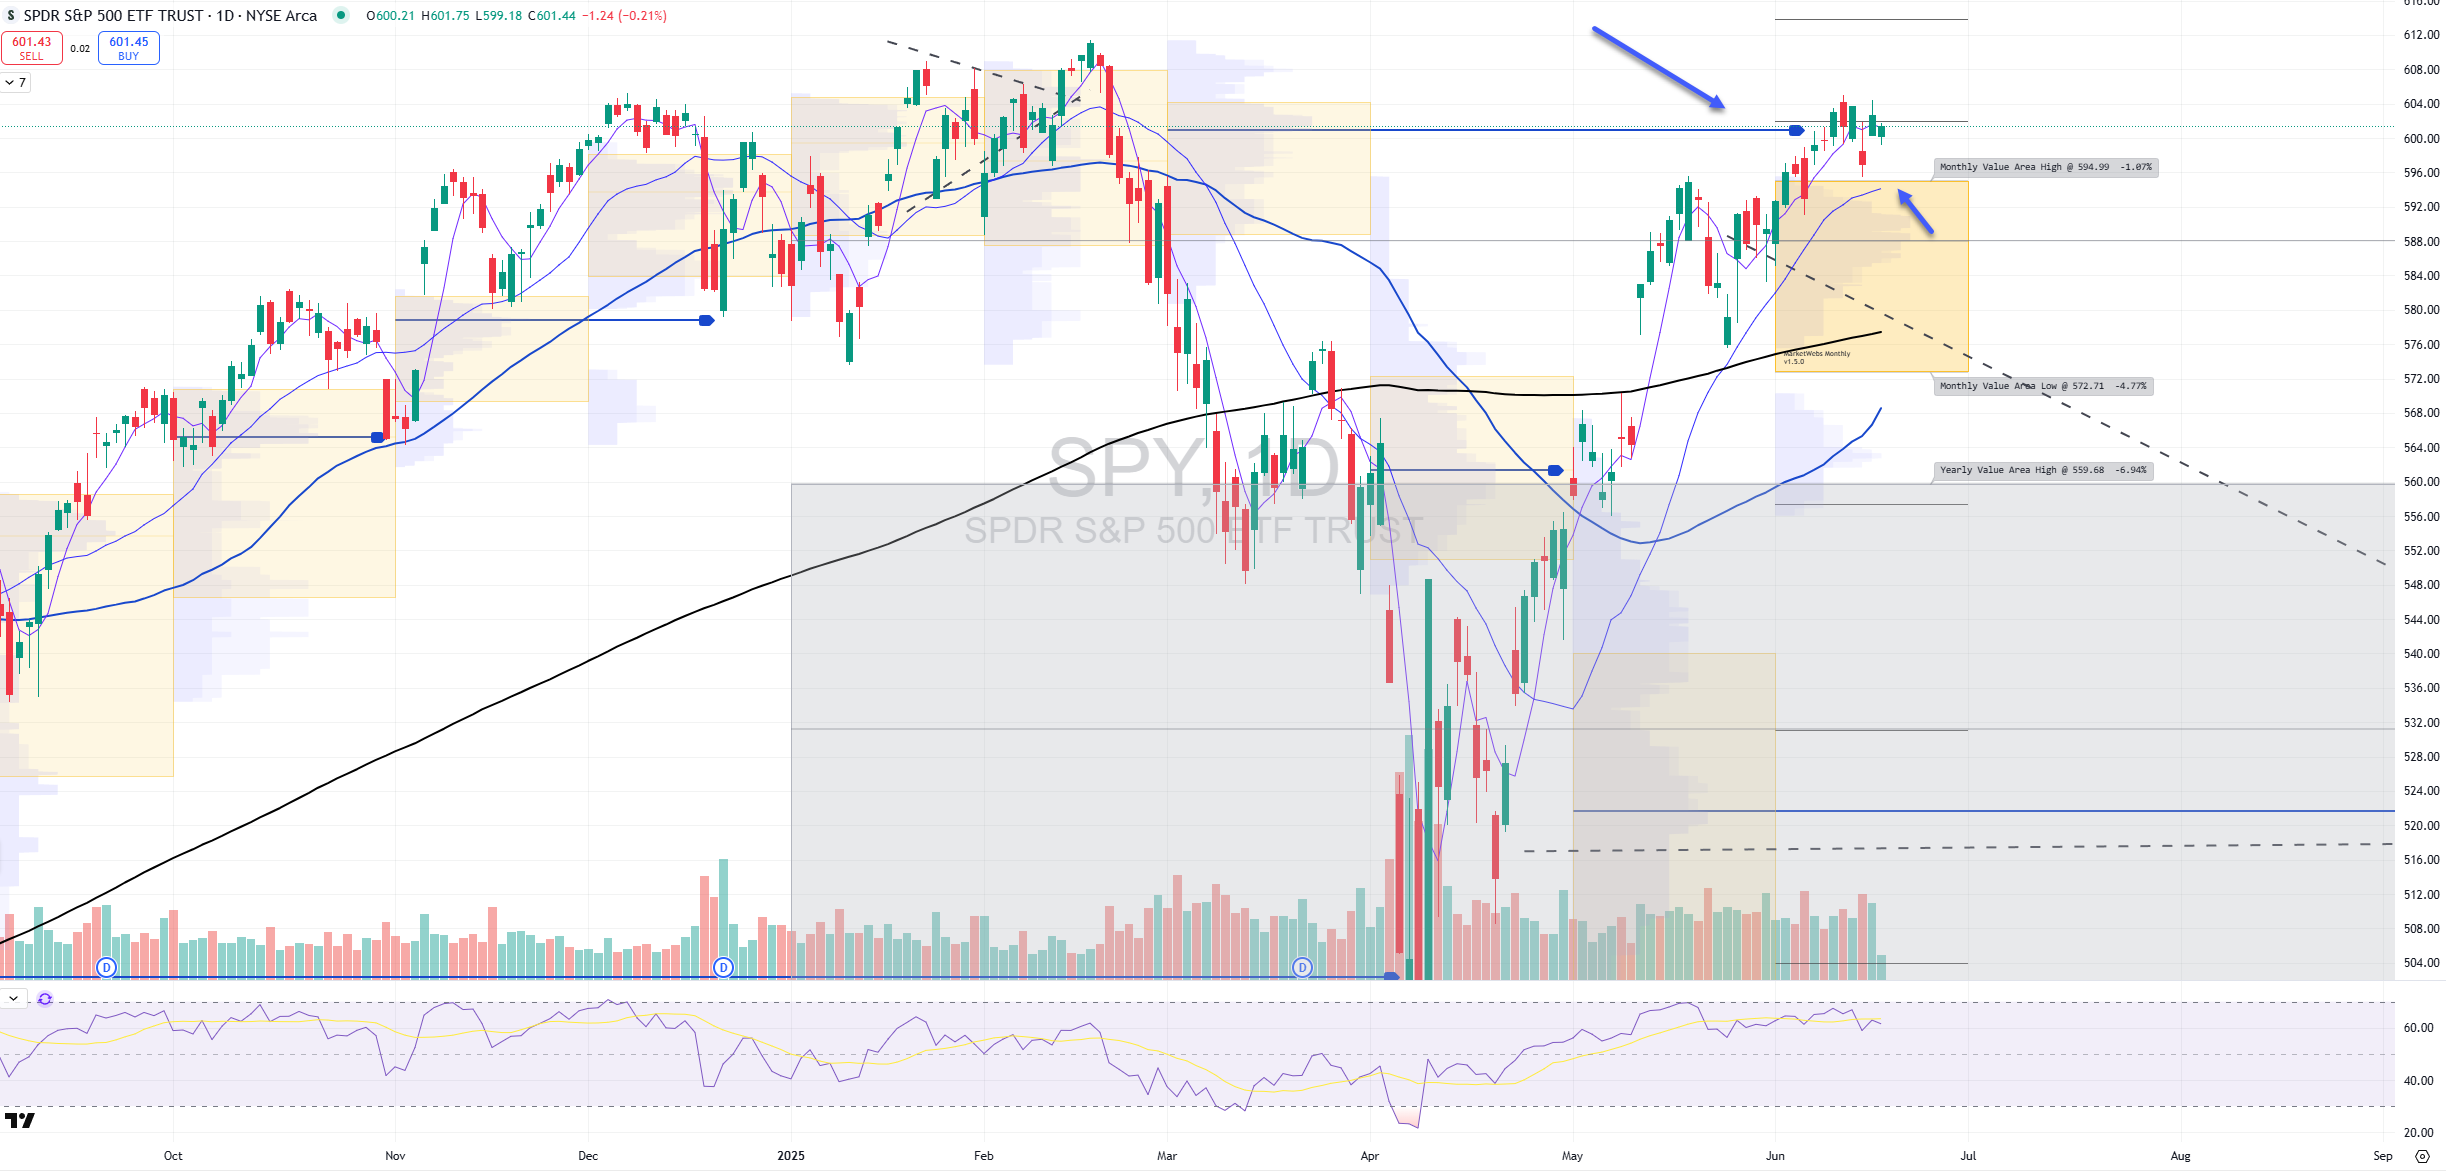
SPY Daily chart (note the Daily Chart contains this month’s Value Area)
Price also continues to hang around that VPOC takeout (blue line) from ~ a week ago , this can happen where there was previously high volume as VPOCs indicate. For now, price is below last week’s highs & above the June Value Area, support remains $595
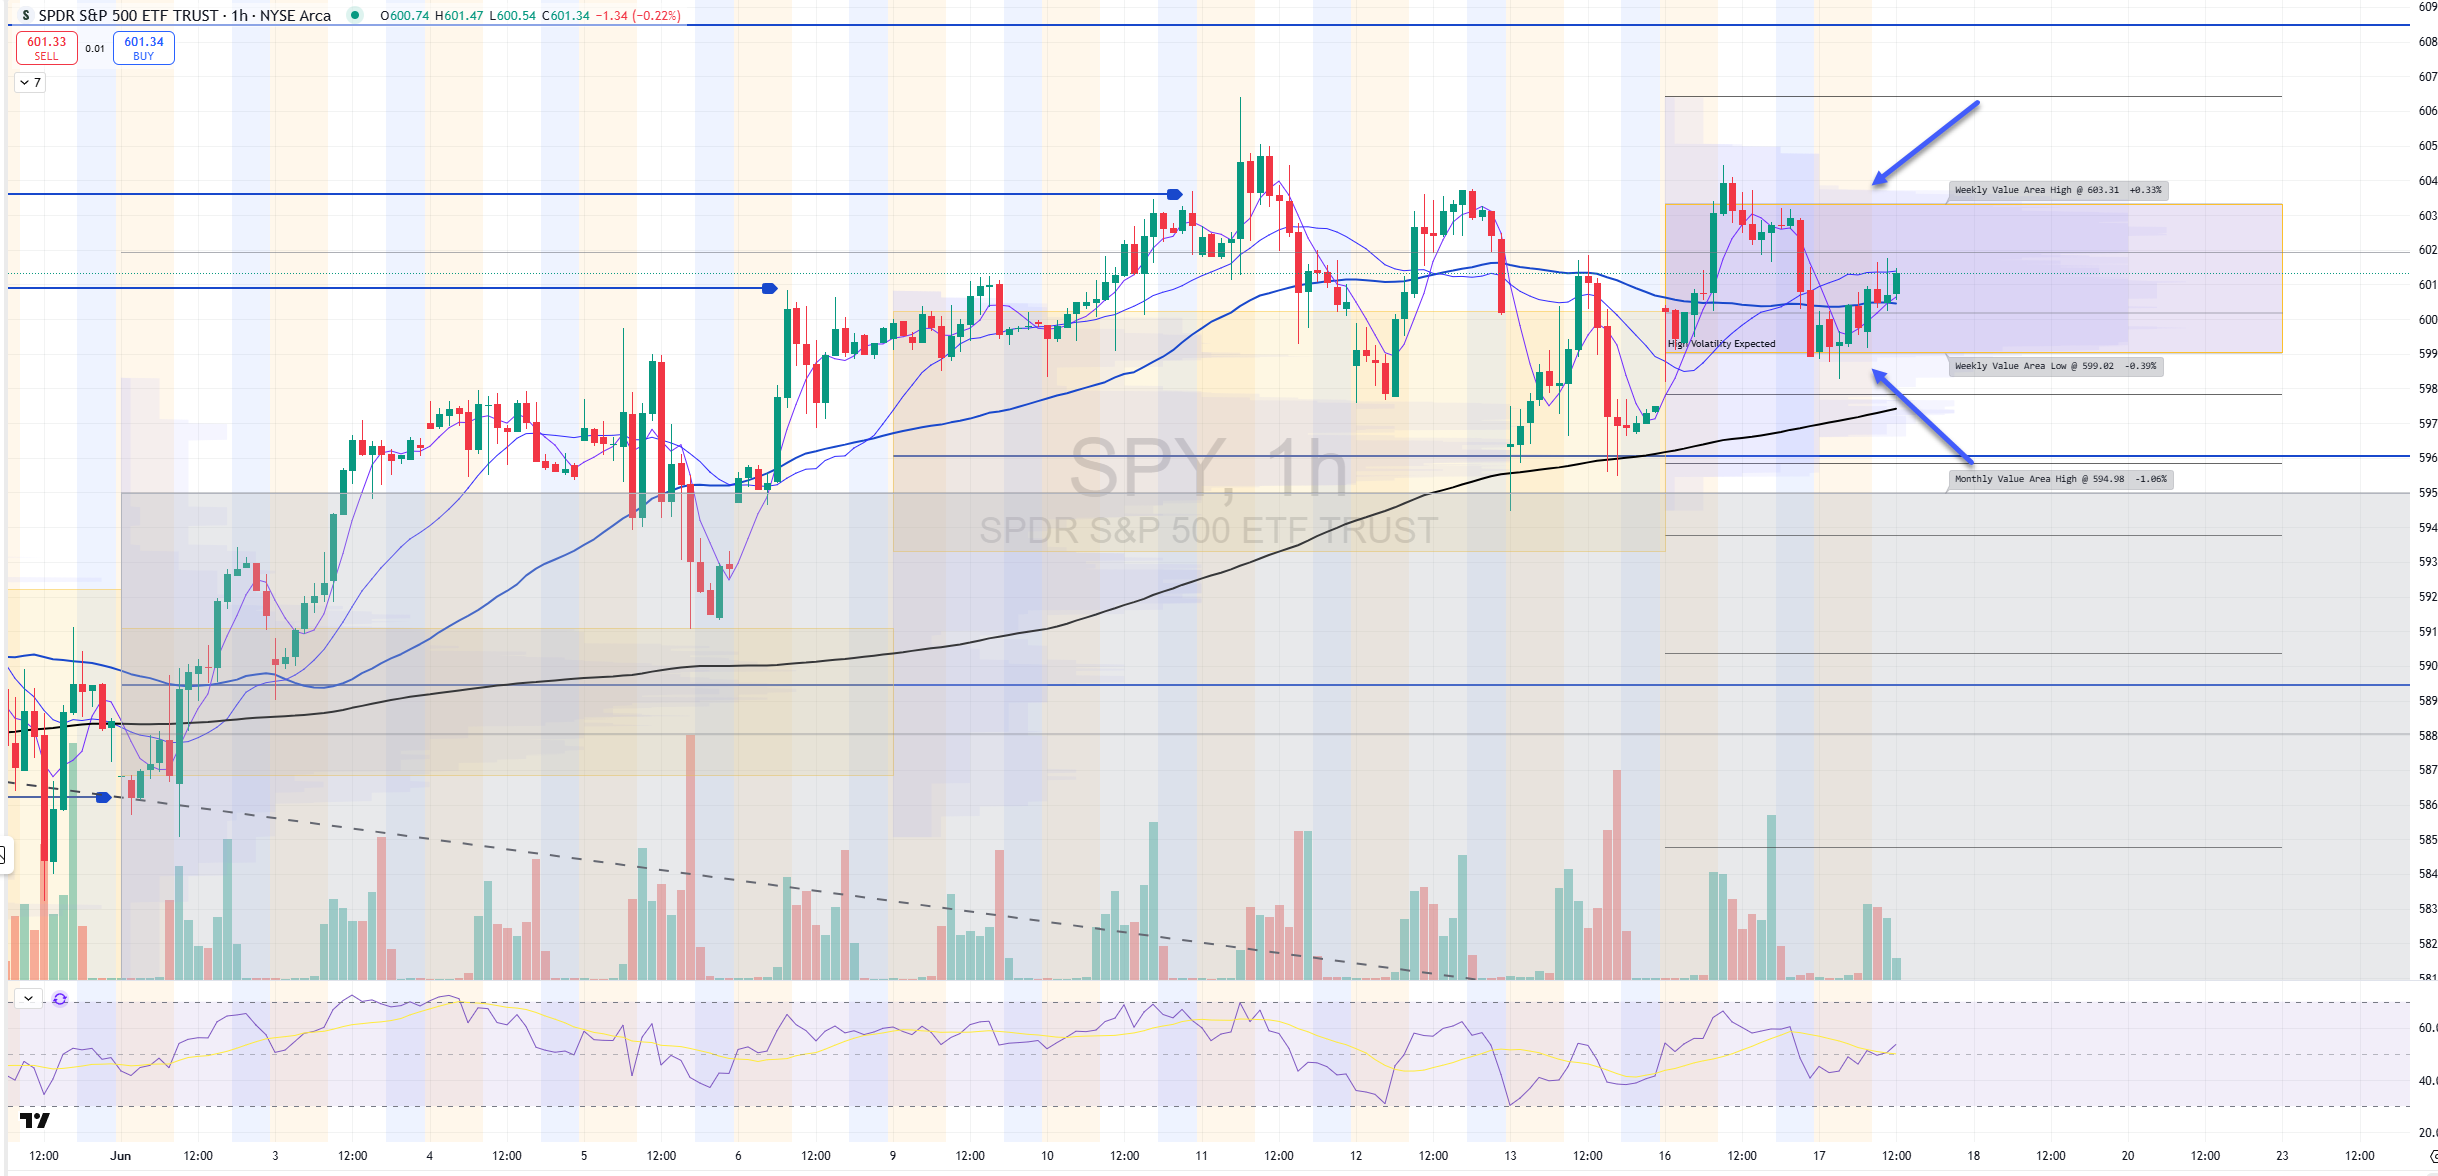
2nd chart (1hr chart): Price locked INSIDE its Value Area for week. watch $603.31 resistance & $599.02 support
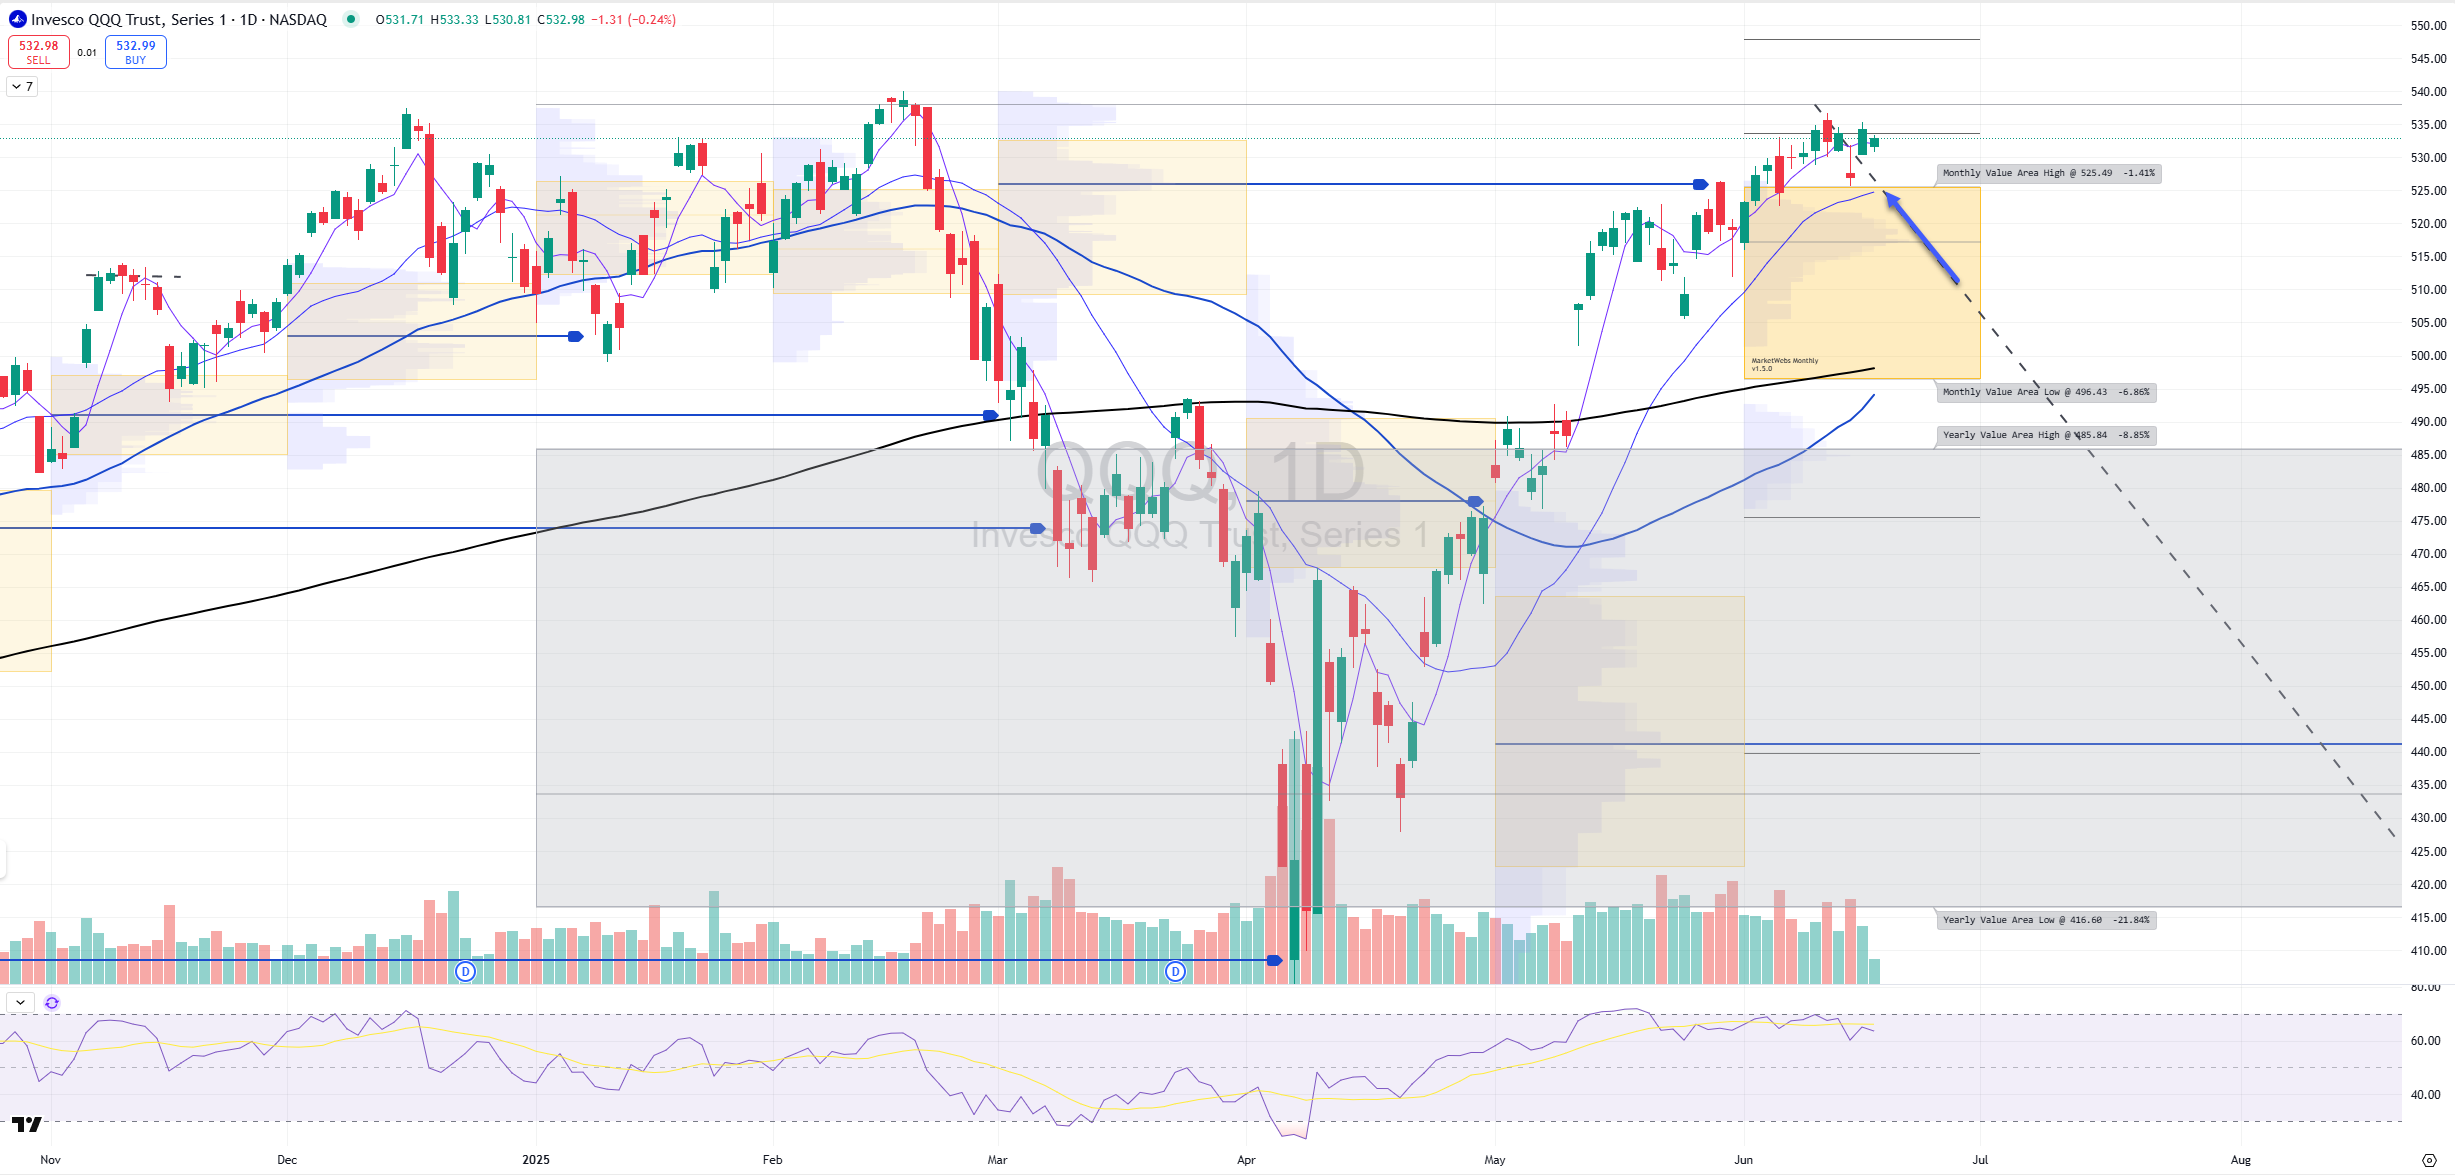
QQQ Daily chart (note the Daily Chart contains this month’s Value Area)
Price also in a range but remains ABOVE its June Value Area, support remains $525.49
2nd chart (1hr chart): Price INSIDE this week’s Value Area, resistance $534.4 / support $529.51

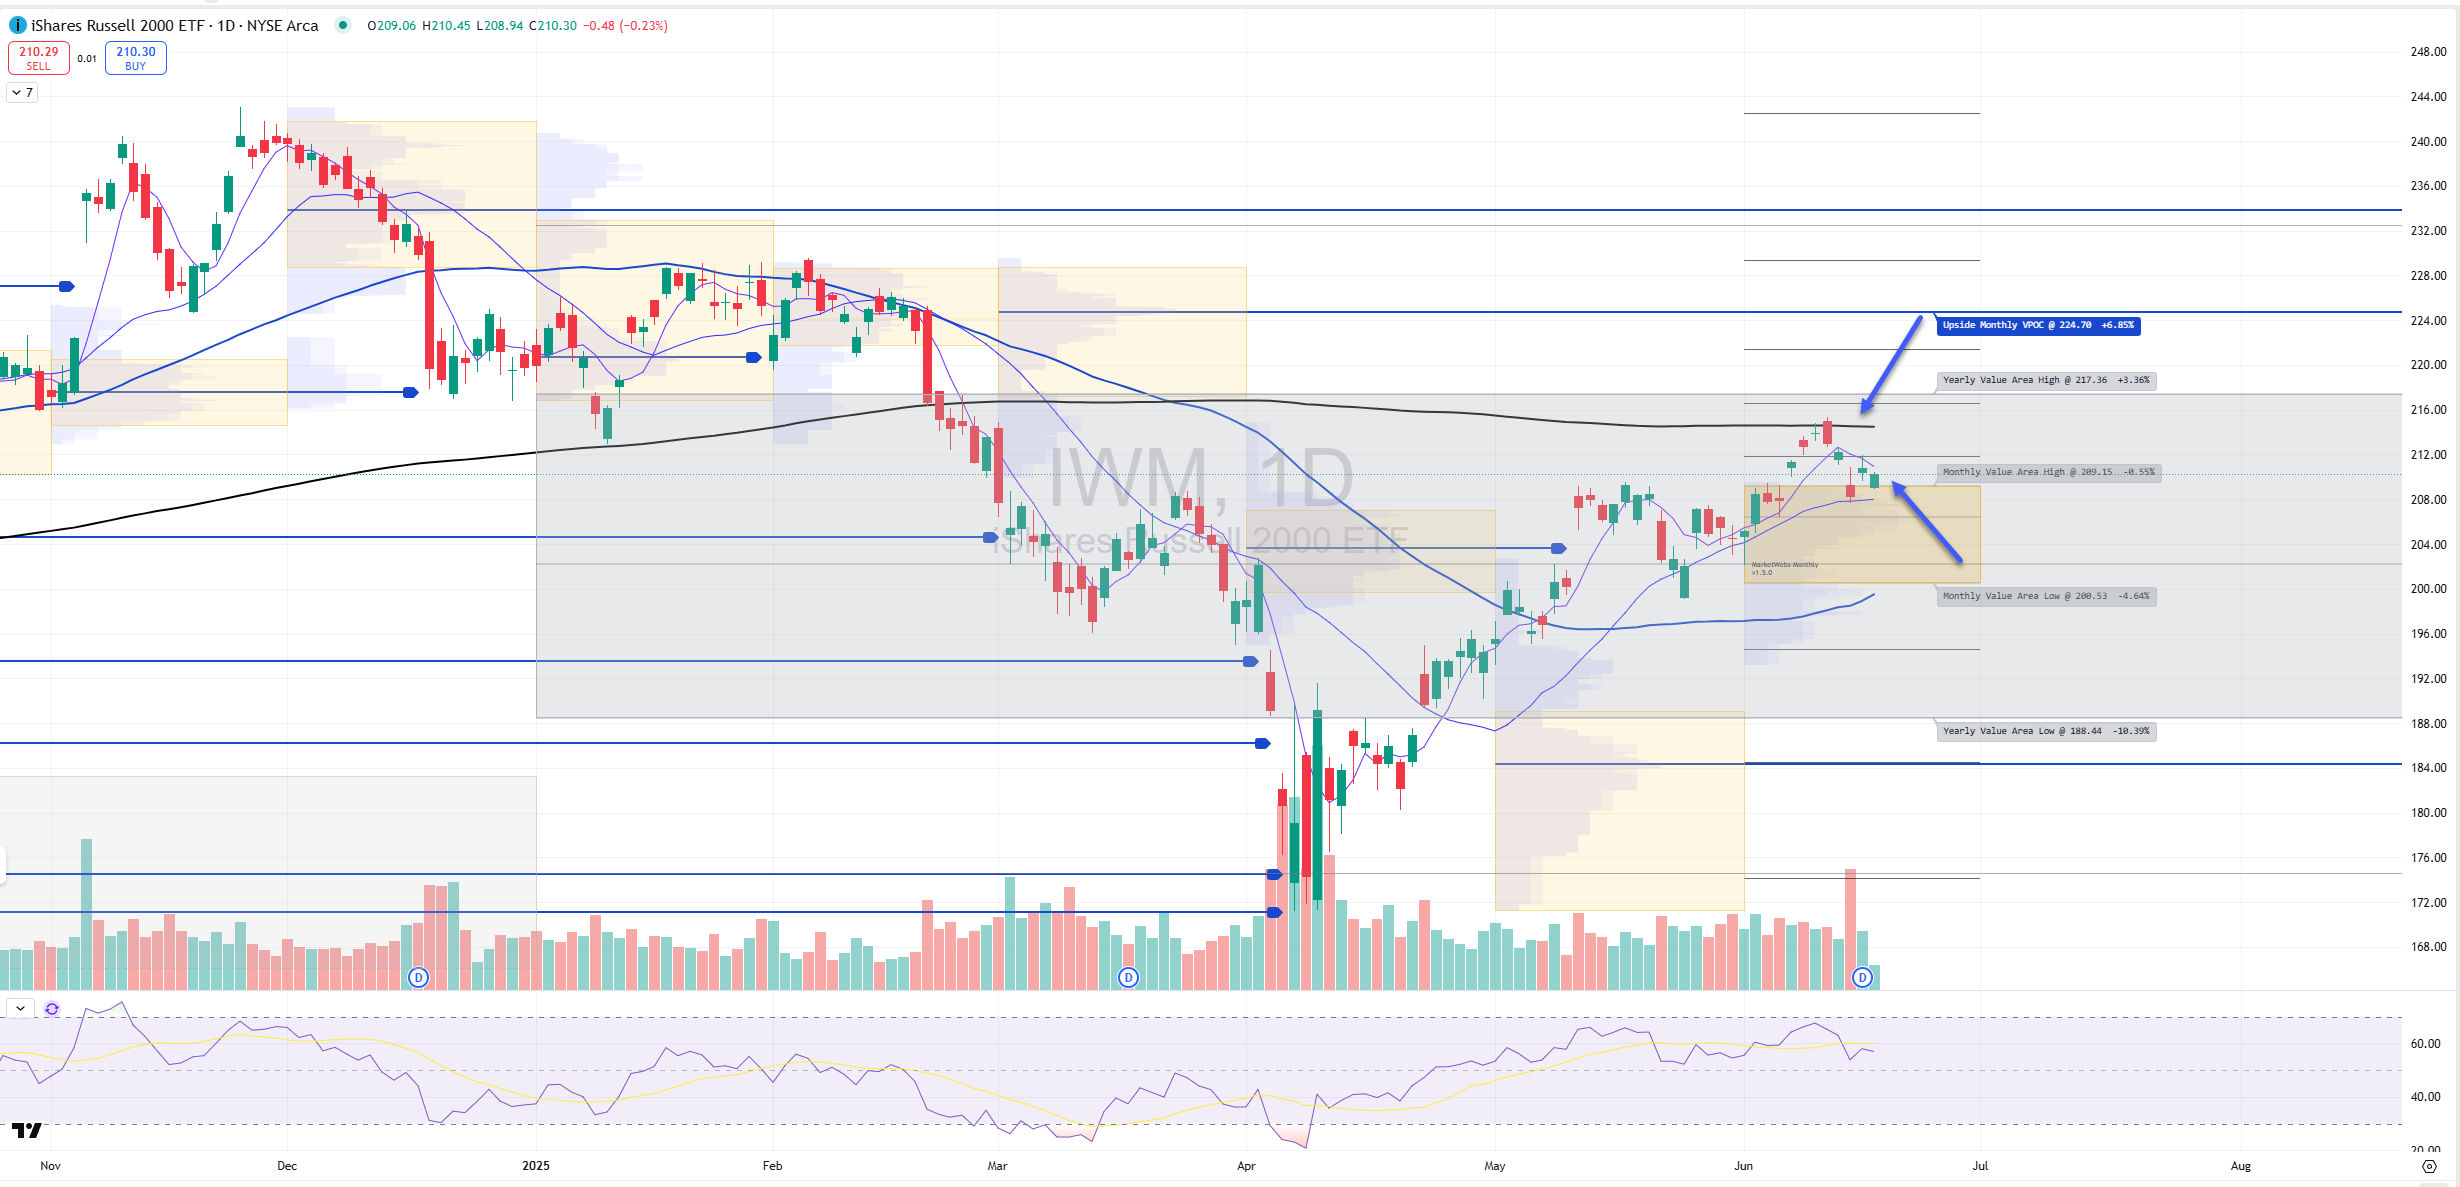
IWM Daily chart (note the Daily Chart contains this month’s Value Area)
Small Caps back above its June Value Area (support $209.15) but still decently below its 200d MA
TTG Trading Edge Program
Click Here to be a Full TTG Member
Charts I am watching / Trade Ideas + Position Update
Keep reading with a 7-day free trial
Subscribe to The Tribeca Trade Group to keep reading this post and get 7 days of free access to the full post archives.