Happy New Year!
One of my favorite things about a new year is New Value Areas to help map out price and significant support and resistance.
I like to start with the S&P because it is the most widely watched equity index in the world. So, what is the new Value Area telling us?
First, if you are not familiar with using Volume At Price and Value Areas here is a quick primer:
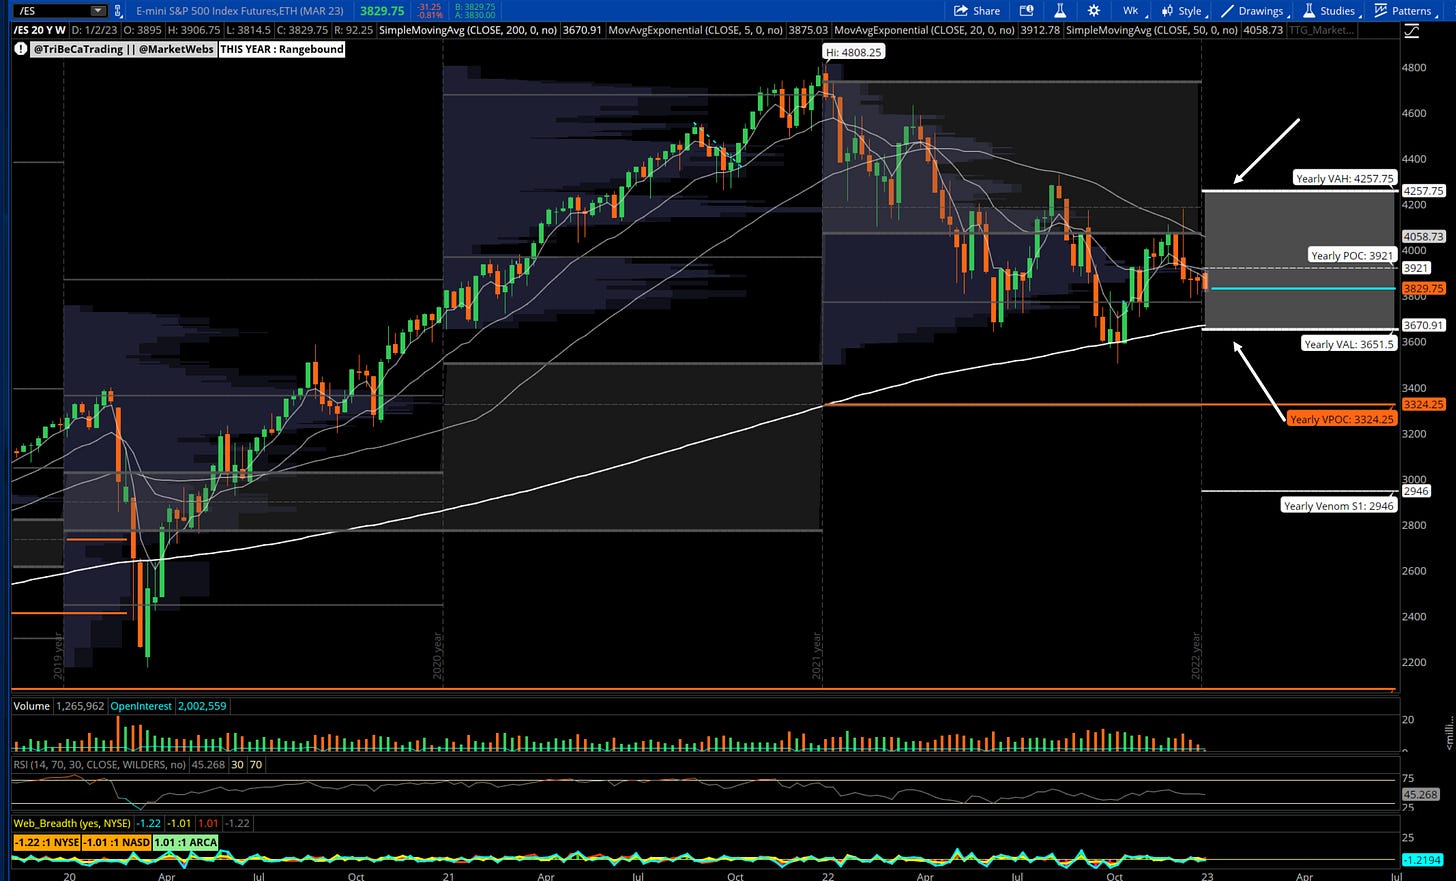
$ES_F S&P futures weekly chart
Price is starting the new year inside the new Value Area and at the POC (Point of Control) which indicates some indecision as the POC is where the majority of volume has occurred in the previous period. So, to start, price is sideways / range bound and it will be interesting once price tests support 3651.5 / resistance 4257.75 but for now price is range bound.
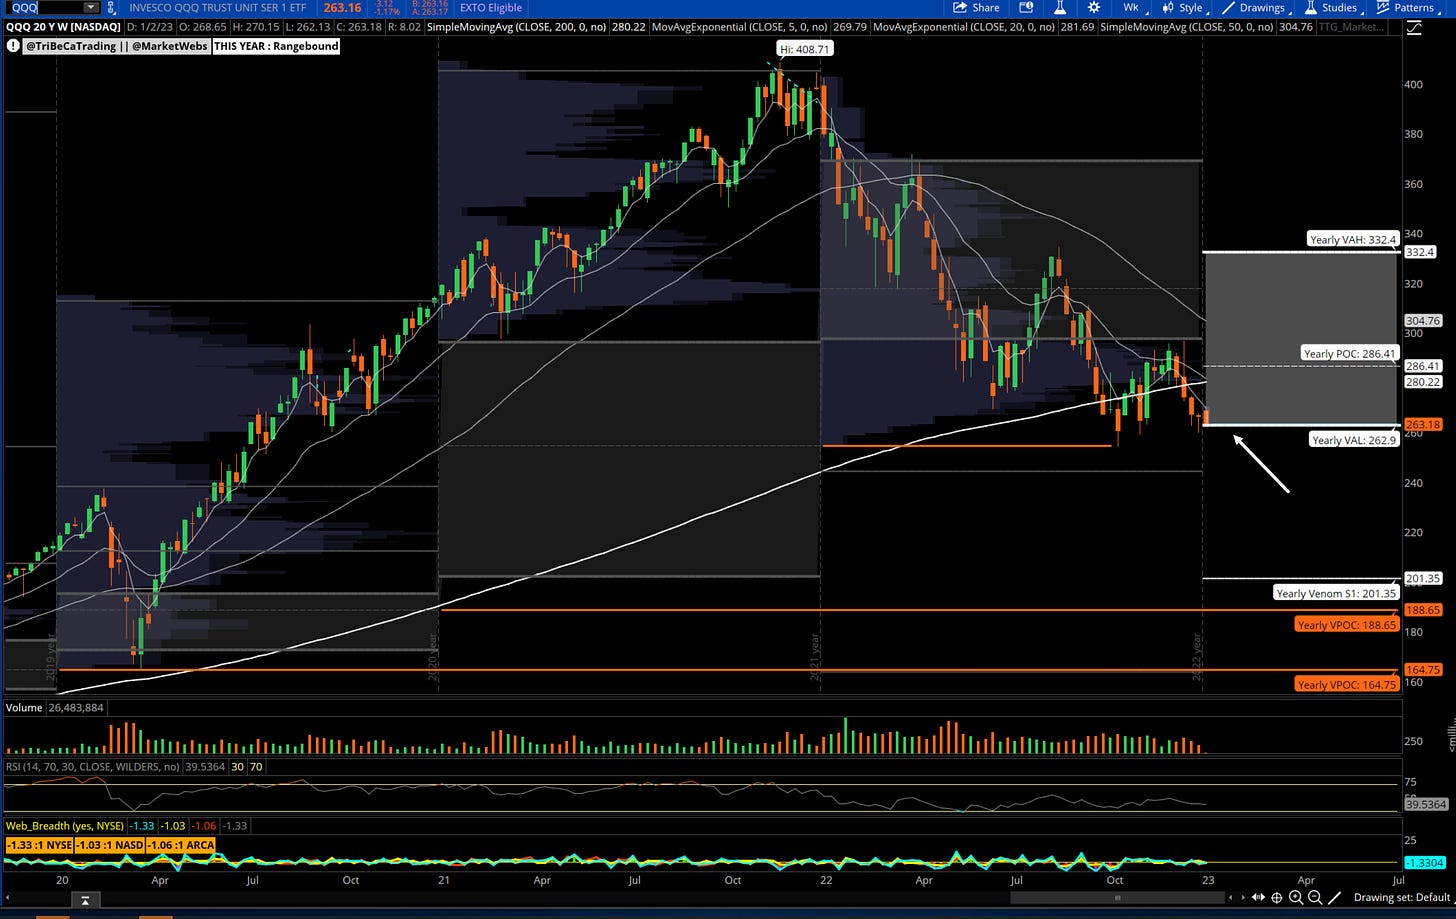
QQQ NDX 100 weekly chart
A different looking picture here compared to the SPX. As ‘22 showed the QQQs have relative weakness and are hanging by a thread here with support $262.9, further is very close to revisiting the ‘22 lows and the VPOC support (red line). Next lower support I see on Daily chart (not pictured) is $242.72
Also interesting here is the difference in Commodity charts… Crude and Nat Gas are weak and trending lower and precious metals look stronger.
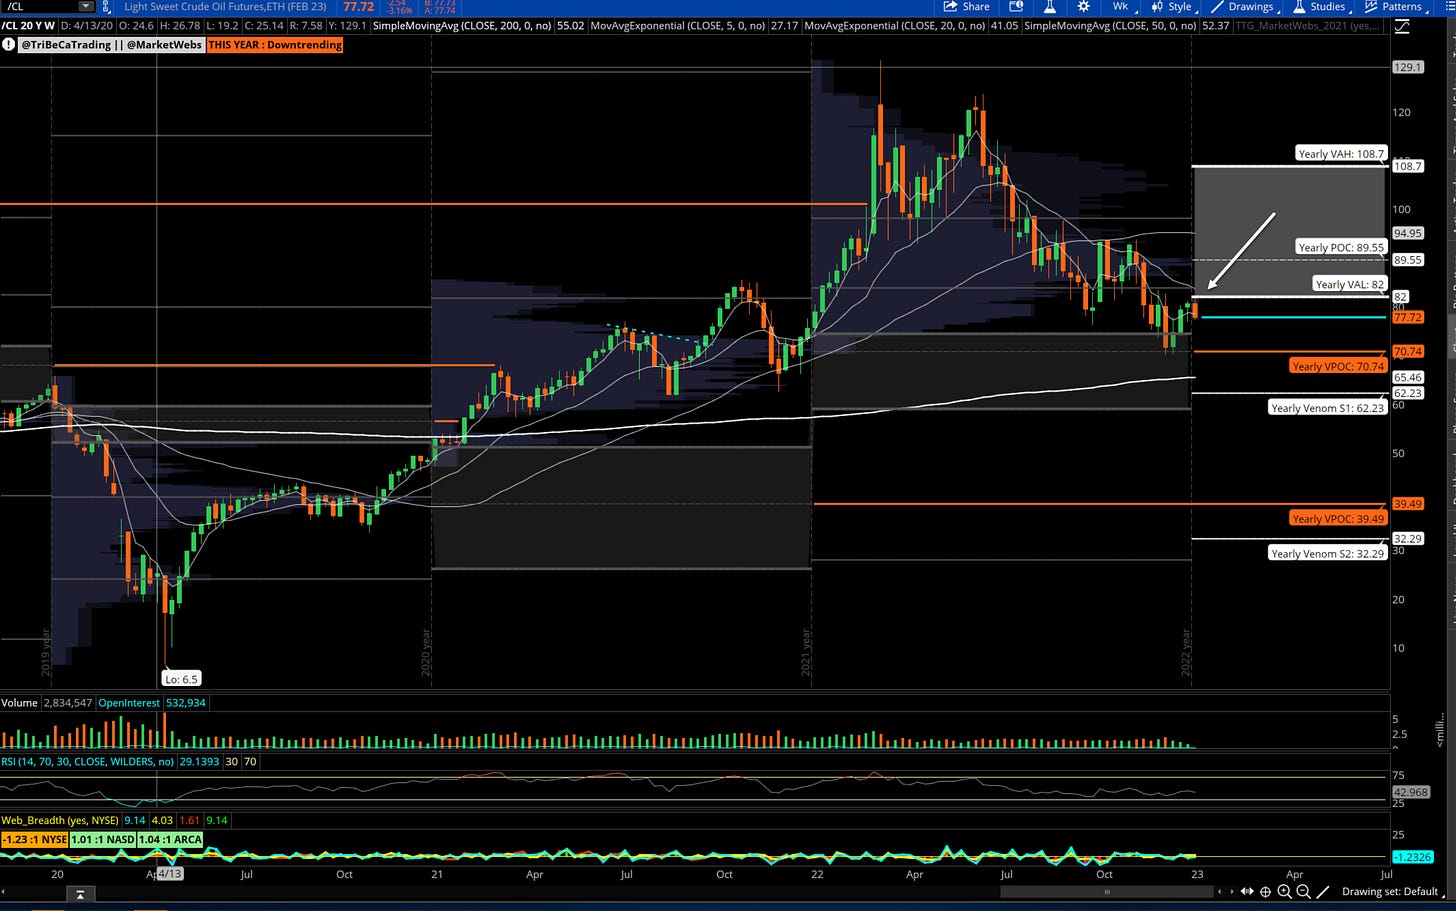
CL_F WTI Crude futures
Unless Crude can retake $82 the commodity continues to look weak and trend lower
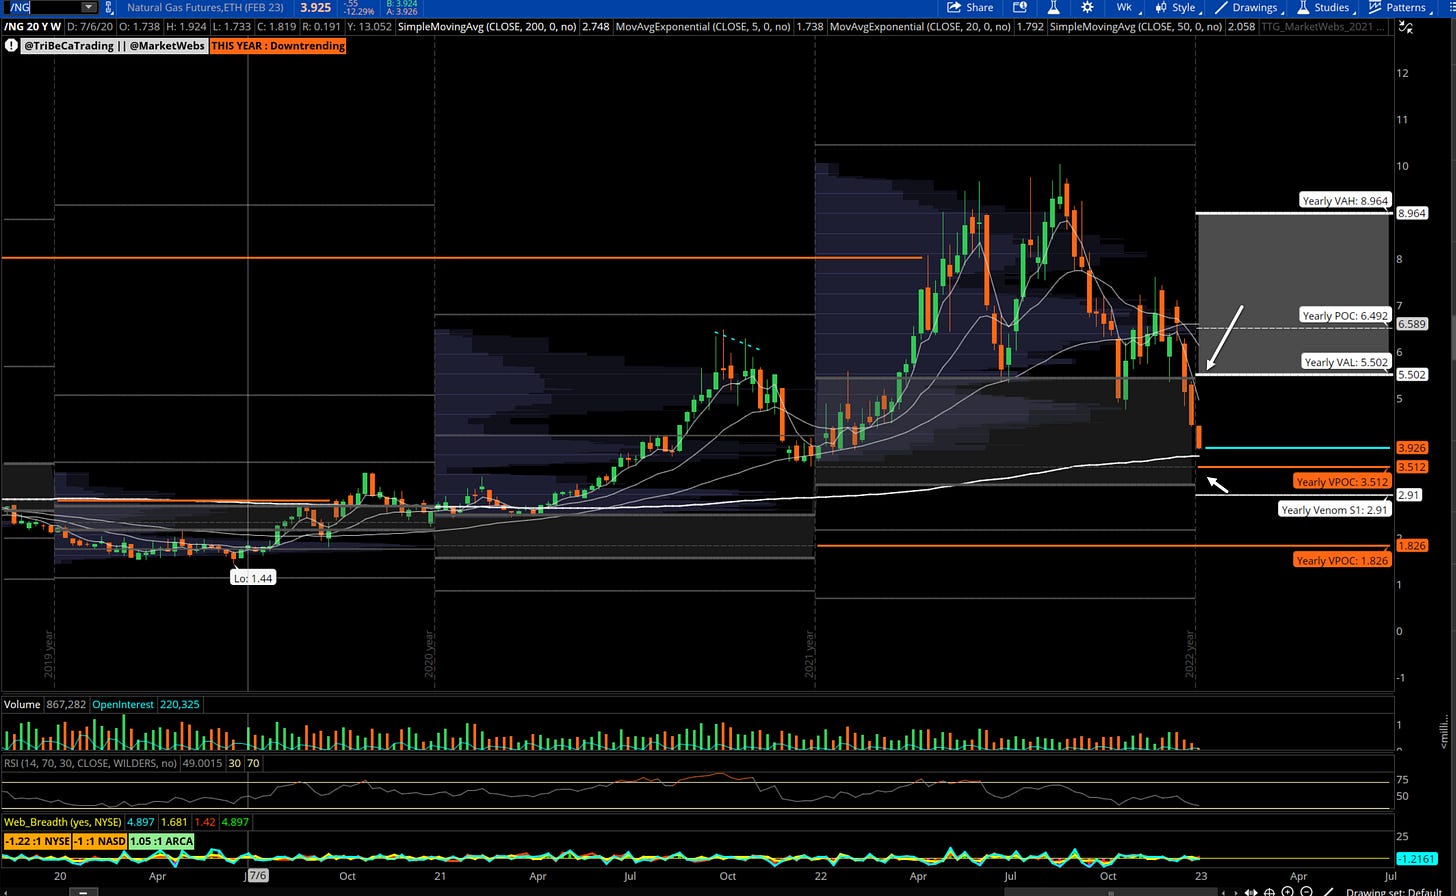
NG_F WTI Crude futures
Similar to Crude, starting the year below Value Area and trending lower.
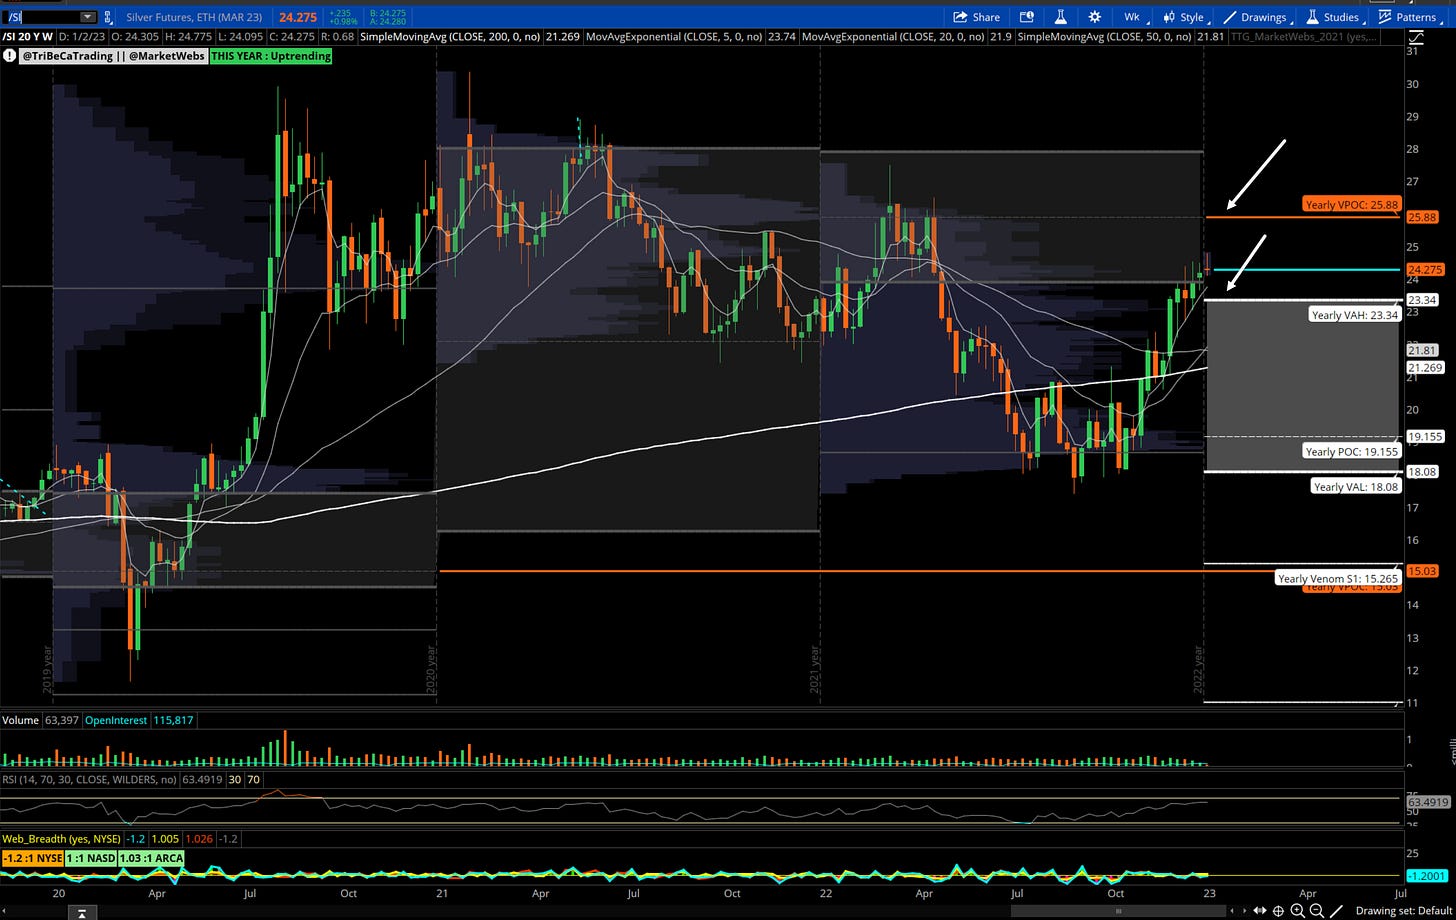
SI_F Silver futures
Starts the year above its ‘23 Value Area, support $23.34 and upside VP{OC (Overhead supply) $25.88
My must watch chart to start year:
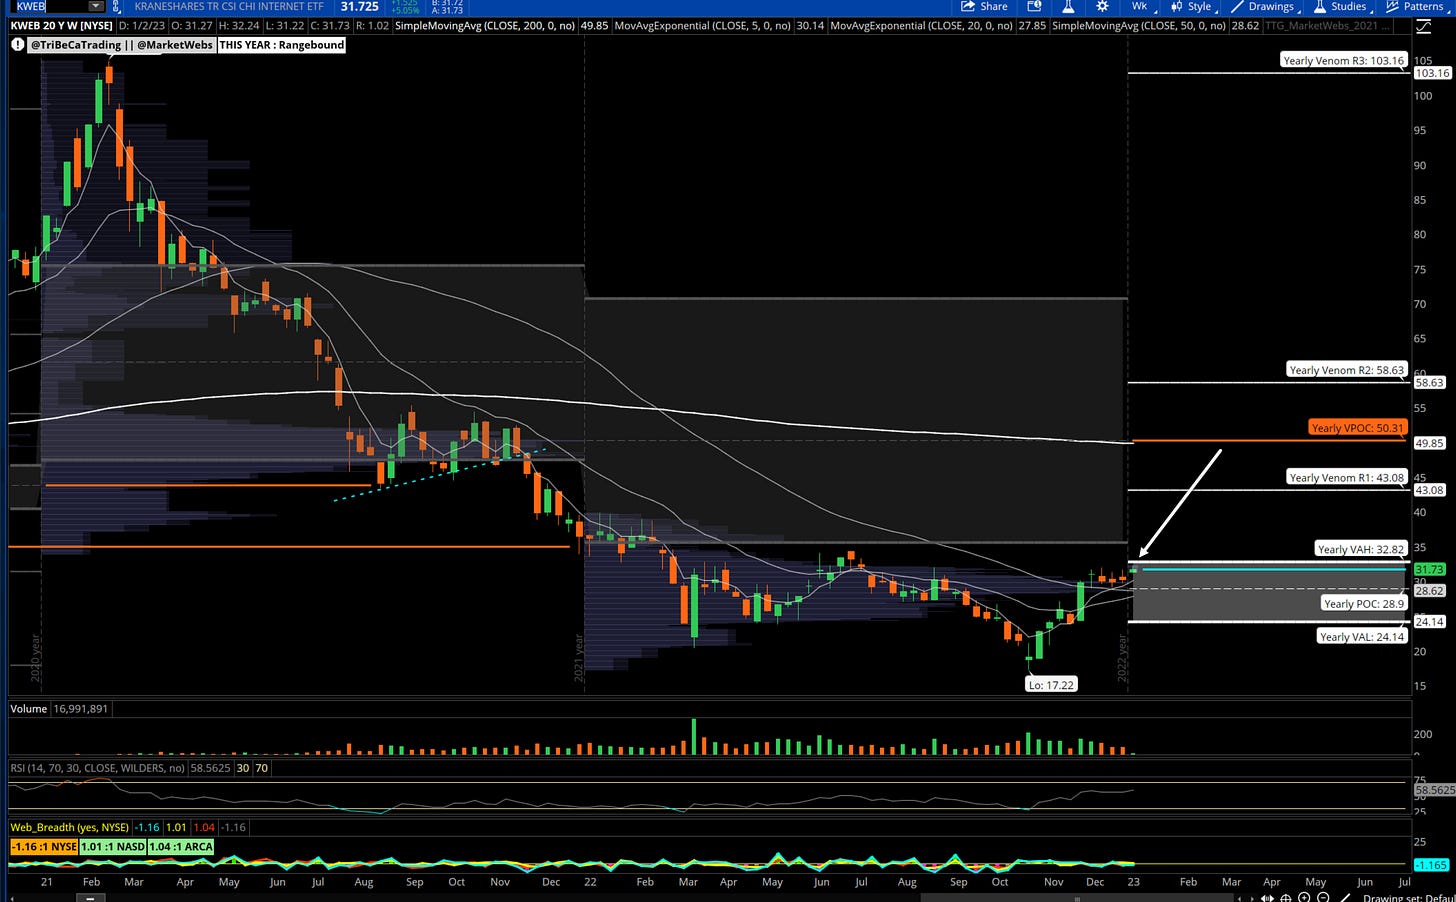
KWEB China Internet ETF
the China Internet ETF may be on to some serious strength here but first needs clear its ‘23 Value Area, I am watching $32.82
Want to hear more regarding using Volume At Price with the TTG MarketWebs Indicator and how I use it to trade? We are holding a member webinar at 5pm est today to go over these points and analyze sectors & single stocks plus Q&A.
Sign up here to be a TTG Member and get 50% off your first month
Note, unlike other indicators that use Volume At Price (ie anchored VWAP) there is no involvement by traders (no setting anchored price), the MarketWebs Value Areas are set automatically!
Copyright © Tribeca Trade Group. All of the information in this newsletter is for entertainment and educational purposes only and is not to be construed as investment or trading advice. None of the information in this newsletter is guaranteed to be accurate, complete, useful or timely. IMPORTANT NOTICES AND DISCLAIMERS TriBeCa Trade Group is not an investment advisor and is not registered with the U.S. Securities and Exchange Commission or the Financial Industry Regulatory Authority. Further, owners, employees, agents or representatives of TriBeCa Trade Group are not acting as investment advisors and might not be registered with the U.S. Securities Authority


