


Market Observations & Charts 9-12-22

Quick observations (attached audio message for TTG Members, note TTG members receive this email Mon, Wed, Thurs and Midday Live Session Tues & all trades are sent to members real time / position sheet sent end of day)
- Breadth is positive for the day
- VIX +3.6% 23.6
- US Dollar decent weakness -0.7%
- Bonds are flat
- Indices grind higher, S&P and NDX approaching short term (1hr) VPOCs
Bottom Line: The Market has been on a nice run and I have taken some profits in names MNTK CEG AXNX AR and have reduced risk into the CPI report tomorrow. Am I expecting fireworks? No, but just being responsible in a Fed tightening market & weak seasonal month... on the plus side, I do like the weaker US Dollar today. I have listed quite a few setups below, but many of which are lower volatility type names... I think that growth names can have spurts here and there but the leaders remain in Utilities, Solar, HC / Biotech, and Energy mostly.
Market Breadth Indicator

% change from open


Charts
ES_F S&P futures 1hr Chart
Short term upside target is 4145.25 , may see digestion here

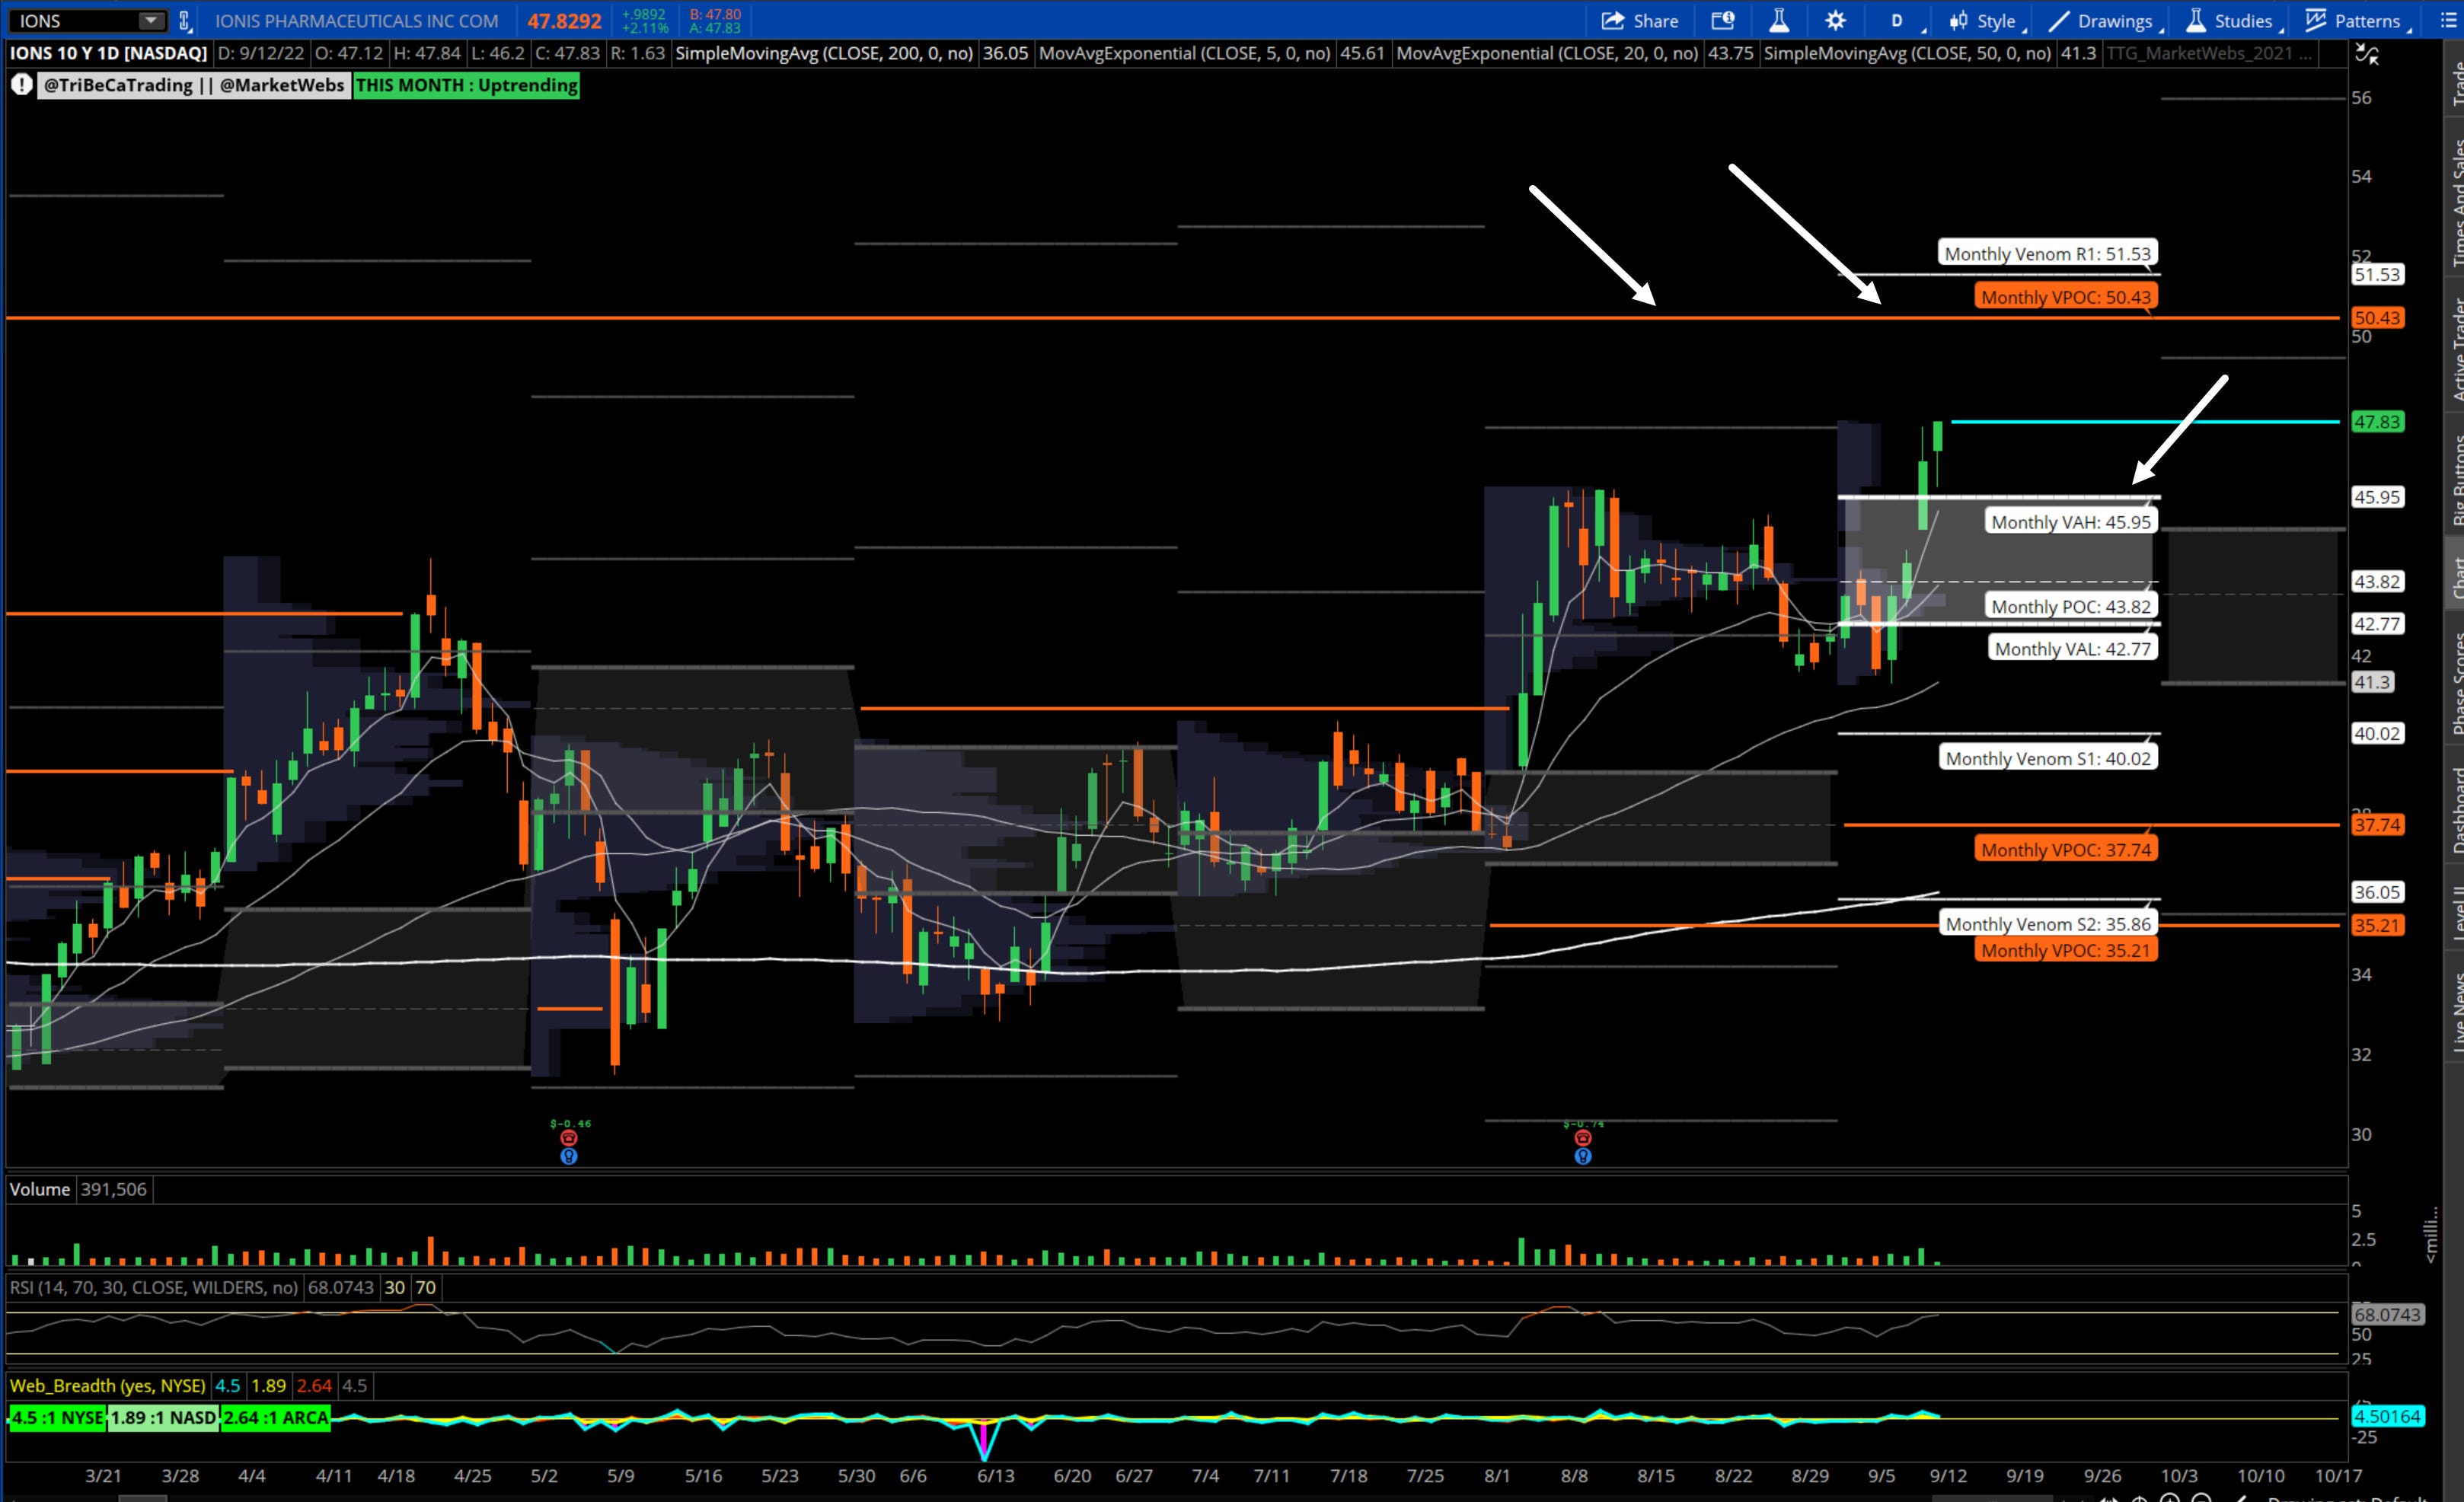
IONS Ionis Pharmaceuticals, Inc- Daily Chart
Ionis Pharmaceuticals, Inc. operates as a biotechnology company. The Company researches in
RNA-targeted drug discovery and development that focuses on drugs for patients who have unmet
medical needs. Ionis Pharmaceuticals serves customers in the United States.
Breaking out of its Sep Value Area, upside PT $50.4
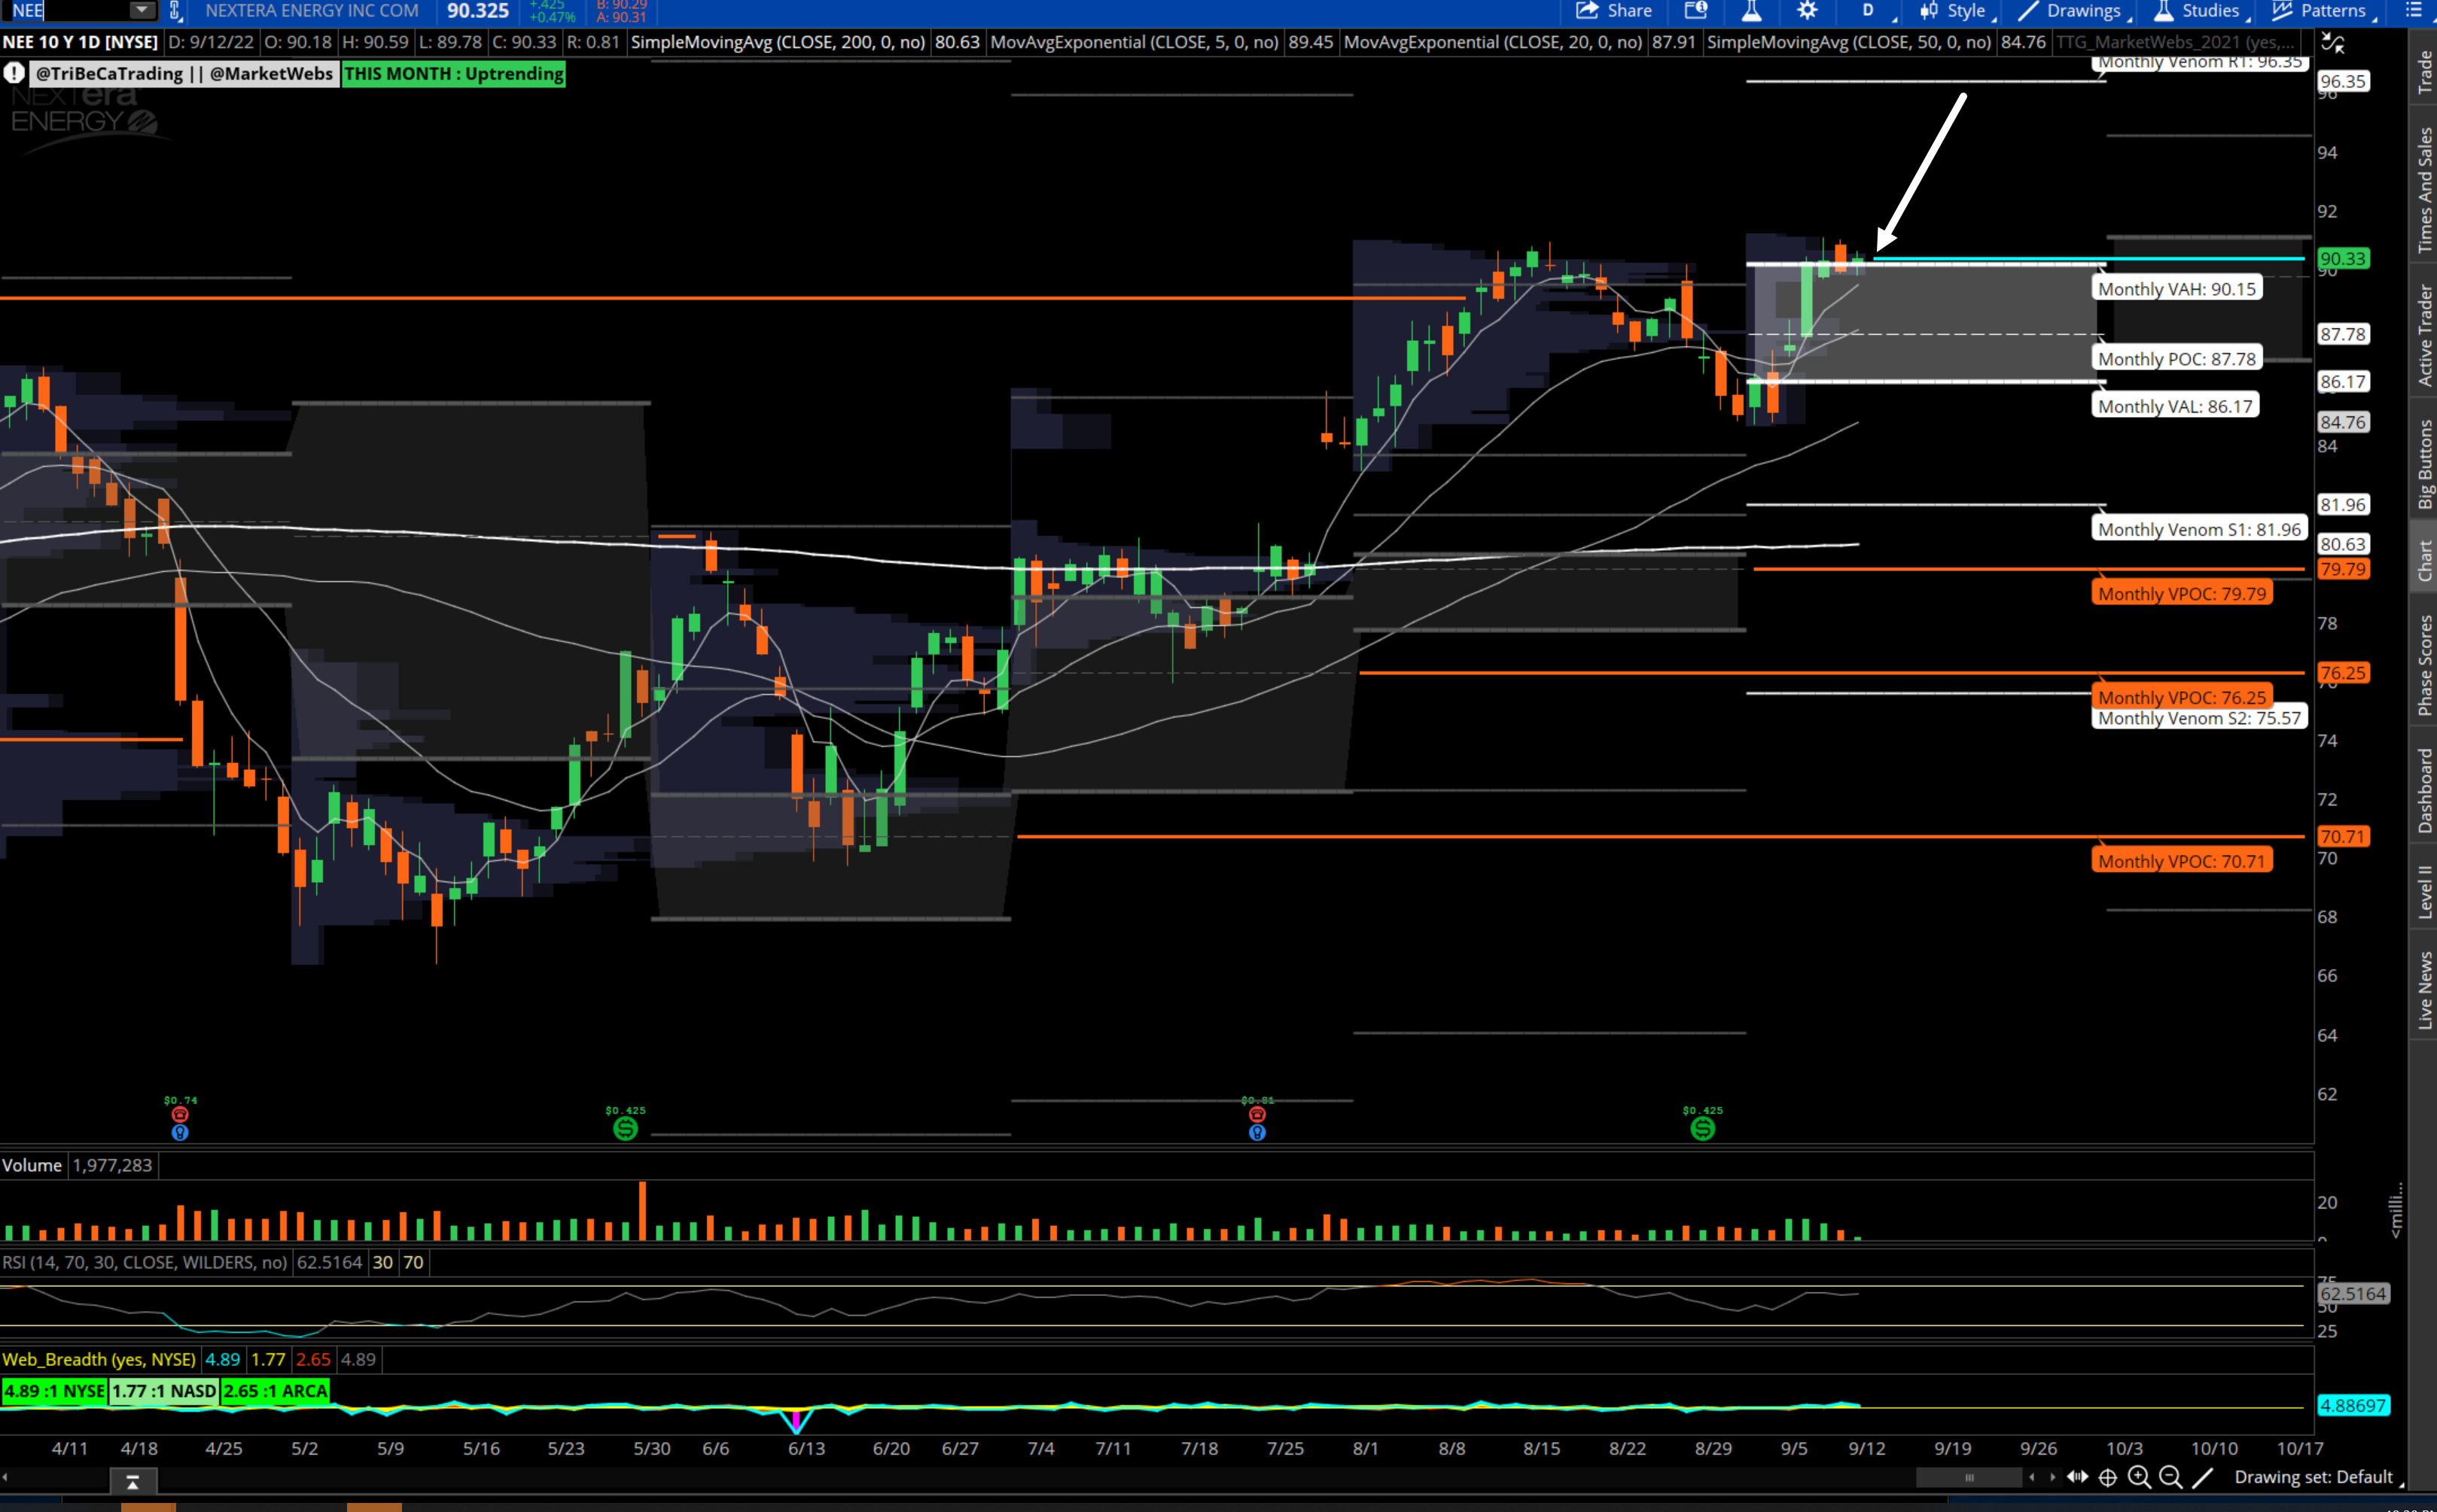
NEE Nextera Energy Daily Chart
Watch for a break above value area and Friday's highs , trend remains strong here
UNH UnitedHealth Group Daily Chart
Breaking back into the Sep Value Area and above all Moving Averages

RYTM Rhythm Pharmaceuticals, Inc. Daily Chart
Breaking above the Sep Value Area. if can stay above $25.77 then can target $31

SQM Sociedad Quimica y Minera de Chile SA. Daily Chart
Agriculture and Lithium producer checking back to the top of Sep Value Area support
(I was in this name last week and took profits, looking to re-add this week)

RSG Republic Services, Inc. Daily Chart
Quiet the last couple days.. watch for a move > $149.2 (I remain long)

VRTX Republic Services, Inc. Daily Chart & 1hr chart
Price moving back > all Moving Averages, short term px tgt $299


ESTC Elastic N.V. Daily Chart
Price now back above Sep Value Area and 200d MA , if price remains above 200d MA , can target $95.85, then $102.5

I hope you found this post helpful!
Here is what you can do to support my work.
Leave a like on this post below
Share this post on Twitter using the button below
Copyright © Tribeca Trade Group. All of the information in this newsletter is for entertainment and educational purposes only and is not to be construed as investment or trading advice. None of the information in this newsletter is guaranteed to be accurate, complete, useful or timely. IMPORTANT NOTICES AND DISCLAIMERS TriBeCa Trade Group is not an investment advisor and is not registered with the U.S. Securities and Exchange Commission or the Financial Industry Regulatory Authority. Further, owners, employees, agents or representatives of TriBeCa Trade Group are not acting as investment advisors and might not be registered with the U.S. Securities Authority