Market Observations & Charts 8-18-22
Quick observations (attached audio message for TTG Members, note TTG members receive this email Mon, Wed, Thurs and Midday Live Session Tues)
- Breadth, which i thought would be a tell for the day, currently is indicating we have chop today
- Bonds gave back early gains
- US Dollar in strong today
- Energy is very strong today
- Bottom line: Chop is my word of day and that doesn’t surprise me - I talked about the possibility of a sideways market in detail about a week ago and I am ok w/ this scenario playing out as it is more of a “stock pickers” market.
Breadth: between -2 and +2 is “chop”
% change from open
Must watch Charts
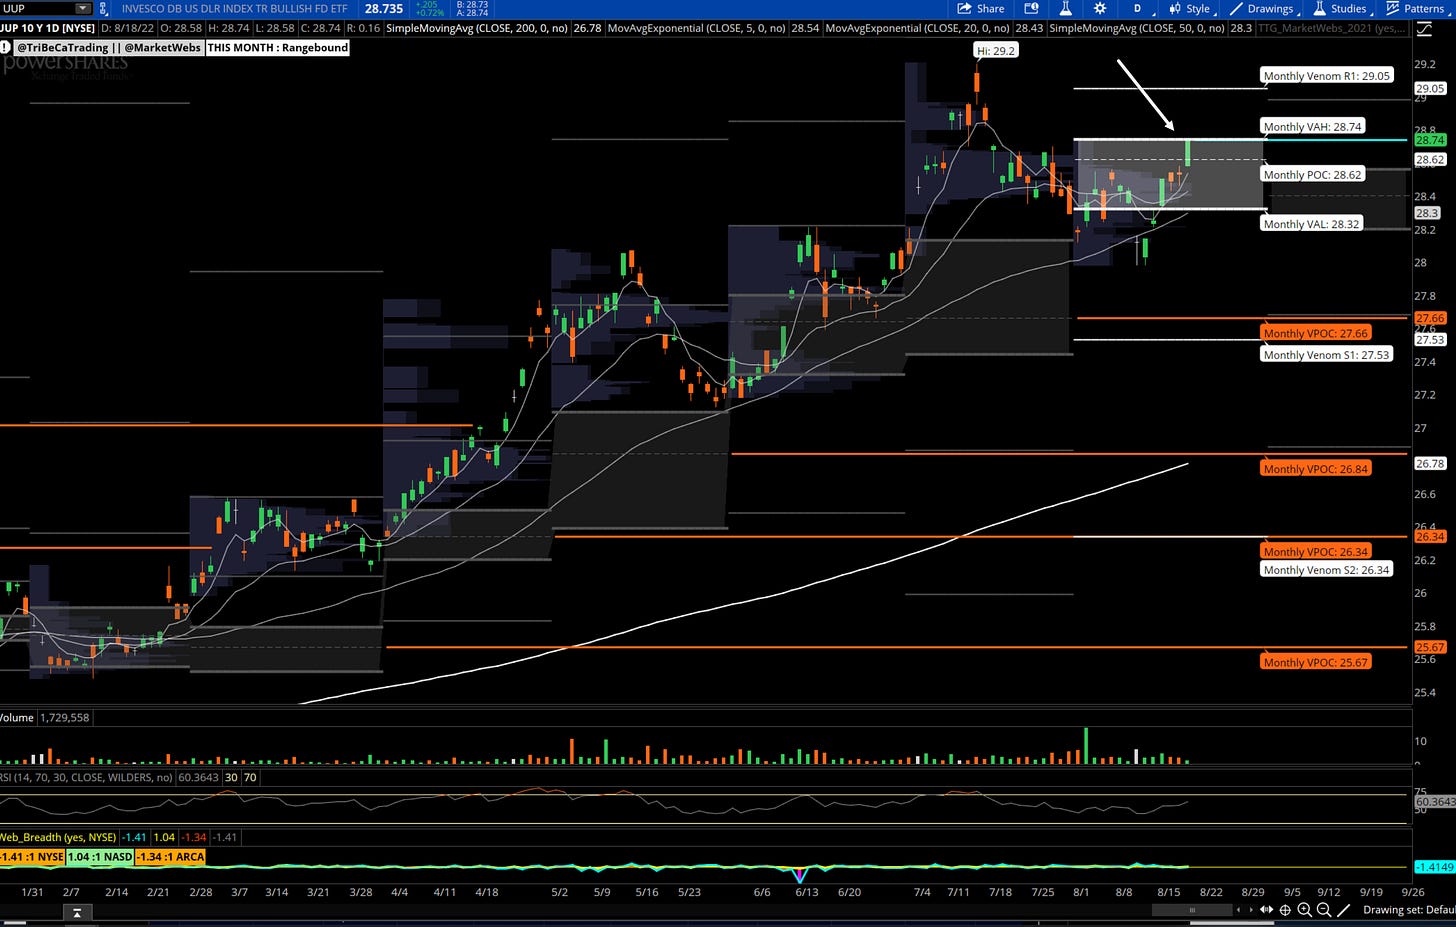
UUP US Dollar -very strong today and now testing top of Aug Value, keep an eye on $28.74 .. remember a strong dollar can be an indicator for "risk off"
$CL_F Crude 1hr RSI divergence
Very interesting there was a 1hr Bullish Divergence on Crude 1hr chart this week - the price of crude wen lower, but RSI did not confirm it and there can often be reversals off of these divergences.
AMR Alpha Metallurgical Resources, Inc.
big strength in coal names BTU AMR CEIX ARLP - I added a position back in AMR today
BPT BP Prudhoe Bay Royalty
This BPT had great strength over last year. I am watching for the turn back higher and into Aug Value Area, watch $16.43 for trigger.
FCG - Nat Gas Co ETF breaking above recent consolidation, see below for largest weights in ETF. Note, considering many of these charts look similar, I like owning the FCG ETF here vs picking a couple of the individual names.
GFS GLOBALFOUNDRIES Inc.
love the strength here and I like positioning in this one on dips . would like to be in this one for a while if it continues to see strength . The plan is to take profits when it rips and buy on dips and keep some core position.
AMRC Ameresco Inc.
an integrated electric energy corporation. The Company supplies a range of energy solutions, including energy cogeneration, hydro electric, and renewable energy facilities.
This group is hot right now , see CEG chart for example. I like the trend here. Watch for a weekly candle close AMRC > $70.05 for a break above the yearly Value Area
I hope you found this post helpful!
Here is what you can do to support my work.
Leave a like on this post below
Share this post on Twitter using the button below
Copyright © Tribeca Trade Group. All of the information in this newsletter is for entertainment and educational purposes only and is not to be construed as investment or trading advice. None of the information in this newsletter is guaranteed to be accurate, complete, useful or timely. IMPORTANT NOTICES AND DISCLAIMERS TriBeCa Trade Group is not an investment advisor and is not registered with the U.S. Securities and Exchange Commission or the Financial Industry Regulatory Authority. Further, owners, employees, agents or representatives of TriBeCa Trade Group are not acting as investment advisors and might not be registered with the U.S. Securities Authority
Thanks for reading The Tribeca Trade Group ! Subscribe for free to receive new posts and support my work.
✓


