The US Indices “Stuck in the Middle”
$ES_F S&P futures
Make no mistake here, the US Indices are all in downtrends. What I generally look for is areas of interest (support / resistance) and why I say for now that price is stuck in the middle is because using Volume at Price indicates that Price is decently below the June Value Area and lower VPOCs (Virgin Point of Control). So short term resistance is 3893 and next support down is 3553 and price is currently at an extension from the June Value Area 3688, in the middle of short term support / resistance. $QQQ and $IWM charts also have a similar ‘Stuck in the Middle” look.
Next, let’s look at some indicators to see if we can gain some perspective
The Fed and Inflation
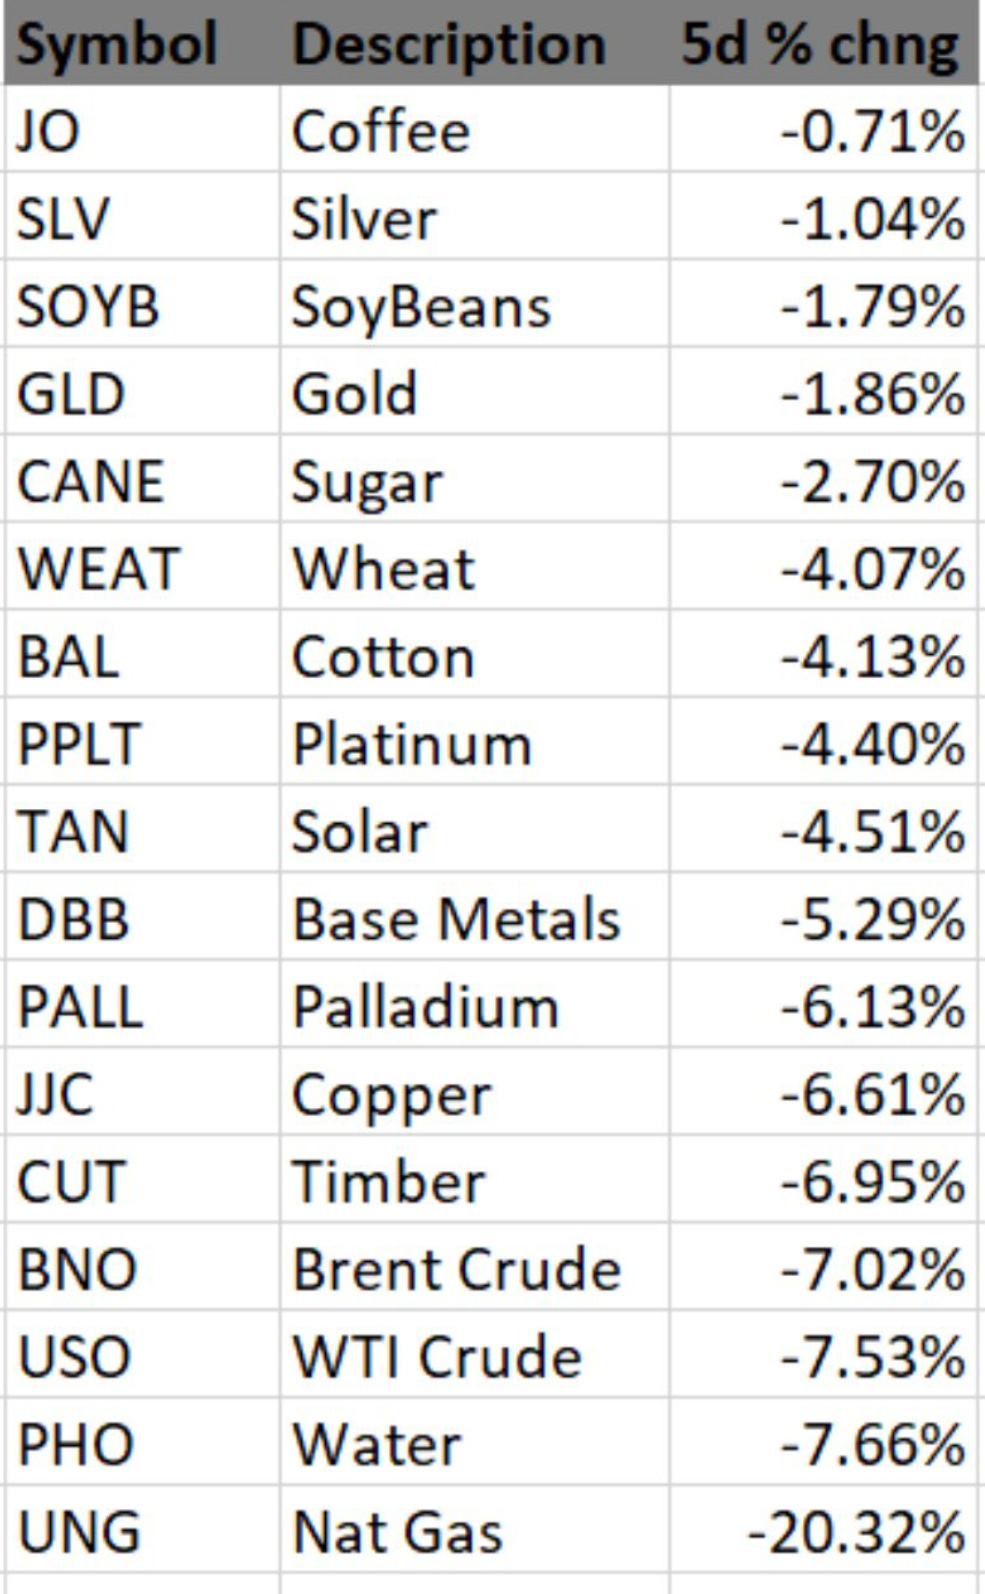
Inflation is a top concern, and for the possibility of Fed pivoting from aggressively increasing interest rates, the inflation data needs to cool and some of the reports that are important includes CPI, PPI, and PCE Deflator. Unfortunately, the next read on inflation using these data points is not until the end of the month, Jun 30th for PCE Deflator. However, we can make some observation to note a possible change in inflation . For example, what happened in commodities last week?
Here’s a look at some of the Commodity charts:
$NG_F Nat Gas futures
- broken below the June Value Area to the downside VPOC target.
$CL_F WTI Crude futures
- breaking down to 50d MA
$ZW_F Wheat futures
- possible breakdown in the making
- Short Idea: as long as price stays below $1077, look for a potential move down to $960.5
$HG_F Copper
- has dropped below the May lows
Commodity Conclusion: Many are off the highs and some are breaking down, this could be an indication that inflation has topped but we need to see the data as that includes other areas of inflations (ie wages and consumer prices).
Notable Indicators & Sentiment
CFTC CME E Mini S&P 500 Asst Mgr Institutional Net Total/Futures
- the buyer’s strike continues.. not only are we seeing a lack of buying and selling in single stocks but also in S&P futures contracts which indicate positioning at a multi-year low
- note how extreme the level is… and perhaps any good news can provide a bounce given the level
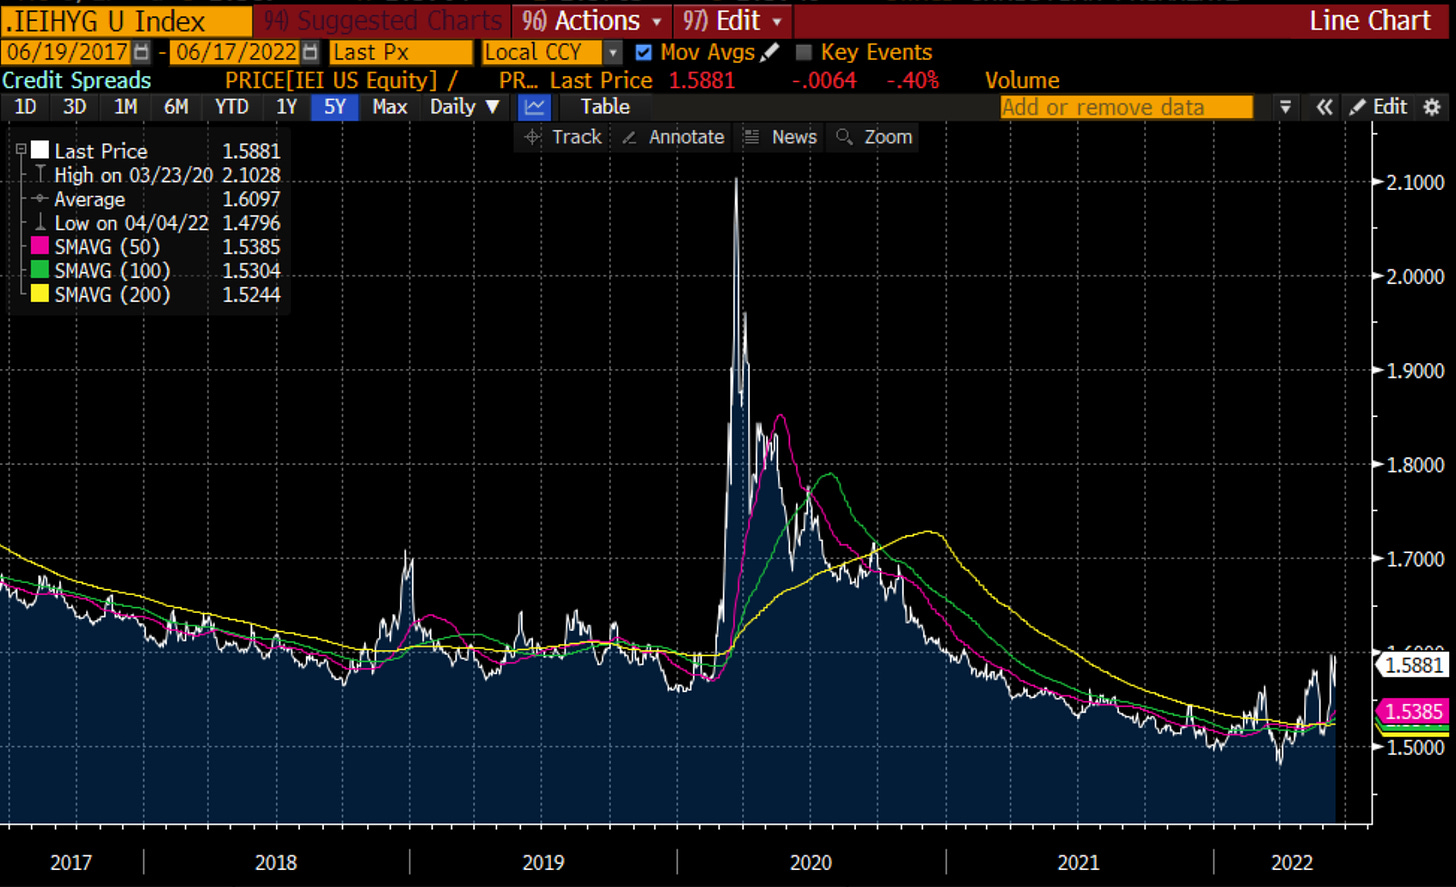
Credit Spreads and 5yr HY CDX
- both are widening, representing increased risk
Cash Equivalent ETFs
BIL - the T-Bill ETF posted +$3.0B of inflows, indicating a decent amount of cash has moved to the sidelines, this can be used as a contrarian indicator as the BIL ETF saw large inflows too late in ‘20 and equities rebounded soon thereafter
Sentiment
Washed out and as Bofa called it in their weekly Flow Show Report “uber - bearish” positioning.
Charts of Interest
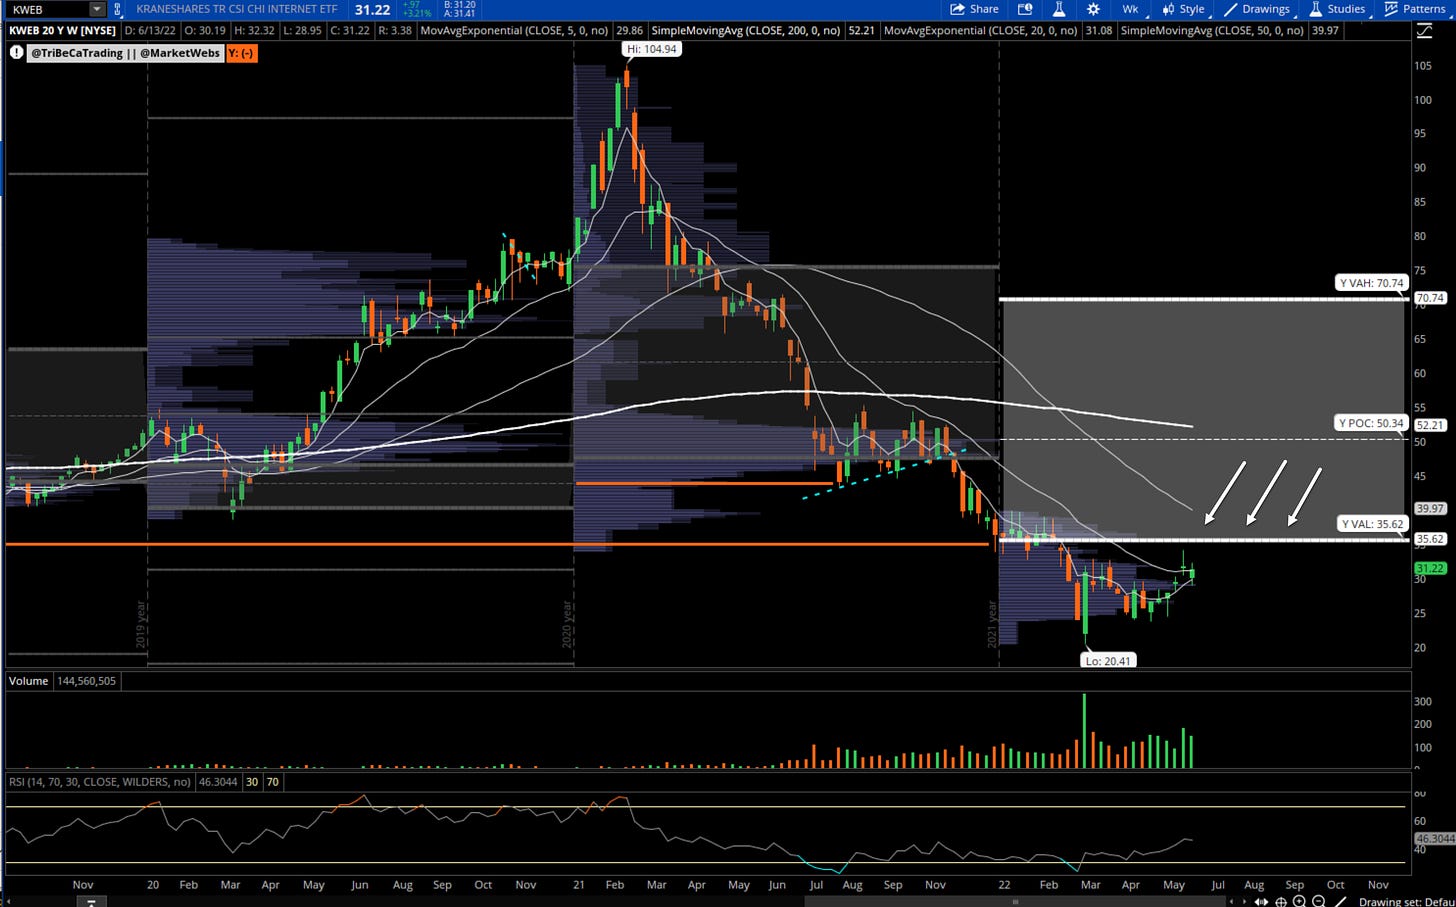
KWEB - China Internets
- the group is showing relative strength and for a technical break higher I am watching $35.62 on the weekly chart which represents a break into the yearly value area.
- the Chinese Internets were one of the first groups to break down in ‘21 , could they be one of the first to bottom? I am watching closely here…
Conclusion
The trend remain down in the US Indices and that is most important to me from a risk & technical standpoint and I continue to be over 90% cash in my trading account and I continue to watch / monitor for divergences , inflation readings, and indicators. Many of which are indicating that a short term bounce is coming but once that bounce occurs the question will be whether it is another bear market market rally or the start of something bigger. I will be watching closely as the summer progresses. Next ,I will discuss single stock setups (for members).
Here is also my interview on Bloomberg TV on Friday
I hope you found this article helpful!
Here is what you can do to support my work.
Leave a like on this post below
Share this post on Twitter using the button below
Copyright © Tribeca Trade Group. All of the information in this newsletter is for entertainment and educational purposes only and is not to be construed as investment or trading advice. None of the information in this newsletter is guaranteed to be accurate, complete, useful or timely. IMPORTANT NOTICES AND DISCLAIMERS TriBeCa Trade Group is not an investment advisor and is not registered with the U.S. Securities and Exchange Commission or the Financial Industry Regulatory Authority. Further, owners, employees, agents or representatives of TriBeCa Trade Group are not acting as investment advisors and might not be registered with the U.S. Securities Authority


For the Love of God
Don't stop publishing this.
Lord this is so good.
Great summary and levels! Any thoughts on corn?